6.2.3 Two-Dimensional Chart Visualization
ViennaMOS provides a two-dimensional chart plotting facility based on the VTK library. The
key mechanisms are provided by the vtkChartXY and the vtkTable classes. The end user
is exposed to the chart mechanism via a chart editor, allowing to customize the
visualization of data generated by modules. Figure 6.9 depicts the utilization of the plotting
tool.
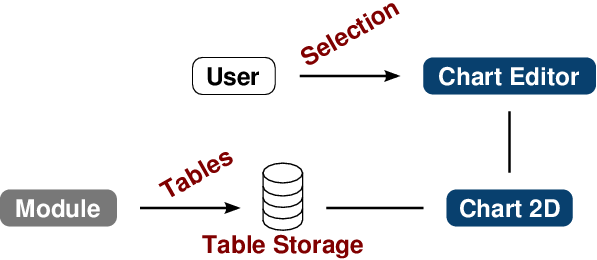
With respect to the implementation, a simulation result is added to the facility by inserting
a new vtkTable into the storage along with meta information, such as the quantity name.
More concretely, vtkDataArrays are used to store the individual data sequences, for instance,
the computed current values and the applied voltage values of a device contact. These arrays
are used to populate a vtkTable which is in turn forwarded to the framework, which
provides access to all available chart rendering instances (Figure 6.10). Similar
to the previously discussed three-dimensional rendering mechanism, the central
VTK-based table storage is not related to ViennaMOS’ communication database. The
requirement of supporting the comparison of different simulation runs is implemented in a
straightforward manner, by using a set of tables, one for each simulation run. This
set is accessed by the chart editor, and in turn used to update the GUI’s Table
List.