6.2.4 Multiview
ViennaMOS allows to use several instances of the previously introduced rendering and chart
visualization simultaneously via the so-called multiview mechanism (Figure 6.11).
The key mechanism is based on a polymorph view entity, which - upon input from an
end user - can be transformed into either a three-dimensional render view or into a
two-dimensional chart view. The essence of the provided comparative views is based on
splitting available views in a horizontal or a vertical manner at the behest of the
end user. This splitting is natively supported by Qt by embedding each view into
a QDockWidget. The following code snippet depicts the simplicity of the splitting
mechanism.
1QDockWidget* dock = new QDockWidget; 2splitDockWidget(multi_view->getCurrentDock(),dock,Qt::Horizontal); 3multi_view->addNewView(dock);
A new dock widget
is generated (Line 1). The multi_view object provides the currently selected QDockWidget,
which is split horizontally - vertical splitting is similarly available - initializing the newly created
dock object (Line 2). The new dock object is forwarded to the multi_view, being
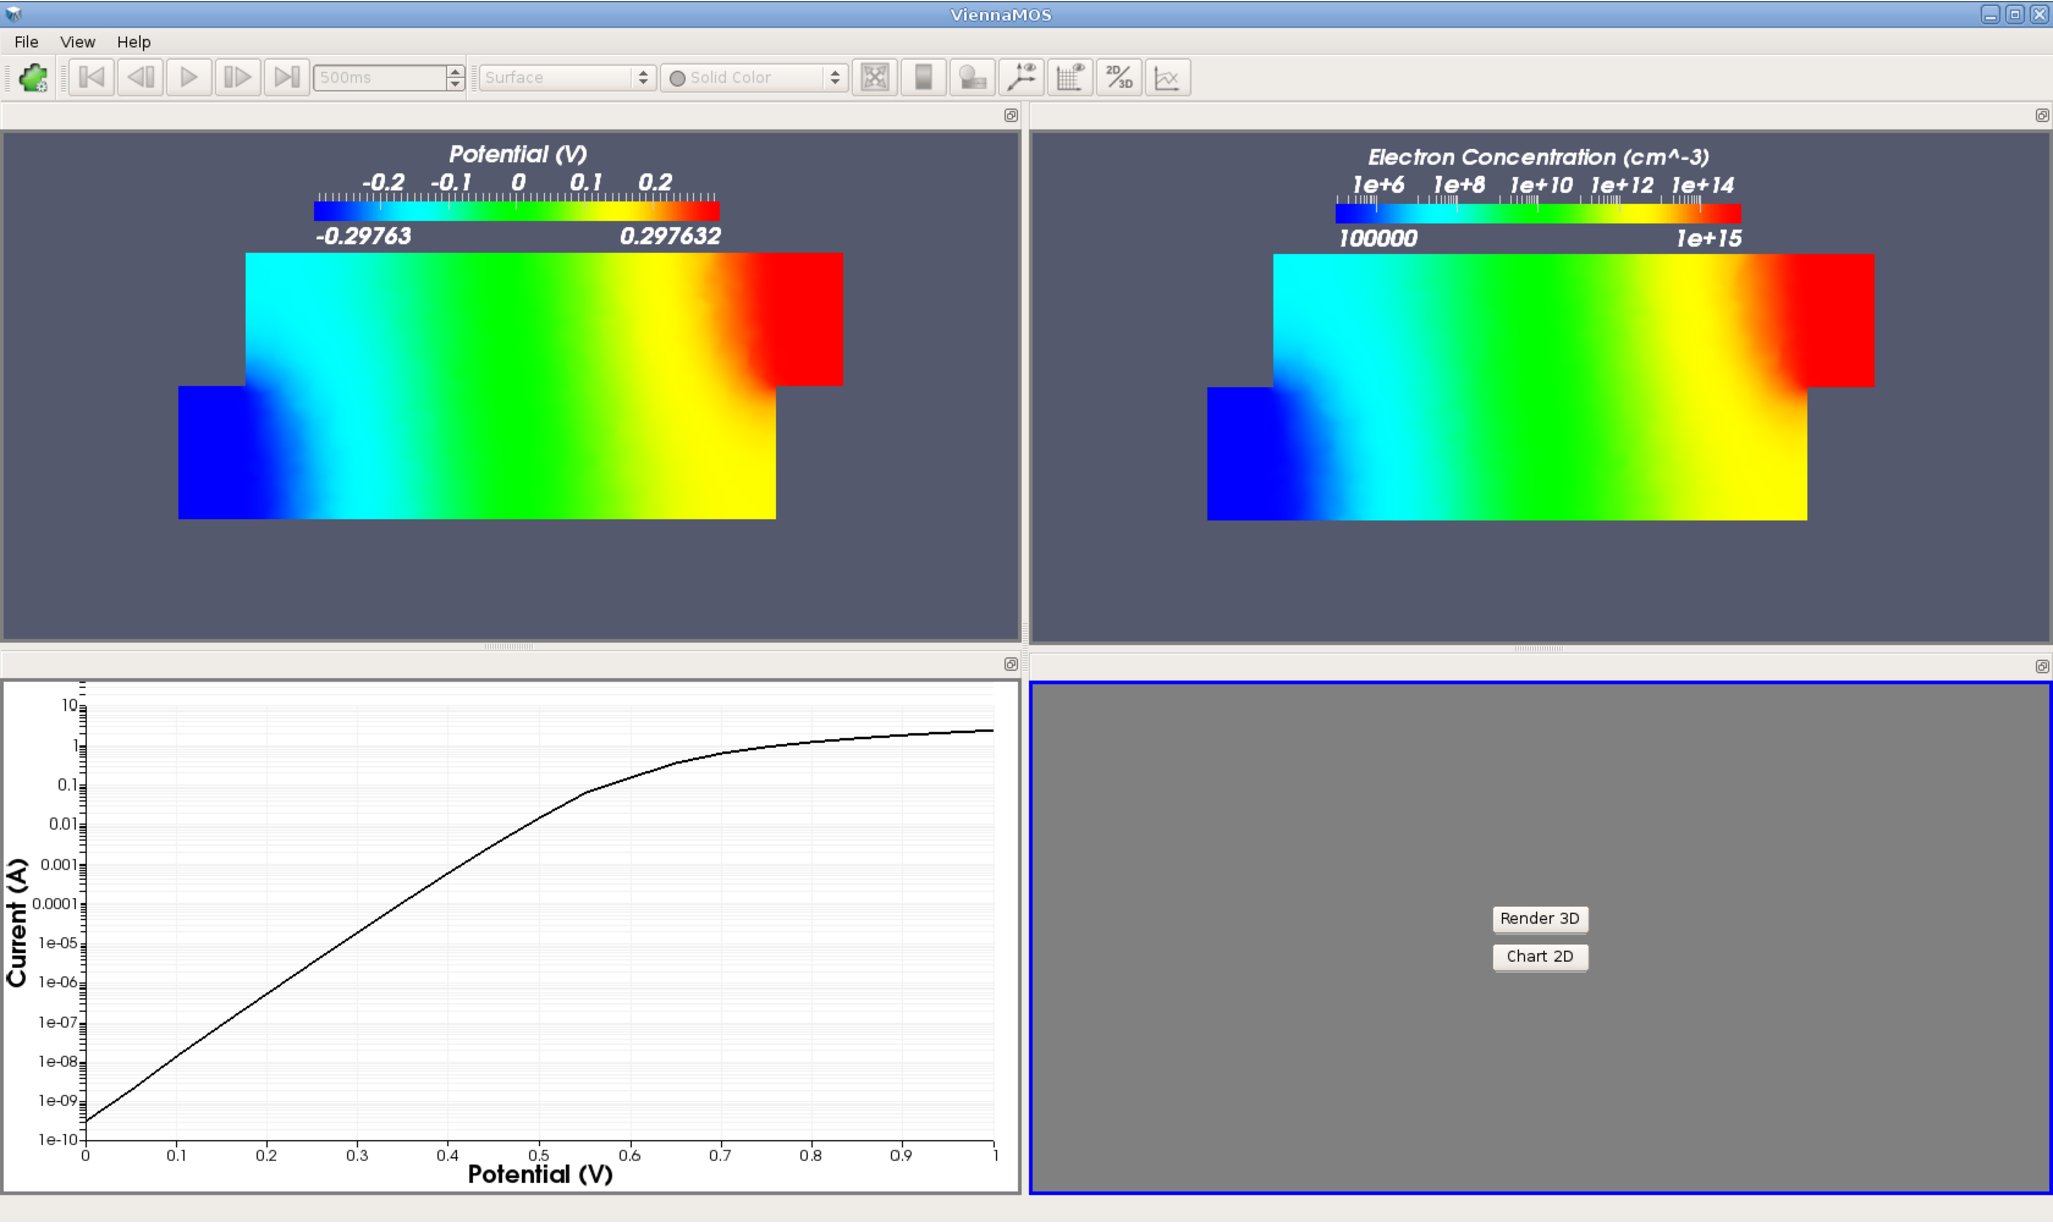
preloaded with a polymorph view entity. This particular view provides the end user
with button widgets enabling to transform the view either into a three-dimensional
render view or into a two-dimensional chart view (Figure 6.12). As a convenient
side-effect, a QDockWidget - as the name suggests - can be detached from its parent
widget, effectively allowing to natively provide the required support for multi-monitor
setups.
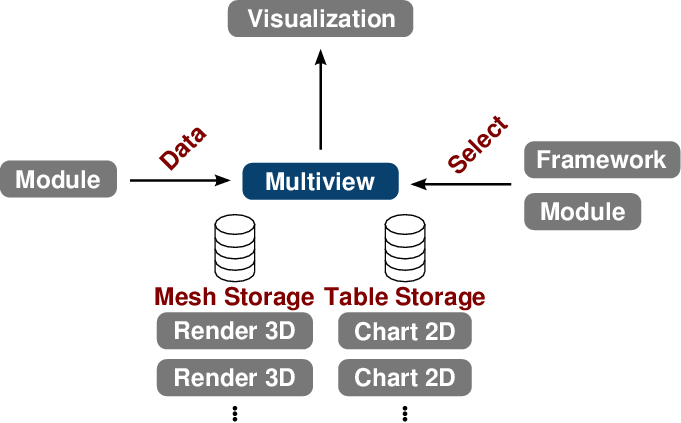
The multiview facility centrally stores the data received by the individual modules, such as
meshes and associated quantities (in Figure 6.5 referred to as mesh storage) as well as data
tables (in Figure 6.10 referred to as table storage). When a new view - render or
chart - is created, the data objects are copied to the new view states. Although
this introduces memory and copy transfer overhead, it ensures that no crosstalk
between the individual views occurs. Concerning crosstalk, quantity visualization
of the VTK meshes is based on activating a single specific data array previously
stored on the mesh. Consequently, if several views operate on the same centrally
stored mesh, each attempting to visualize different quantities on top of the mesh, the
views turn each other’s selections on and off, thus introducing the aforementioned
crosstalk.