


The parameters of the dual Pearson IV distribution in SUPREM-III were adjusted to minimize the sum of squares objective between Secondary Ions Mass Spectrometry (SIMS) measured as-implanted profiles of Boron at an energy of 10 keV:

Where n is the number of discrete measured points,  is the SIMS
concentration, and
is the SIMS
concentration, and  is the simulated concentration at those
points. In general, the SUPREM-III grid does not match the measurement grid.
A spline logarithmic interpolation was used to get the simulated profile
values at the same depth as the measured concentrations.
In Fig. 5.8 the excellent
fit between the SIMS data and the corresponding dual Pearson distribution
is shown. The single Pearson fit to the channeled and amorphized regions are
also shown to illustrate how the two functions are combined.
is the simulated concentration at those
points. In general, the SUPREM-III grid does not match the measurement grid.
A spline logarithmic interpolation was used to get the simulated profile
values at the same depth as the measured concentrations.
In Fig. 5.8 the excellent
fit between the SIMS data and the corresponding dual Pearson distribution
is shown. The single Pearson fit to the channeled and amorphized regions are
also shown to illustrate how the two functions are combined.
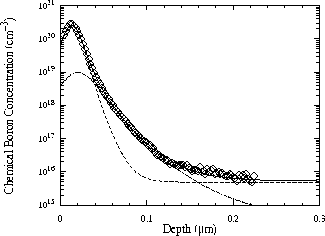
Figure 5.8: Comparison of  SIMS data (symbols) with single Pearson
for amorphized region (dashed line) and channeled region (dotted line)
and dual Pearson model (solid line).
SIMS data (symbols) with single Pearson
for amorphized region (dashed line) and channeled region (dotted line)
and dual Pearson model (solid line).