|
|
|
|
Previous: 5.1.2 Calibration of Models Up: 5. Optimization for TCAD Next: Job Farming Facility |
|
|
|
|
Previous: 5.1.2 Calibration of Models Up: 5. Optimization for TCAD Next: Job Farming Facility |
The optimization framework serves as a connection between optimization task, optimizer, and the available hardware resources and provides the functionality to drive an optimization task. It supplies the user with a graphical or textual interface to control several optimization related aspects like:
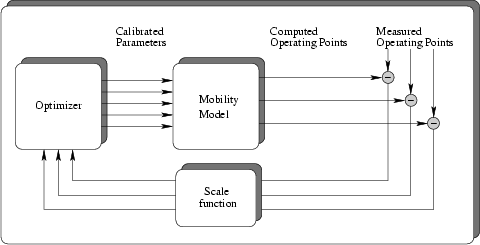
The framework SIESTA [87,88,89,90,91] developed at the Institute for Microelectronics is an integrated solution that aims at all these tasks. The optimization task is controlled via a textual description of the problem. SIESTA uses the notion of a model to partition an optimization problem into smaller parts. Fig. 5.3
A model itself can be comprised of several sub-models. Models have
well defined input- and output ports that serve as connection to other
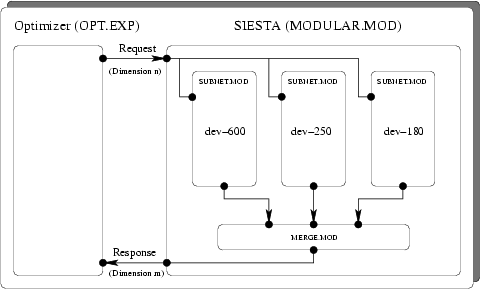
models. Fig. 5.4 depicts an optimization with ![]() sub-models.
sub-models.
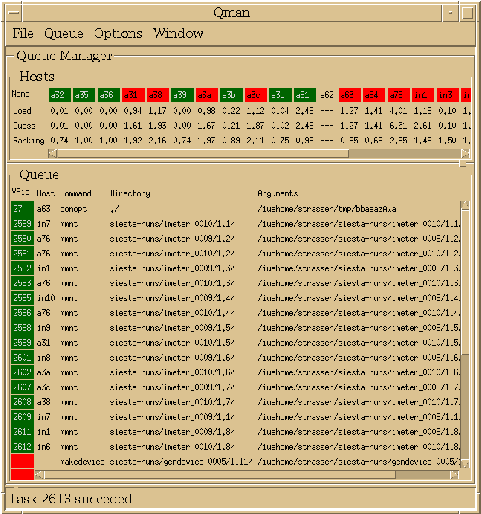
The main parts of SIESTA are implemented in LISP, the graphical user interface (GUI) is written in the language C and based on the MOTIF widget set. Fig. 5.5 depicts a screen shot of a running optimization in the SIESTA framework.
|
|
|
|
Previous: 5.1.2 Calibration of Models Up: 5. Optimization for TCAD Next: Job Farming Facility |