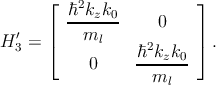
4.7 Primed Subbands and f-Processes

4.7.1 Primed k p Hamiltonian

A shear strain component in the [110] direction does not affect the primed valleys along [100] and [010] directions. If a quantization along OX-axis is assumed, the following Hamiltonian governing the primed subbands can be written as [72146],

     [    ′   ′ ]
H ′ =   H1  H 3   ,
        H3′ H ′2
(4.48)

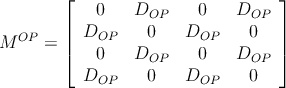
where the individual components are represented as,

         [ 2  2    2  2    2           2           ]
H ′   =   ℏ-kz-+  ℏ-(kx +-ky)+  (- 1)jℏ-kxky-+  ˜U(z)  I,
  j=1,2    2ml        2mt               M
(4.49)

and

      ⌊   2              ⌋
         ℏ-kzk0-    0
H ′ = |    ml            | .
  3   ⌈           ℏ2kzk0-⌉
            0      m
                     l
(4.50)

4.7.2 Optical Phonon Limited Spin Relaxation Rate

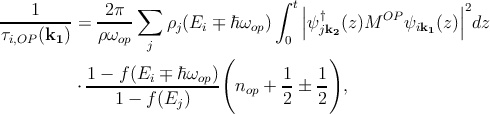
The intervalley f-processes are responsible for spin relaxation in bulk silicon which involves the primed subbands [53]. The spin relaxation rate is calculated by [69]

                   2 ∑   ∫ 2π    ∫ ∞
----1-----=  -4π3d-0-         dφ-     -dqz--⋅|-|k2-|-|
τi,(fp)(k1 )   ℏρa2ωop  j   0   2π  -∞  (2π)2  ||∂E(k2)||
                 |     |                       ∂k2
           [     |∂E(k2)|f (E (k ))] (            )
                 ||-∂k2-||------2---        1-   1-
          ⋅  1 - |∂E(k1)|            nop + 2 ±  2
                 | ∂k1 |f (E (k1))
           ∑   |      ∑         ∫ t                               |2
          ⋅    ||ϱoαp1(q)    D α1α2    dzΨ *jk2-σ(z)exp (- iqzz)Ψik1σ(z)||
            α1                   0
                         (0)
          ⋅ θ (Ej (k2) - Ej ±  ℏωop),
(4.51)

where d0 is the optical deformation potential, a is the silicon lattice constant, ωop denotes the frequency of the optical phonons, and nop describes the Bose occupation factor

nop = ----(--1--)----.
      exp   ℏωop  - 1
            KBT
(4.52)

The +(-) sign refers to phonon emission (absorption). The relaxation rate for the transition between primed and unprimed subbands is given by [69]

                  ∑                ∫ t|                   |2
----1---- =  -2π--   ρj(Ei ∓ ℏωop)    ||ψ†jk (z)M OP ψik1(z)||dz
τi,OP (k1)    ρωop  j                0     2
                            (             )
           1---f-(Ei-∓--ℏωop)        1-  1-
          ⋅    1 - f(E )      nop + 2 ± 2  ,
                       j
(4.53)

where ρj(E) is the density of states for subband j, and MOP is given by

        ⌊   0    D       0   D     ⌋
        |         OP           OP  |
M OP =  | DOP     0    DOP     0   |
        ⌈   0    DOP     0   DOP   ⌉
          DOP     0    DOP     0
(4.54)

with DOP =6.5meV2π
 a [53].

4.7.3 Optical Phonons in Spin Lifetime


PIC

Figure 4.28: The variation of the spin lifetime and its surface roughness (SR), the longitudinal (LA) and the transversal (TA) acoustic phonon mediated components with εxy is shown. ΔΓ=5.5eV (c.f. Equation 4.45), the sample thickness t=1.36nm, T=300K, and the electron concentration NS=1012cm-2 are used.


PIC

Figure 4.29: The variation of the spin lifetime and its components (along with the optical phonon Op mediated component) with εxy is shown when t=2.72nm and the other parameters are as given in Figure 4.28.


PIC

Figure 4.30: The variation of the spin lifetime and its components with εxy is shown when t=4.34nm and the other parameters are as given in Figure 4.28.


PIC

Figure 4.31: The dependence of the minimum energies for primed and unprimed subbands as well as the Fermi energy on strain is shown for Figure 4.30.


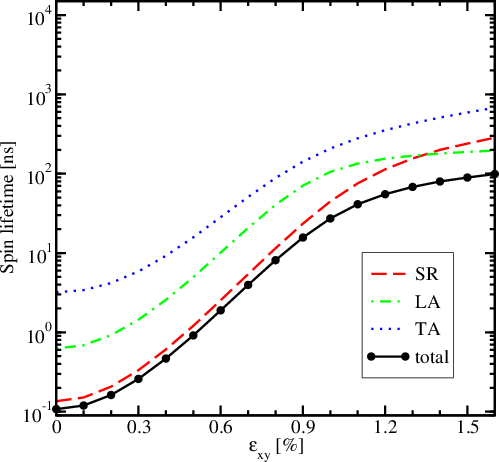
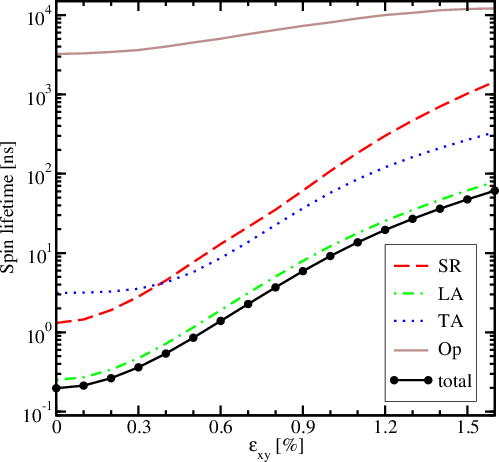
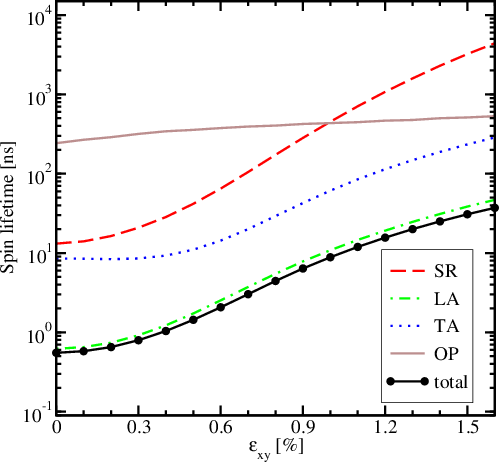
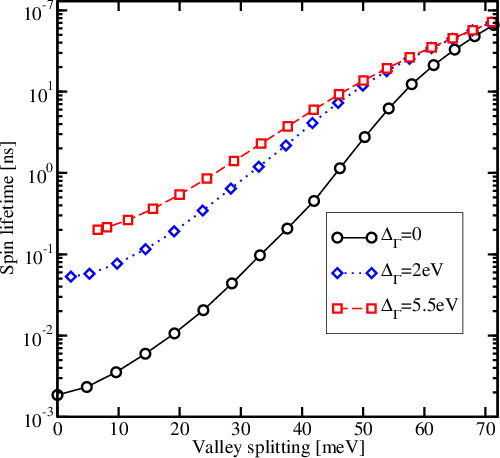
Figure 4.28 describes the total spin lifetime τs and its components for a film thickness of t=1.36nm. It is observed that the surface roughness SR induced component plays the major role in determining τs for such a thin film, although the longitudinal acoustic LA phonon mediated part becomes non-negligible when εxy>1.3%. The transversal acoustic TA phonon mediated component remains non-significant throughout a wide stress range. One has to mention that for such a low thickness, the lowest unprimed subbands are solely responsible for determining τs due to their low quantization energy [149].

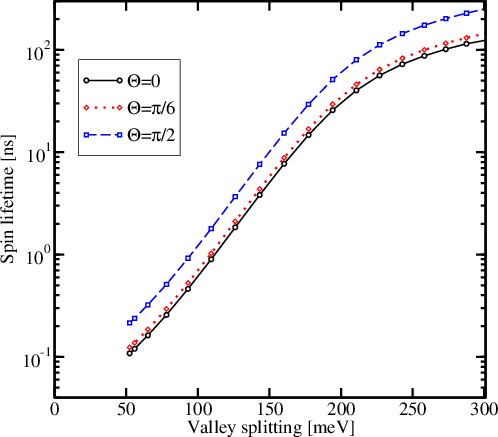
Figure 4.29 describes the variation of the total spin lifetime τs and its components on εxy for a thickness of t=2.72nm. The longitudinal acoustic LA phonon induced part of the spin lifetime turns out to be prominent over a wide range of stress at the increased film thickness. For this case the spin-flip rate due to the surface roughness SR is not as pronounced as before whereas the transversal acoustic TA phonon mediated component has no significant effect as found earlier. For the sake of completeness the optical phonon Op induced part is shown as well, even though it does not impact τs. The Op phonon mediated spin flip, which occurs between non-equivalent valleys, does not show high orders of magnitude enhancement with εxy [172]. Due to the rather high energies of the primed subbands in relation to the unprimed subbands, the Op phonon transitions are rare, which is reflected in their non-significant contribution in τs. However, their influence gradually becomes prominent when sample thickness is increased (i.e. Figure 4.30), especially at higher strain. This behavior is explained in Figure 4.31 where the dependence of minimum energies for primed and unprimed subbands on strain with the parameters as in Figure 4.30 together with the Fermi energy is described. The minimum energy of the primed subband is located at the point kz=k0, and ky=0, and the unprimed subband is at kx=0, and ky=0 [172]. Energy 1 and Energy 2 stand for the lowest subbands of the two opposite valleys along [001] direction. Energy 3 and Energy 4 stand for the second unprimed subbands. The increasing importance of the f-process comes from the fact that the distance between the Fermi energy and the lowest energy in the primed subband decreases with increasing thickness. Moreover at the film thickness of t=4.34nm, the LA phonon induced part still remains pivotal in determining the total spin lifetime τs.


PIC

Figure 4.32: The prediction of the spin lifetime with the valley splitting results (c.f. Figure 4.26) is highlighted.


PIC

Figure 4.33: The variation of the spin lifetime with the valley splitting is described, when ΔΓ=5.5eV. The sample thickness is t=1.36nm, T=300K, and the electron concentration is NS=1012cm-2. The spin injection orientation is used as a parameter.


Thus, one can conclude in the following way.

  • The total spin lifetime is highly sensitive to the film thickness.
  • The surface roughness mediated component completely loses its significance for a film thickness of more than 3nm.
  • The longitudinal acoustic phonon induced part is the dominant mechanism for a film thickness of more than 2nm.
  • The effect of a several orders of magnitude increase of the spin lifetime in strained films is mitigated for thicker films (thickness larger than 7nm).
Spin Lifetime with Valley Splitting

In Figure 4.32 the enhancement of the total spin lifetime τs considering the total valley splitting (c.f. Figure 4.26) is calculated for a film thickness of t=2.72nm. One observes the strong dependence of τs on the ΔΓ, particularly at the lower range of the valley splitting. This behavior can be correlated with the suppression of the spin hot spots with increasing ΔΓ as explained earlier (c.f. Figure 4.23). However, for all cases the spin lifetime is boosted by several orders of magnitude.

Effect of Spin Injection Orientation

The spin relaxation time τs increases when the spin injection orientation is drawn towards in-plane, if one incorporates the ΔΓ value into the calculations. The enhancement of τs including the valley splitting for different spin injection angles Θ is shown in Figure 4.33. Consistent with the analysis from the section 4.4.3, one observes that τs is increased by a factor of two once injected in-plane compared to the perpendicular-plane, even though one includes the ΔΓ term. Therefore, one can conclude that the result Equation 4.38 is more general as it is applied in both bulk silicon and thin silicon films.