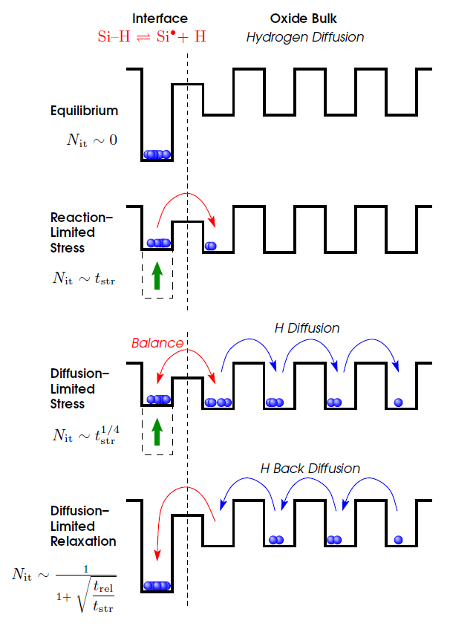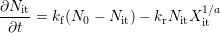
As the fabrication of a semiconductor device today as back then consists of more and more single layer depositions, often being followed by an annealing step, hydrogen as “the” passivation agent was suggested to play a key role in the first modeling attempt dating back to 1977 [13]. In the so-called reaction-diffusion model Jeppson et al. assumed the breaking of hydrogen-bonds at the interface via a thermally and field-activated process under stress. This reaction-limited stress phase is schematically depicted in Fig. 3.1 (taken from [55]) and can be described with the kinetic rate equation at the interface after [56, 57, 58, 31] as
|
| (3.1) |
where  denotes the total amount of interface states,
  the fraction of
dangling bonds thereof (not yet passivated), and
the fraction of
dangling bonds thereof (not yet passivated), and  the interfacial hydrogen
concentration. The rates
the interfacial hydrogen
concentration. The rates  and
and  describe the forward (depassivation) and
reverse (passivation) process with a kinetic exponent
describe the forward (depassivation) and
reverse (passivation) process with a kinetic exponent  considering the “size” of
the diffusing species.
considering the “size” of
the diffusing species.