 -Characteristics-Characteristics
Based on the large discrepancy between the initial reference and the very first
measurement point visible in Fig. 5.1 and Fig. 5.2, different ways to
extract a reference of  are compared in Fig. 5.3 and Fig. 5.4. A
DC-characteristic and a slow
are compared in Fig. 5.3 and Fig. 5.4. A
DC-characteristic and a slow  -pulse sweep are both compared to the fast
 -pulse sweep which is used for the fast pulsed
  -characteristics, cf.
Fig. 5.7.
-characteristics, cf.
Fig. 5.7.
 -characteristics
obtained by two gate pulses with
-characteristics
obtained by two gate pulses with  and
and  . Due to the
limited resolution, especially the subthreshold region of the
. Due to the
limited resolution, especially the subthreshold region of the  is
affected by quantization noise.
is
affected by quantization noise.
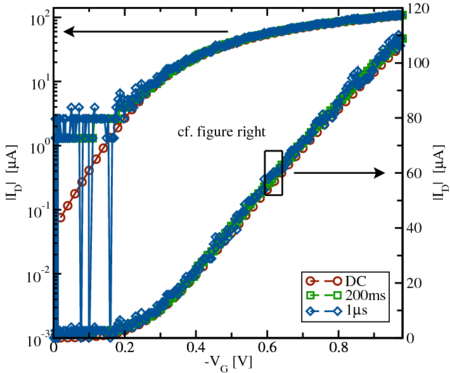
While the DC-curve is averaged and hence very smooth, the slow and fast
pulses lack accuracy due to the missing averaging, as can be seen best in the
subthreshold regime, which is very noisy. As depicted in Fig. 5.4, setting the
threshold current criteria to  (linear drain current regime), yields
extracted values of
(linear drain current regime), yields
extracted values of  differing in around
  . This error is indicated as
 in Fig. 5.4.

 . They differ by
  from each other, as marked by
 which is on the order of the obtained degradation for
  of PBTI
stress, cf. Fig. 5.6.
of PBTI
stress, cf. Fig. 5.6.
The impact of the various transfer characteristics used to get an initial
undegraded reference  to eventually measure
  during stress
is depicted for NBTI and PBTI stress in Fig. 5.5 and Fig. 5.6. Here
the fast pulsed
during stress
is depicted for NBTI and PBTI stress in Fig. 5.5 and Fig. 5.6. Here
the fast pulsed  -characterization using triangular
  - and
- and
 -pulses with zero pulse high-time after Li et al. (cf. Chapter 2.2.1)
was applied to pMOS-devices with an
-pulses with zero pulse high-time after Li et al. (cf. Chapter 2.2.1)
was applied to pMOS-devices with an 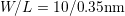 provided by
IMEC1 .
provided by
IMEC1 .
 -measurements (FPM) performed on
pMOS devices provided by IMEC after the method of Liu et al. Before
FPM is applied using different pulse widths for NBTI/PBTI stress,
-measurements (FPM) performed on
pMOS devices provided by IMEC after the method of Liu et al. Before
FPM is applied using different pulse widths for NBTI/PBTI stress,  is
determined in three different ways, cf. Fig. 5.3 and Fig. 5.4. Both stress and
recovery are interrupted
is
determined in three different ways, cf. Fig. 5.3 and Fig. 5.4. Both stress and
recovery are interrupted  times within three decades ranging from
  to
to  for an FPM. Unfortunately, a high level of uncertainty is obtained
by extracting the threshold voltage manually. Applying NBTI stress yields
sound results because of the higher signal-to-noise ratio and the expected
negative shift of
for an FPM. Unfortunately, a high level of uncertainty is obtained
by extracting the threshold voltage manually. Applying NBTI stress yields
sound results because of the higher signal-to-noise ratio and the expected
negative shift of  .
.
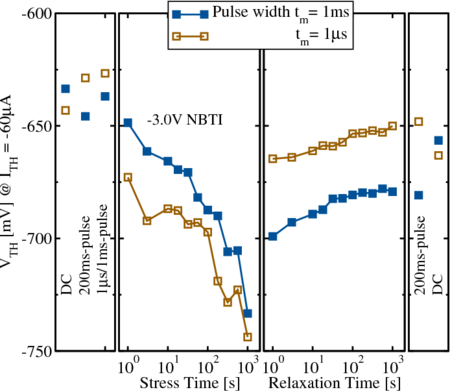
For PBTI stress Fig. 5.6 the determination of  delivers values which
are of the same order of magnitude as the following degradation itself, cf. first
and second subfigure. Depending on the chosen
delivers values which
are of the same order of magnitude as the following degradation itself, cf. first
and second subfigure. Depending on the chosen  -reference the
determined degradation hence varies by a factor of two. The same holds for the
relaxation mode (third subfigure) and its
-reference the
determined degradation hence varies by a factor of two. The same holds for the
relaxation mode (third subfigure) and its  -references taken at
  ,
the DC-characteristics and slow
,
the DC-characteristics and slow  -pulse (forth subfigure). Even
more important is the fact that in contradiction to [24], the PBTI results
do not exhibit a positive
-pulse (forth subfigure). Even
more important is the fact that in contradiction to [24], the PBTI results
do not exhibit a positive  -shift at all, they solely show negative
 -shifts.
 -measurements (FPM) performed on
pMOS devices provided by IMEC after the method of Liu et al. Before
FPM is applied using different pulse widths for NBTI/PBTI stress,
-measurements (FPM) performed on
pMOS devices provided by IMEC after the method of Liu et al. Before
FPM is applied using different pulse widths for NBTI/PBTI stress,  is
determined in three different ways, cf. Fig. 5.3 and Fig. 5.4. Both stress and
recovery are interrupted
is
determined in three different ways, cf. Fig. 5.3 and Fig. 5.4. Both stress and
recovery are interrupted  times within three decades ranging from
  to
to  for an FPM. Unfortunately, a high level of uncertainty is obtained
by extracting the threshold voltage manually. When performing PBTI stress
again a negative shift of
for an FPM. Unfortunately, a high level of uncertainty is obtained
by extracting the threshold voltage manually. When performing PBTI stress
again a negative shift of  is found. This qualitatively supports the
results of Grasser et al. presented in [30]. The suddenly appearing offset of
is found. This qualitatively supports the
results of Grasser et al. presented in [30]. The suddenly appearing offset of
 in-between the last two readout points during stress was assumed
to be due to heavy oxide damage.
in-between the last two readout points during stress was assumed
to be due to heavy oxide damage.
When the overall degradation becomes larger, as it is the case during NBTI
stress (Fig. 5.5), the error induced by the reference decreases as expected.
Unfortunately, the reason of the poor agreement of the differently extracted
initial and post  -values remains unclear. As these references do not
indicate any systematic error, but seem to vary randomly, a different
approach which is able to explain the deviating measurement results is
needed.
-values remains unclear. As these references do not
indicate any systematic error, but seem to vary randomly, a different
approach which is able to explain the deviating measurement results is
needed.