 . Therefore
the measurement data is first fit in the linear regime. Afterwards the
extracted parameters
. Therefore
the measurement data is first fit in the linear regime. Afterwards the
extracted parameters  and
and  are reinserted into (2.7) and reformulated
as
are reinserted into (2.7) and reformulated
as
By focusing on the fast pulses only, the measurement setup is simplified. The next step is to examine the postprocessing of the measurement signal, as done in [24]. Thereby a very important fact becomes visible. The experimental output of the fast pulsed method, depicted in Fig. 5.5 and Fig. 5.6 (third and forth subfigure), was fitted by hand for each stress and relaxation time step.
To avoid the manual fitting, two methods to process all measurement data
consistently are proposed. The first fits the data by using the SPICE level 1
compact model (2.7) from [37] and returns the threshold voltage as already
introduced in Chapter 2.3. A second method combines the SPICE level 1
compact model with the constant current criterion of . Therefore
the measurement data is first fit in the linear regime. Afterwards the
extracted parameters and are reinserted into (2.7) and reformulated
as
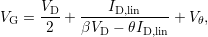 | (5.1) |
with  . These two extraction schemes will be refered to as “avg” and
“
. These two extraction schemes will be refered to as “avg” and
“ ” in the following. Before addressing their differences further,
another point needs to be discussed.
” in the following. Before addressing their differences further,
another point needs to be discussed.
The pulse polarity differs for NBTI and PBTI during the stress phase. This
becomes obvious in Fig. 5.7, where the standard FPM scheme is examined. The
pulse slope used for the  -extraction is highlighted with circles for
the three modes of operation: the initial, the stress, and the relaxation
phase.
-extraction is highlighted with circles for
the three modes of operation: the initial, the stress, and the relaxation
phase.
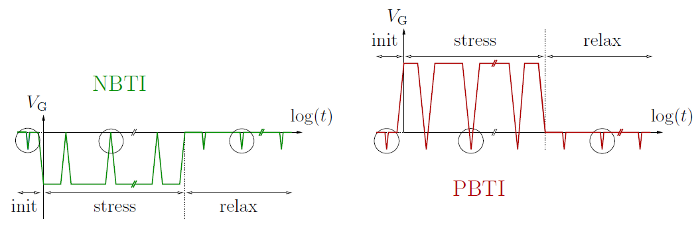
The transistor is usually driven from accumulation towards inversion and
back, i.e. a falling pulse edge is followed by a rising pulse edge. Only during
NBTI stress the polarity of this pulse is reversed. What at a first glance seems to
be irrelevant, namely which edge is chosen for the extraction, actually turns out
to be significant. The  -curves extracted from the two pulse edges
forming each pulse do not necessarily coincide as primarily assumed,
rather they show a hysteresis. This hysteresis originates from slightly
stressing or relaxing the device through the pulsed measurement itself.
Consequently the pulse hysteresis influences the extracted values of the threshold
voltage.
-curves extracted from the two pulse edges
forming each pulse do not necessarily coincide as primarily assumed,
rather they show a hysteresis. This hysteresis originates from slightly
stressing or relaxing the device through the pulsed measurement itself.
Consequently the pulse hysteresis influences the extracted values of the threshold
voltage.
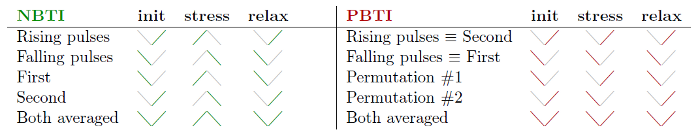
In the following all meaningful pulse edge combinations for both NBTI and
PBTI are schematically compared in Tab. 5.1. The extracted values of  are
displayed in Fig. 5.8 for a
are
displayed in Fig. 5.8 for a  -pulsed NBTI-FPM. Depending on which edges
are used, the degradation is either overestimated (rising or first pulse edge) or
underestimated (falling or second pulse edge). The first case is due to the fact
that the device obviously still relaxes while
-pulsed NBTI-FPM. Depending on which edges
are used, the degradation is either overestimated (rising or first pulse edge) or
underestimated (falling or second pulse edge). The first case is due to the fact
that the device obviously still relaxes while  is determined, while the latter
already suffers from too long delay times, i.e. the time of one pulse edge (
is determined, while the latter
already suffers from too long delay times, i.e. the time of one pulse edge ( )
is already missed.
)
is already missed.
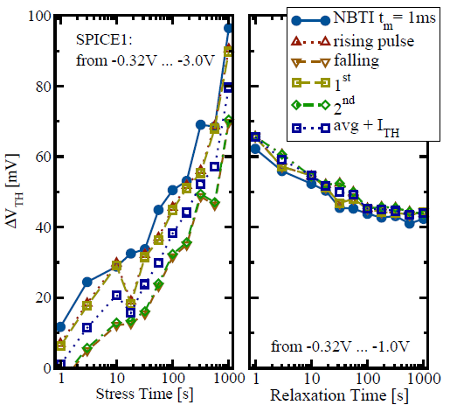
 ” extraction scheme. By using various pulse
edges of the measurement data as displayed in Tab. 5.1, more or less smooth
” extraction scheme. By using various pulse
edges of the measurement data as displayed in Tab. 5.1, more or less smooth
 -curves are obtained. The extraction which uses both pulse edges
(averaged pulse) yields the best possible results that can be obtained for
FPM. Due to the hysteresis between the rising and falling edge all other
pulse combinations give barely acceptable results.
-curves are obtained. The extraction which uses both pulse edges
(averaged pulse) yields the best possible results that can be obtained for
FPM. Due to the hysteresis between the rising and falling edge all other
pulse combinations give barely acceptable results.
During relaxation the same pulse form is used for both NBTI and PBTI. Therefore the hystersis does not affect the extracted results. As expected, smoother results are obtained by averaging the pulses.