5.6 Extrapolation of Oxide Trap Contribution
As demonstrated above, during an OFIT measurement a distortion of  due
to oxide charges and due to the creation of defects during the low-level is
monitored. In order to analyze this distortion,
due
to oxide charges and due to the creation of defects during the low-level is
monitored. In order to analyze this distortion,  is determined to be the
lowest value of
is determined to be the
lowest value of  at which no hysteresis is observed. The dataset
 is then used to extrapolate the impact of oxide charges
  down to the stress-level. It is not possible to obtain this information
from the stress pulse because of the contribution of both parts
down to the stress-level. It is not possible to obtain this information
from the stress pulse because of the contribution of both parts  and
and  . Quite remarkably, the data [78] can be fit by a quadratic
polynomial, consistent with our NBTI experiments where we also observe a
quadratic (
. Quite remarkably, the data [78] can be fit by a quadratic
polynomial, consistent with our NBTI experiments where we also observe a
quadratic ( ) dependence of the hole-trapping component [99, 18, 98].
The hole-trapping theory developed in [98] was applied to our data and
excellent agreement was obtained. The difference between the actual signal
(
) dependence of the hole-trapping component [99, 18, 98].
The hole-trapping theory developed in [98] was applied to our data and
excellent agreement was obtained. The difference between the actual signal
( ) and the extrapolated curve in Fig. 5.15 and Fig. 5.16 finally gives
 .
.
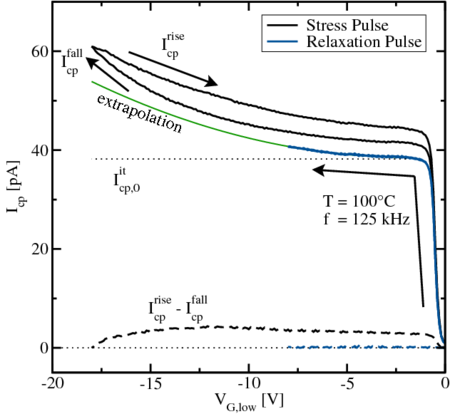
In Fig. 5.15 and Fig. 5.16 the extraction algorithm for  and
and  is
demonstrated. Stress and relaxation pulse responses both consist of two branches,
one falling and one rising, as marked by arrows. In the falling branch,
is
demonstrated. Stress and relaxation pulse responses both consist of two branches,
one falling and one rising, as marked by arrows. In the falling branch,  varies from
  to
to  . In the rising branch,
  varies from
  to
to
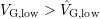
 . Only pulses with constant
  (or even without a hysteresis, i.e.
 ) can be used to create an extrapolation guess for higher
  .
This ‘safe window’ ranges from
.
This ‘safe window’ ranges from  to
to  , where both branches are
indistinguishable.
, where both branches are
indistinguishable.
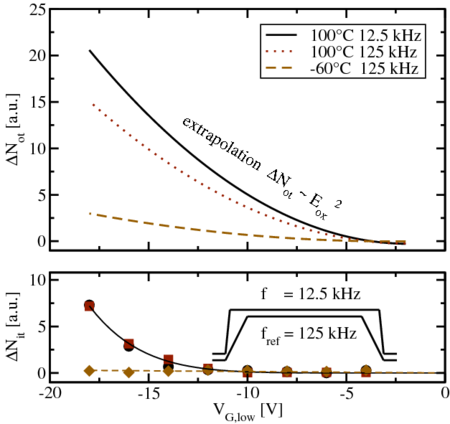
The extracted components for different temperatures and frequencies are
given in Fig. 5.17. The additionally created oxide traps  depend on
frequency as well as on temperature and clearly show
depend on
frequency as well as on temperature and clearly show  behavior.
The hysteresis due to additionally created traps
behavior.
The hysteresis due to additionally created traps  is independent of
frequency, but strongly dependent on temperature.
is independent of
frequency, but strongly dependent on temperature.
 for the stress pulse (
 =
=  ) and the relaxation pulse (
 =
=  ), shown in
Fig.
), shown in
Fig.  . In the range
 , this difference is constant, implying no additional
creation of interface states. From this ‘safe window’ we extrapolate to
the minimum low-level to estimate the contribution due to oxide charges.
Note that the first branches
, this difference is constant, implying no additional
creation of interface states. From this ‘safe window’ we extrapolate to
the minimum low-level to estimate the contribution due to oxide charges.
Note that the first branches  of the stress and relaxation pulse differ
from each other due to pre-stress pulses between
of the stress and relaxation pulse differ
from each other due to pre-stress pulses between  and
and
 . In fact, when using fresh devices for each measurement all
 would coincide.
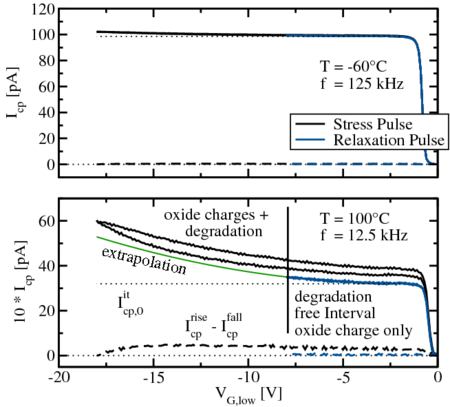
 .
. 
 follows
  , and depends on the frequency as well as on the temperature.
The hystereses displayed in the previous figures are due to additionally
created traps,
, and depends on the frequency as well as on the temperature.
The hystereses displayed in the previous figures are due to additionally
created traps,  , which are independent of the frequency but strongly
dependent on the temperature.
, which are independent of the frequency but strongly
dependent on the temperature.