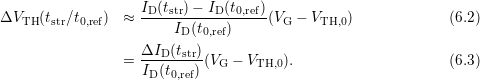
In contrast to Chapter 6.3, where the degradation of the drain current is directly fit by (6.1), the drain current is now first converted to an approximate threshold voltage shift using the simple OTF1 relation derived in Appendix A.1
Note that is obtained at stress-level with a delay
  and is thus not
equal to
and is thus not
equal to  [40], resulting in an offset of the relative degradation. Also, the
conversion (6.3) ignores any potential degradation in the mobility and is thus
affected by an as-of-yet unknown error [108, 41]. The threshold voltage is
extracted at
[40], resulting in an offset of the relative degradation. Also, the
conversion (6.3) ignores any potential degradation in the mobility and is thus
affected by an as-of-yet unknown error [108, 41]. The threshold voltage is
extracted at  , which yields
  . Then
  is fit
by
is fit
by
 | (6.4) |
In order to circumvent issues with the logarithmic fit caused by offset data due to
the uncertainty in  , the parameter
  is included. Besides, it is tried to fit
the data to a power-law of the form
is included. Besides, it is tried to fit
the data to a power-law of the form
 | (6.5) |
Again, the parameter  is introduced to account for the offset in
  .
.
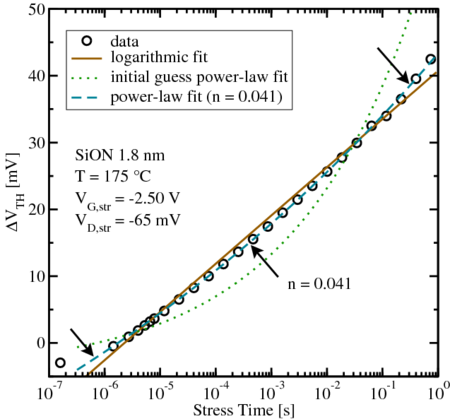
Interestingly, it turns out that the logarithmic fit (6.4) is always possible,
while the power-law fit (6.5) produces reasonable results for high temperatures
and high  only. In that high-stress regime, power-law exponents around
 are obtained. For weaker stresses, the exponent
  in (6.5) tends towards
zero, which corresponds to a first-order Taylor expansion of (6.5) on a
logarithmic scale. As such, in this regime the power-law fit (6.5) becomes
equivalent to the logarithmic fit (6.4).
in (6.5) tends towards
zero, which corresponds to a first-order Taylor expansion of (6.5) on a
logarithmic scale. As such, in this regime the power-law fit (6.5) becomes
equivalent to the logarithmic fit (6.4).
 ,
,
 ) the recorded data slightly deviates from a logarithmic
dependence and can be nicely fit using a power-law.
) the recorded data slightly deviates from a logarithmic
dependence and can be nicely fit using a power-law.
 ,
,  ) nearly perfectly follows a logarithmic
behavior and cannot be properly fitted using a power-law.
) nearly perfectly follows a logarithmic
behavior and cannot be properly fitted using a power-law.
This behavior is illustrated in Fig. 6.15 and Fig. 6.16. The data obtained
from the harshest stress conditions ( ,
,  , and
, and
 ) gives a stable fit with
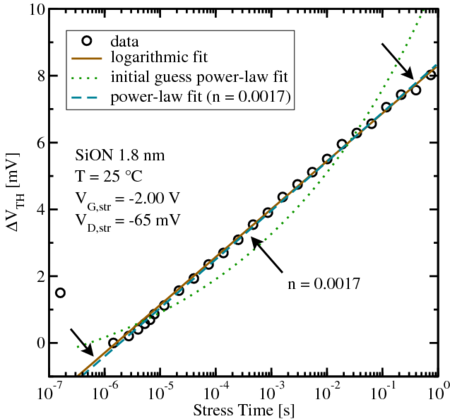
  . For the other extreme case
(
. For the other extreme case
( ,
,  , and
, and  ) the fitting algorithm gives an
exponent
) the fitting algorithm gives an
exponent  of practically zero. For the case of the non-converging exponent
  the logarithmic and power-law fits coincide.
Consequently, the power-law fit only makes sense for high temperatures
and/or high  , as displayed in Fig. 6.17. There, the extracted
  for
short-term stress is roughly one third of the often reported
for
short-term stress is roughly one third of the often reported  of the
long-term behavior.
of the
long-term behavior.
![]()
 . Bottom: Using the (arbitrary) value of
 as a threshold criterion, a high-stress region, where a deviation
from the logarithmic behavior is observed, can be clearly identified.
as a threshold criterion, a high-stress region, where a deviation
from the logarithmic behavior is observed, can be clearly identified.