 follows a
power-law as
follows a
power-law as  [7, 49, 102, 103]. However, log-like behavior, in particular at
short times, has also been reported [84, 11, 40]. Both cases are depicted in
Fig. 6.1 and Fig. 6.2.
[7, 49, 102, 103]. However, log-like behavior, in particular at
short times, has also been reported [84, 11, 40]. Both cases are depicted in
Fig. 6.1 and Fig. 6.2.
During long-term stress, most measurements indicate that follows a
power-law as [7, 49, 102, 103]. However, log-like behavior, in particular at
short times, has also been reported [84, 11, 40]. Both cases are depicted in
Fig. 6.1 and Fig. 6.2.
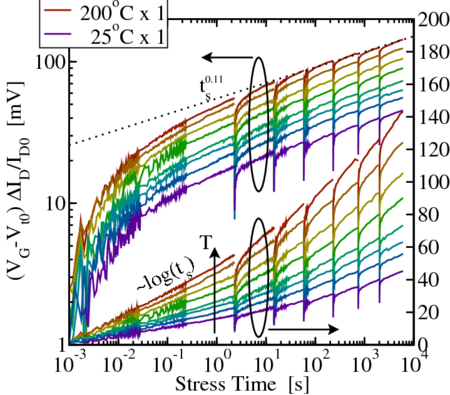

 yields a different stress
behavior when comparing the short-term to the long-term behavior and the
question arises whether there are two mechanisms contributing to NBTI
or one. Unscaled stress and restress phases of the extended MSM sequence
provided by Kaczer et al. [17, 18].
yields a different stress
behavior when comparing the short-term to the long-term behavior and the
question arises whether there are two mechanisms contributing to NBTI
or one. Unscaled stress and restress phases of the extended MSM sequence
provided by Kaczer et al. [17, 18].
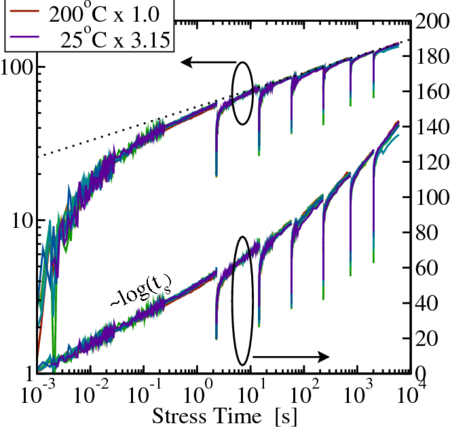

 yields a different stress
behavior when comparing the short-term to the long-term behavior and the
question arises whether there are two mechanisms contributing to NBTI or
one. Scaling the data shown left gives a universal curve which more clearly
reveals the log(t) versus the power-law dependence.
yields a different stress
behavior when comparing the short-term to the long-term behavior and the
question arises whether there are two mechanisms contributing to NBTI or
one. Scaling the data shown left gives a universal curve which more clearly
reveals the log(t) versus the power-law dependence.
The conventional explanation of the resulting degradation uses elastic hole trapping due to tunneling carrier exchange with the substrate (initial degradation) [84, 11] and the creation of interface states (long-term degradation) [94, 104]. While [94, 104] claim that processes in the short-time scale show a negligible temperature dependence, the latest results support a thermally activated tunneling mechanism [98, 78, 105] (cf. Chapter 5).
Previous short-time measurements using conventional parameter analyzers
with a time resolution in the millisecond regime indicate that at least for up to
medium stresses a logarithmic time dependence is observed during the first three
decades ( up to
up to  ) [106]. This logarithmic short-term degradation shows a
strong temperature activation and a quadratic stress field dependence (
) [106]. This logarithmic short-term degradation shows a
strong temperature activation and a quadratic stress field dependence ( )
up to medium stress (
)
up to medium stress ( ). For longer stress times and higher stress
fields (
). For longer stress times and higher stress
fields ( ), degradation starts to deviate from the logarithmic
behavior [106, 98].
), degradation starts to deviate from the logarithmic
behavior [106, 98].
To better understand the underlying mechanisms of short-term NBTI
degradation, an extensive study of the short stress time behavior far below the
range of milliseconds to seconds needs to be performed. Unfortunately, accurate
measurements in these time scales are difficult to access due to noise [107, 42]. In
particular, the noise in the  regime makes it difficult to extract information
on the smallest time-constants contributing to the degradation. The currently
used measurement methods for fast NBTI evaluation [12] are briefly summarized,
based on Chapter 2:
regime makes it difficult to extract information
on the smallest time-constants contributing to the degradation. The currently
used measurement methods for fast NBTI evaluation [12] are briefly summarized,
based on Chapter 2:
(i) The fast- method [11, 15] (Chapter 2.1.2) interrupts the stress (
 delay) to quickly record
  during recovery.
(ii) The fast- method [18, 17, 106, 30, 20] (Chapter 2.1.1) monitors the
drain current
method [18, 17, 106, 30, 20] (Chapter 2.1.1) monitors the
drain current  near
near  , which is then converted to
  [106] using an
initial
[106] using an
initial  curve. This characteristic is only recorded around
  so as not
to prestress the device.
so as not
to prestress the device.
(iii) The on-the-fly (OTF) method [36, 28, 6] records the degradation
during stress and hence does not introduce unwanted recovery, but suffers
from mobility degradation, which leads to a spurious  [108, 41]
(Chapter 2.3).
[108, 41]
(Chapter 2.3).
While OTF suffers from the problem of the initial reference measurement,
which already stresses the device, the fast- and the fast-
 methods can
record an unstressed reference value but suffer from the delay during
measurement [18, 12]. Due to its non-stop recording nature, methods (i) and (ii)
[18, 12] can continuously monitor recovery and, thus, allow an extrapolation
back to shorter measuring delays.
methods can
record an unstressed reference value but suffer from the delay during
measurement [18, 12]. Due to its non-stop recording nature, methods (i) and (ii)
[18, 12] can continuously monitor recovery and, thus, allow an extrapolation
back to shorter measuring delays.
Based on this experience fast rectangular gate pulses are used for
short-term NBTI degradation in the range of  to
to  here. Recalling that
previously published results [106] only feature a minimum time of
here. Recalling that
previously published results [106] only feature a minimum time of  means that the number of decades in time for short-term degradation is
doubled from three to six. This method is called improved fast pulse
method (Chapter 2.2.2) and will be explained thoroughly in the next
two sections and is finally compared against the fast-
means that the number of decades in time for short-term degradation is
doubled from three to six. This method is called improved fast pulse
method (Chapter 2.2.2) and will be explained thoroughly in the next
two sections and is finally compared against the fast- method of
[15].
method of
[15].
 -Method