The first three-dimensional example is an initial silicon block with
![]() m floor space which is covered with a 0.15
m floor space which is covered with a 0.15 ![]() m thick L-shaped Si
m thick L-shaped Si![]() N
N![]() -mask as shown in Fig. 7.5. The Si
-mask as shown in Fig. 7.5. The Si![]() N
N![]() -mask prevents the oxidant diffusion on the subjacent silicon layer, because here only the upper surface has contact with the oxidizing ambient.
-mask prevents the oxidant diffusion on the subjacent silicon layer, because here only the upper surface has contact with the oxidizing ambient.
The plain side walls of the body must not be deformed by simulation. Therefore the mechanical boundary conditions are set such that the four side walls are not allowed to move in their normal directions. The bottom surface is fixed and on the upper surface a free mechanical boundary condition is applied.
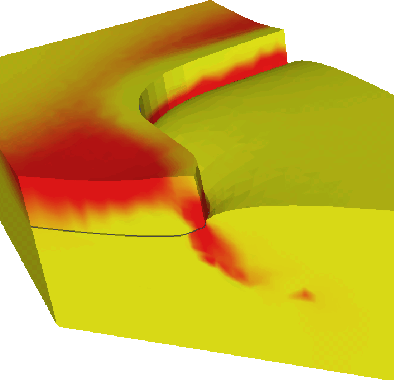
The simulation result of the oxidation process after a time t![]() , which is the
, which is the ![]() -distribution, is shown in Fig. 7.6. Here blue is pure SiO
-distribution, is shown in Fig. 7.6. Here blue is pure SiO![]() (
(![]() ), red is the pure silicon substrate (
), red is the pure silicon substrate (![]() ), and at the Si/SiO
), and at the Si/SiO![]() -interface there is the reaction layer with a spatial finite width (
-interface there is the reaction layer with a spatial finite width (![]() ) as explained in Section 3.1. Due to the L-shaped mask the effect of the three-dimensional oxidation process is pronounced, because the shape of the SiO
) as explained in Section 3.1. Due to the L-shaped mask the effect of the three-dimensional oxidation process is pronounced, because the shape of the SiO![]() -region and the deformations are not continuous in any direction.
-region and the deformations are not continuous in any direction.
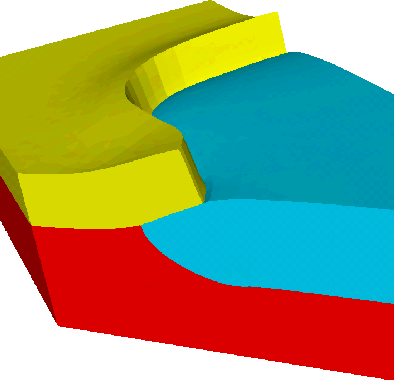
For a more physical interpretation of the simulation results with a sharp interface between silicon and SiO![]() the two regions are extracted from the
the two regions are extracted from the ![]() -distribution by determining that
-distribution by determining that
![]() is SiO
is SiO![]() and
and
![]() is silicon as shown in Fig. 7.7.
For an optimal comparison of the geometry before and after oxidation as well as the influence of stress, Figs. 7.5-7.10 have the same perspectives and the same proportions.
is silicon as shown in Fig. 7.7.
For an optimal comparison of the geometry before and after oxidation as well as the influence of stress, Figs. 7.5-7.10 have the same perspectives and the same proportions.
In order to demonstrate the importance of the stress dependence the results with and without the impact of stress are compared. Since the oxidant diffusion and the chemical reaction are exponentially reduced with the hydrostatic pressure in the material, the oxidation process itself is highly stress dependent.
Fig. 7.8 shows the pressure distribution in the materials, where the positive pressure regions are displayed in red (more red means more pressure). It can be seen that the highest pressure in SiO![]() is under the edge of the Si
is under the edge of the Si![]() N
N![]() -mask, because in this area the stiffness of the mask prevents the desired volume expansion of the newly formed SiO
-mask, because in this area the stiffness of the mask prevents the desired volume expansion of the newly formed SiO![]() . Due to the mentioned stress dependence the oxidation rate in these areas is considerably reduced (see Fig. 7.7).
The stiffness of the Si
. Due to the mentioned stress dependence the oxidation rate in these areas is considerably reduced (see Fig. 7.7).
The stiffness of the Si![]() N
N![]() -mask is approximately six times larger than the stiffness of SiO
-mask is approximately six times larger than the stiffness of SiO![]() and therefore the displacements in SiO
and therefore the displacements in SiO![]() are also much more larger than in the Si
are also much more larger than in the Si![]() N
N![]() -mask which leads to the well known bird's beak effect.
-mask which leads to the well known bird's beak effect.
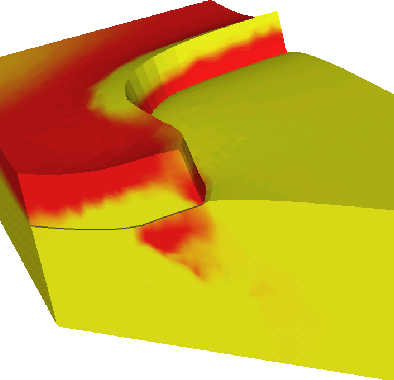
If the stress dependence is not taken into account for the simulation of the oxidation process, the simulation results do not agree with the real physical behavior, because the oxide region is too large. In this case the oxidant diffusion and the chemical reaction also occur under the Si![]() N
N![]() -mask without restriction and therefore the SiO
-mask without restriction and therefore the SiO![]() -region at the same oxidation conditions is much more expanded than with the stress dependence as demonstrated in Fig. 7.9. In addition, the larger forces under the Si
-region at the same oxidation conditions is much more expanded than with the stress dependence as demonstrated in Fig. 7.9. In addition, the larger forces under the Si![]() N
N![]() -mask, which result from the larger pressure domain in this area (see Fig. 7.10), cause larger displacements of the mask.
-mask, which result from the larger pressure domain in this area (see Fig. 7.10), cause larger displacements of the mask.
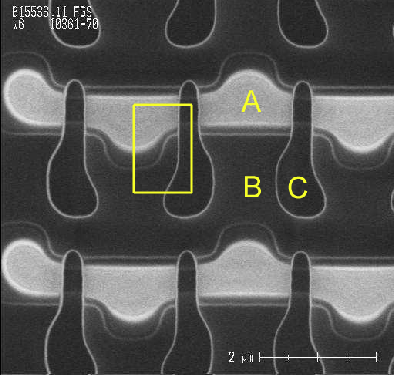
The second example is a commercially fabricated EEPROM-cell where thermal oxidation is an inherently important step in the production procedure. Fig. 7.11 is the top view of a SEM picture which shows a field of 6 EEPROM-cells a few process steps after oxidation. In this picture A is the active area of the cell which is crossed by the unshaped floating gate C. The rest of the cell area is the field oxide B made by the oxidation process. The swells of the active area are provided for the contacts. In Fig. 7.11 the active area A is surrounded by a light line. This line marks the original area of the already removed Si![]() N
N![]() -mask. Because of the bird's beak effect during the oxidation step the active area is smaller than the masked one.
-mask. Because of the bird's beak effect during the oxidation step the active area is smaller than the masked one.
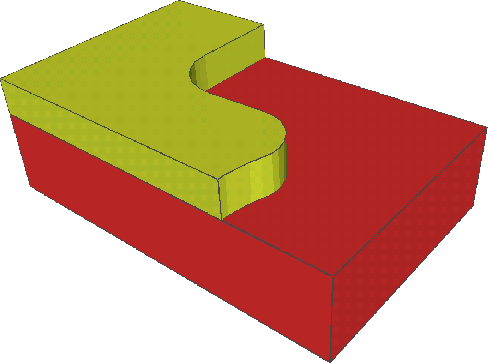
The oxidation process is only simulated on a cut of the whole field of EEPROM-cells, because the structure is repeating. The analyzed structure which is part of a cell, is marked with the rectangle in Fig. 7.11 and has (1.5![]() 1.0)
1.0)
![]() m floor space. This complex structure is displayed on Fig. 7.12 before oxidation, where the upper layer is a 0.15
m floor space. This complex structure is displayed on Fig. 7.12 before oxidation, where the upper layer is a 0.15 ![]() m thick Si
m thick Si![]() N
N![]() -mask. The area which is masked with Si
-mask. The area which is masked with Si![]() N
N![]() is not oxidized, and results in the active area A of the EEPROM-cell after removal of the mask (see Fig. 7.11).
is not oxidized, and results in the active area A of the EEPROM-cell after removal of the mask (see Fig. 7.11).
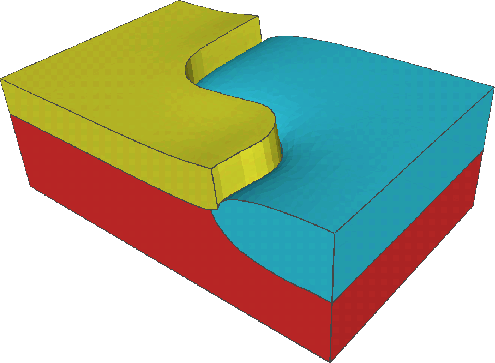
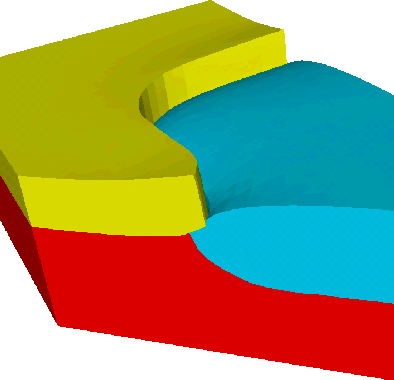
Fig. 7.13 shows the results of the simulated oxidation process on the EEPROM-structure after a time t![]() .
For an optimal illustration of the stress dependence effect in the simulation results a 45
.
For an optimal illustration of the stress dependence effect in the simulation results a 45![]() -cut in the area of the convex mask curve (see Fig. 7.12) is performed.
With this three-dimensional example it is demonstrated again that the stress dependence must be taken into account in the oxidation model (see Fig. 7.14). Otherwise the oxidation rate is not reduced in the pressure domains, which leads to wrong simulation results because of the too large oxide region and deformations (see Fig. 7.16).
-cut in the area of the convex mask curve (see Fig. 7.12) is performed.
With this three-dimensional example it is demonstrated again that the stress dependence must be taken into account in the oxidation model (see Fig. 7.14). Otherwise the oxidation rate is not reduced in the pressure domains, which leads to wrong simulation results because of the too large oxide region and deformations (see Fig. 7.16).
![\includegraphics[width=0.7\linewidth]{/iuehome/hollauer/papers/sispad2005/simulation/withPr/output2.500000e+01-starta.eps}](img900.png)
![\includegraphics[width=0.65\linewidth]{/iuehome/hollauer/papers/sispad2005/simulation/withPr/output1.875878e+03-eta1a.ps}](img901.png)
![\includegraphics[width=0.65\linewidth]{/iuehome/hollauer/papers/sispad2005/simulation/withPr/output1.875878e+03-sharp1a.ps}](img902.png)
![\includegraphics[width=0.65\linewidth]{/iuehome/hollauer/papers/sispad2005/simulation/withPr/output1.875878e+03-pres1a.ps}](img903.png)
![\includegraphics[width=0.65\linewidth]{/iuehome/hollauer/papers/sispad2005/simulation/ohnePr/output1.875878e+03-sharp1a.ps}](img904.png)
![\includegraphics[width=0.65\linewidth]{/iuehome/hollauer/papers/sispad2005/simulation/ohnePr/output1.875878e+03-pres1a.ps}](img905.png)