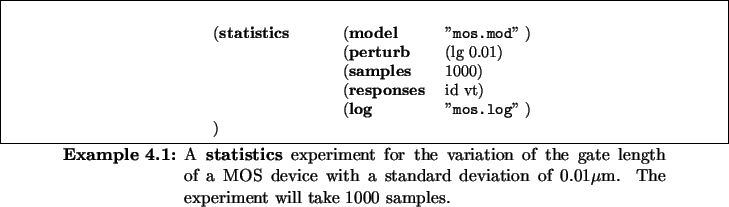
To perform a Statistical Analysis on a model the statistics experiment can be employed. For each of the model ports occurring in the perturb section, a Gaussian distribution of the setting at this port is used in the statistical analysis. Note that SIESTA does not explicitly treat physical units, thus the standard deviation (sigma) needs to be specified in the same unit which is implicitly assumed for the corresponding input port. The number of desired model evaluations is given in the samples entry. As a result, we obtain the statistical variations of the quantities at the model's output ports selected by responses which are recorded in the log file.
Example 4.1 illustrates how the statistics experiment can be utilized to explore the statistical behavior of a MOS device with respect to variations of the gate mask. This experiment will take 1000 statistical samples and monitor the drain current id of the device, and the threshold voltage vt.
![\begin{Modeldesc}
% latex2html id marker 4711
\caption{
An experiment for statis...
...e}\dq{} )\qquad ] \\
)\end{tabbing}\end{minipage}\end{flushleft}\end{Modeldesc}](img53.gif)