Next: 3. Homogeneous Transport in
Up: Dissertation Martin-Thomas Vasicek
Previous: 1. Theory of Transport
Subsections
THIS CHAPTER investigates the validity of
higher-order transport models on a series of the most popular test devices, one
dimensional
 structures. These topologies display similar features as a
MOSFET and bipolar transistors like a distinctive velocity overshoot and a
mixture of a hot and a cold distribution function in the drain
region. Therefore, it is possible to study the basic behavior of macroscopic
transport models for very small devices within
structures without the
additional levels of complexity introduced by two-dimensional MOS
devices [130,21]. In order to consider the high-field
case as accurately as possible, a transport model based on fullband MC
tables is considered. The results of the MC based higher-order transport
models are benchmarked against the SHE and MC simulations.
structures. These topologies display similar features as a
MOSFET and bipolar transistors like a distinctive velocity overshoot and a
mixture of a hot and a cold distribution function in the drain
region. Therefore, it is possible to study the basic behavior of macroscopic
transport models for very small devices within
structures without the
additional levels of complexity introduced by two-dimensional MOS
devices [130,21]. In order to consider the high-field
case as accurately as possible, a transport model based on fullband MC
tables is considered. The results of the MC based higher-order transport
models are benchmarked against the SHE and MC simulations.
For an accurate description of higher-order transport models, it is important
to model higher-order transport parameters with as few simplifying assumptions
as possible [131,21]. The fullband bulk MC
tables with respect to different doping concentrations and different driving
fields are used as a base for a parameter interpolation within macroscopic
transport models [132]. Fullband structure of the material,
scattering mechanisms such as phonon induced scattering are now inherently
considered in the MC tables, and in the following also in the transport
model. Hence, approximate methods for the transport parameter modeling e.g. the
low field mobility model after [110] are replaced by the MC
table based model. Furthermore, the transport parameters of three-dimensional
simulations can be expressed as a function of the doping concentration and the
driving force. The extracted bulk parameter-set needed for higher-order
macroscopic transport models is displayed in Fig. 2.1
and Fig. 2.2. Here the carrier mobility
 and
higher-order mobilities
and
higher-order mobilities
 and
and
 as a function of the electric
field
as a function of the electric
field
 for different doping concentrations
 are presented. As can
be observed, for fields above
are presented. As can
be observed, for fields above
 the values of the
mobilities are independent of the doping concentration, while for low fields
and low doping concentrations, the carrier mobility is very high compared to
low fields and high doping concentrations. The energy flux mobility and the
second-order energy flux mobility are lower than the carrier mobility for low
doping concentrations and low fields, while for low fields and high doping
concentrations, the value of all three mobilities are comparable.
the values of the
mobilities are independent of the doping concentration, while for low fields
and low doping concentrations, the carrier mobility is very high compared to
low fields and high doping concentrations. The energy flux mobility and the
second-order energy flux mobility are lower than the carrier mobility for low
doping concentrations and low fields, while for low fields and high doping
concentrations, the value of all three mobilities are comparable.
Figure 2.1:
Carrier mobility
, energy flux mobility
, and second-order energy
flux mobility
versus driving field for different doping
concentrations. For fields higher than
, the mobilities
are independent of the doping concentration, while for low fields the values of
the mobilities of the low doping case is high compared to high doping
concentrations.
|
|
Fig. 2.2 presents the relaxation times
 and
and
 for different doping concentrations and as a function of the
kinetic energy of the carriers. As can be seen, for high energies the
relaxation times are doping independent and decrease due to the increase of
optical phonon scattering. For high
, the MC simulations predict low
relaxation times compared to low
.
for different doping concentrations and as a function of the
kinetic energy of the carriers. As can be seen, for high energies the
relaxation times are doping independent and decrease due to the increase of
optical phonon scattering. For high
, the MC simulations predict low
relaxation times compared to low
.
Figure 2.2:
Energy-relaxation time
and second-order energy
relaxation time
extracted from bulk MC simulations as a function
of the kinetic energy for different bulk dopings. For very high energies, the
relaxation times decrease due to the increase of optical phonon scattering.
|
|
Figure 2.3:
Bulk velocity of electrons as a function of the driving field
for a doping of
 ,
,
 ,
and
,
and
 . In the low field regime, the
electron velocity for high dopings is lower than the velocity of the low dopings,
while the value of the velocity converges for high fields.
. In the low field regime, the
electron velocity for high dopings is lower than the velocity of the low dopings,
while the value of the velocity converges for high fields.
|
|
The carrier velocity as a function of the lateral field and for
different
is demonstrated in Fig. 2.3. The saturation
velocity of Si is reached at a driving field of
 .
.
A study concerning the behavior of three-dimensional macroscopic transport models
in long and short
test structures is given and compared to SHE and MC
simulations. Short channel effects as the velocity overshoot, impact
ionization, and the influence of hot electrons on the carrier distribution function are
discussed.
First, a study on the behavior of higher-order transport models in long channel
devices is performed. The aim is to find a calibration point, where all
macroscopic transport models together with the spherical harmonics approach,
which is the reference simulator here, yield the same result. Thus,
structures with a channel length from
 down
to
down
to
 and with a doping profile
of
and with a doping profile
of
 and
and
 have been
investigated.
have been
investigated.
Fig. 2.4 shows the output currents of different
structures
for channel lengths of
,
 , and
calculated with the DD, ET, SM and the SHE
model.2.1 As
can be observed for a channel length of
all models yield
the same results with an error below
, and
calculated with the DD, ET, SM and the SHE
model.2.1 As
can be observed for a channel length of
all models yield
the same results with an error below
 (see Fig. 2.5). While the error of the ET and SM model stays more
or less constant below
(see Fig. 2.5). While the error of the ET and SM model stays more
or less constant below
 for a channel length down to
, the error of the DD model continuously increases and
reaches a value of
for a channel length down to
, the error of the DD model continuously increases and
reaches a value of
 for a channel length of
. While the inaccuracy of the ET model starts to increase
below
, the SM model gives still results very close to
SHE simulations. Therefore, simulating short channel devices with the
DD model gives only poor results. However, for devices with a channel length
of
for a channel length of
. While the inaccuracy of the ET model starts to increase
below
, the SM model gives still results very close to
SHE simulations. Therefore, simulating short channel devices with the
DD model gives only poor results. However, for devices with a channel length
of
 , the DD, ET, SM, and the SHE model predict the same
current value with an error of below
. Hence, the calibration
point is the
channel device.
, the DD, ET, SM, and the SHE model predict the same
current value with an error of below
. Hence, the calibration
point is the
channel device.
Figure 2.4:
Output currents for different
structures calculated with DD,
ET, and SM models. As a reference, SHE simulations are used. For
, all models predict the same current,
while the DD model underestimates the current for a channel length of

|
|
Figure 2.5:
Relative error of the current calculated with the DD, ET, and
the SM model as a function of the channel length. A voltage
of
 has been applied. While the ET and SM model is below
 the DD model approaches to
 at a
channel length of
at a
channel length of
 .
.
|
|
2.2.2 Short Channel Effects
Since the channel length is reduced to increase the operation speed and the
number of components per chip, the so called short-channel effect
arise [133]. The first short channel effect described here
is the velocity overshoot.
The velocity overshoot in short channel devices has been the object of many
investigations [134,135,136,137,138].
The carrier velocity in most devices operating near room temperature and under
modest bias condition is always limited by scattering. Carriers cannot go
beyond a certain velocity. The maximum velocity observed in bulk silicon
measurements is the saturation velocity
 . The value of
is
. The value of
is
 [139]. However, as demonstrated
in Fig. 2.6 for short channel devices the situation is different.
[139]. However, as demonstrated
in Fig. 2.6 for short channel devices the situation is different.
Figure 2.6:
Velocity profiles of a
 ,
,
and
,
,
and
 long
structure calculated with the MC
method are presented after [4]. The velocity overshoot at
the beginning of the lowly doped n-region is clearly visible.
long
structure calculated with the MC
method are presented after [4]. The velocity overshoot at
the beginning of the lowly doped n-region is clearly visible.
|
|
As the channel length decreases, the electric field inside the device increases
as well. Thus, the carriers will be accelerated without colliding with the
lattice (
 ) for at least a few pico seconds. Therefore, the random
component of the carrier velocity induced by scattering events is small, which
leads to a maximum drift velocity in the range of
to
) for at least a few pico seconds. Therefore, the random
component of the carrier velocity induced by scattering events is small, which
leads to a maximum drift velocity in the range of
to
 [140]. This is known as the velocity
overshoot.
Hot electrons can enter the oxide, where they can be trapped, giving rise to
oxide charging and can accumulate with time and degrade the device performance
by increasing the threshold voltage and adversely affect the gate control on
the drain current [133].
[140]. This is known as the velocity
overshoot.
Hot electrons can enter the oxide, where they can be trapped, giving rise to
oxide charging and can accumulate with time and degrade the device performance
by increasing the threshold voltage and adversely affect the gate control on
the drain current [133].
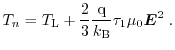
Therefore, an analytical
expression within high fields for the carrier temperature
 in a
homogeneous and stationary bulk Si system is derived. Here, all spatial
gradients in the transport models can be neglected. Hence, the energy balance
equation (1.108) can be formulated as
in a
homogeneous and stationary bulk Si system is derived. Here, all spatial
gradients in the transport models can be neglected. Hence, the energy balance
equation (1.108) can be formulated as
With
can be written as [4]
Note that only the drift term of the current
has been inserted into the homogeneous energy balance equation. As has been
pointed out,
is roughly proportional to the square of the electric
field. In a certain high field regime, where optical phonons can be neglected,
the energy relaxation time
is more or less constant
(see Fig. 2.2). Note that optical phonon scattering is an
inelastical process, which changes the energy relaxation time. In this special
high field regime,
can be written as [140]
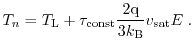
and the temperature expression (2.3) can be described in terms of the
saturation velocity
as
For electrons within the saturation velocity regime,
 is a linear function
of the electric field. In Fig. 2.7, the bulk carrier temperature as a
function of the electric field calculated with the bulk fullband MC method
is presented. In order to consider the whole band structure of Si fullband
MC has been taken into account instead of the analytical SHE
method. As pointed out, the quadratic dependence of the carrier temperature
from the electric field is a good approximation for fields lower
than
is a linear function
of the electric field. In Fig. 2.7, the bulk carrier temperature as a
function of the electric field calculated with the bulk fullband MC method
is presented. In order to consider the whole band structure of Si fullband
MC has been taken into account instead of the analytical SHE
method. As pointed out, the quadratic dependence of the carrier temperature
from the electric field is a good approximation for fields lower
than
 , while for higher fields up
to
, while for higher fields up
to
 the linear
approximation
the linear
approximation
 can be used. However, for driving
fields above
the linear approximation breaks down due to
optical phonon scattering, which changes
. Thus, the assumption that
the energy relaxation time is constant is not valid anymore.
can be used. However, for driving
fields above
the linear approximation breaks down due to
optical phonon scattering, which changes
. Thus, the assumption that
the energy relaxation time is constant is not valid anymore.
Figure 2.7:
Carrier temperature
as a function of the driving field in a
homogeneous bulk simulation carried out with fullband MC. For lower fields, the
carrier temperature is a function of
 , while
for high fields, the temperature is a linear function of the driving field.
, while
for high fields, the temperature is a linear function of the driving field.
|
|
Carrier energy has got a deep impact on the distribution function. The so
called high-energy tail at the beginning of the drain region, which is an
expression of the coexistence of a hot electron
Figure 2.8:
Evolution of the distribution function inside an
structure. The
mixture of hot and cold electrons is expressed by the high-energy tail
of the carrier distribution function.
![\includegraphics[width=0.5\textwidth]{figures/svg/nnn.eps}](img534.png)
![\includegraphics[width=0.5\textwidth]{rot_figures_left/simulation/transport/MCdata/distr_nnn/40nm/distribution_40nm.eps}](img535.png) |
population coming from the channel and the cold electron population from the drain region, is presented
in Fig. 2.8.
Here, the evolution of the distribution function through
a
structure with a channel length of
 and a doping
profile of
and a doping
profile of
 and
is
demonstrated. An electric field of
and
is
demonstrated. An electric field of
 in the middle of the
channel has been assumed. The distribution function is calculated with
the MC method. At point A a Maxwellian can be assumed as the carrier
distribution function, while at point B the heated Maxwellian overestimates
the carrier distribution function. In point D the high-energy tail occurs.
in the middle of the
channel has been assumed. The distribution function is calculated with
the MC method. At point A a Maxwellian can be assumed as the carrier
distribution function, while at point B the heated Maxwellian overestimates
the carrier distribution function. In point D the high-energy tail occurs.
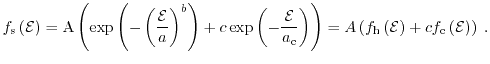
In [141], an analytical distribution function model has been
developed, which goes beyond the assumption of a Maxwellian shape. The
symmetric part of the distribution function is based on a mixture of a cold and
a hot Maxwellian and can be expressed as [141]
The five parameters
 ,
,
 ,
,
 ,
,
 , and
, and
 , which
describe the distribution function, must be determined and are calculated in
that way that the distribution reproduces the first three even moments provided
by the six moments model. Since the DD and the ET models
exhibit only two and three equations, respectively, the SM model provides
enough equations to calculate the five parameters. Of fundamental importance to
this model is the kurtosis. The kurtosis gives the information to
differentiate between the channel region and the drain
region [141].
, which
describe the distribution function, must be determined and are calculated in
that way that the distribution reproduces the first three even moments provided
by the six moments model. Since the DD and the ET models
exhibit only two and three equations, respectively, the SM model provides
enough equations to calculate the five parameters. Of fundamental importance to
this model is the kurtosis. The kurtosis gives the information to
differentiate between the channel region and the drain
region [141].
The kurtosis of an
structure with a
channel for
different source and drain dopings is visualized in Fig. 2.9. There, a
channel doping of
has been considered. As can be
observed for low dopings, the maximum peak of the kurtosis is at
 , compared to high dopings, where the maximum is at about
 .
.
This can be explained as follows: Due to the higher
concentration of cold electrons in the drain region of the high doped drain,
the relaxation of hot carriers is faster than in the low doped drain region.
Hence, the maximum peak of
 in the high doping concentration case is
 higher than for low doping concentrations.
Figure 2.9:
Kurtosis calculated for different source and drain doping
concentrations in an
structure with a channel length of
. The maximum peak of the kurtosis for high doping concentrations is very high
compared to the low doping case.
|
|
In Fig. 2.10, the second-order temperature
 defined as
and the carrier temperature
for a short and a long channel devices are
presented. For the long channel device, the hot distribution part of
equation (2.7) can be neglected due to the small deviation of
the second-order temperature
from
. In short channel devices as
the
 device, an accurate modeling of the high-energy tail is
very important as demonstrated in Fig. 2.11.
device, an accurate modeling of the high-energy tail is
very important as demonstrated in Fig. 2.11.
Here, carrier distribution functions of a
,
,
 , and
channel devices
at point D of Fig. 2.8 are shown. The distribution functions are
calculated with the MC method. As pointed out for increasing channel
lengths the high-energy tail decreases.
, and
channel devices
at point D of Fig. 2.8 are shown. The distribution functions are
calculated with the MC method. As pointed out for increasing channel
lengths the high-energy tail decreases.
Figure 2.10:
Carrier temperature
together with second-order
temperature
for a
and a
device. A field of
has been assumed. While in the long
channel device a Maxwellian can be used, the high-energy tail in the
short channel device in the drain region increases.
|
|
Figure 2.11:
Distribution function at point D of Fig. 2.8 for
 ,
,
 ,
,
 , and
channel
devices. As can be observed, the high-energy tail for increasing
channel lengths decrease.
, and
channel
devices. As can be observed, the high-energy tail for increasing
channel lengths decrease.
|
|
Figure 2.12:
Kurtosis
and the carrier temperature for electric fields of
 ,
,
 , and
through
a
channel
device (the value of the fields
in the upper left part is calculated at point A). For high fields, the kurtosis
increases at the beginning of the drain region, which
means that the high-energy tail of the distribution function is becoming very
important. In the right upper part, the carrier temperature profile for different
electric fields is shown. The kurtosis exceeds unity, while the carrier temperature
drops down. The velocity profile for fields of
and
is shown on the lower part. For low fields, all models yield the same velocity profiles, which is an
indication that the heated Maxwellian can be used. For high fields,
a significant deviation of the velocity profiles can be observed.
, and
through
a
channel
device (the value of the fields
in the upper left part is calculated at point A). For high fields, the kurtosis
increases at the beginning of the drain region, which
means that the high-energy tail of the distribution function is becoming very
important. In the right upper part, the carrier temperature profile for different
electric fields is shown. The kurtosis exceeds unity, while the carrier temperature
drops down. The velocity profile for fields of
and
is shown on the lower part. For low fields, all models yield the same velocity profiles, which is an
indication that the heated Maxwellian can be used. For high fields,
a significant deviation of the velocity profiles can be observed.
|
|
Also high fields have got a strong influence on the kurtosis as shown
in Fig. 2.12. Here, the kurtosis for
,
, and
fields of
a
channel length structure is demonstrated in the upper
left part of Fig. 2.12. The electric field has been calculated in
the middle of the channel at point A. As can be seen for low fields
as
, where the carrier temperature is low (see the upper
right part) a heated
 can be used, while for
an increase of the kurtosis at the beginning of the drain region is visible. A
significant increase of the kurtosis can be observed for high fields.
can be used, while for
an increase of the kurtosis at the beginning of the drain region is visible. A
significant increase of the kurtosis can be observed for high fields.
The kurtosis starts to rise, when the maximum of the carrier temperature
decreases to the equilibrium value.
This is the region, where the hot electrons
from the channel meet the large pool of cold electrons in the drain region. The
distribution function has also a strong impact on the carrier velocity as
pointed out in the lower part of Fig. 2.12. The ET transport model
yields the same velocity profile in the low field regime as the SM model, which
is also an indication that a Maxwellian is a good approximation within low
fields. However, for high fields, the ET overestimates the velocity profile of
the DD and the SM model, and has got a maximum at the end of the channel. A
second velocity overshoot in the ET and in the SM model can be observed, which
will be discussed in the next section.
Impact ionization especially occurs in n-channel MOSFETs, due to the high
velocity of the electrons and high lateral fields. The electrons collide with
Si atoms and generate electron hole pairs. Hence, the probability of impact
ionization for electrons in a strong field is determined by the probability
that the electrons will acquire the ionization energy of the atoms from the
field [142]. The process of increasing energies of the electrons
depends on two factors: Acceleration in the field and energy dissipation with
phonons. Thus, electrons can gain energy from the field without experiencing a
single collision, or the second possibility of receiving the same energy is
that the electrons achieve energy after many collisions, in that way that in
each collision the electron loses less energy than it receives from the field
during the time between two collisions.
Figure 2.13:
The impact ionization rate is calculated with MC, the DD, ET, and the
SM model for a
 and a
structure. Due to the better
modeling of the distribution function in the SM model, the results are closer to the MC data
than the DD and the ET model (after [5]).
and a
structure. Due to the better
modeling of the distribution function in the SM model, the results are closer to the MC data
than the DD and the ET model (after [5]).
|
|
Fig. 2.13 shows impact ionization rates of a
 and a
and a
 channel device calculated with the DD, ET, SM model and the
MC method. As can be observed, the impact ionization rate predicted by the SM
model is closer to MC data than the ET and the DD model due to the better
modeling of the distribution function in the SM model, as explained in the
following section.
channel device calculated with the DD, ET, SM model and the
MC method. As can be observed, the impact ionization rate predicted by the SM
model is closer to MC data than the ET and the DD model due to the better
modeling of the distribution function in the SM model, as explained in the
following section.
Higher-order transport models such as the SM model can cover
non-local effects due to the improved modeling
of the distribution function. This is very important for deca-nanometer
devices, where short channel effects have a strong influence on carrier
transport properties.
The channel length range of deca-nanometer devices is defined in this work
from
down to
 .
However, beside the advantages of higher-order transport models concerning the
description of the explained effects, the models also predict a velocity
overshoot, when the electric field decreases rapidly. This is the case for instance at the end of
the channel of a MOSFET. Since the velocity overshoot at the end of the
channel is not observed by MC simulations, the effect is known as
the spurious velocity overshoot (SVO) [143,144,145]. In [6]
it was demonstrated that the reason for the SVO is due to the closure relation and to the
modeling of the transport parameters. For higher-order transport models, the
error in the SVO decreases. This is shown in Fig. 2.14.
.
However, beside the advantages of higher-order transport models concerning the
description of the explained effects, the models also predict a velocity
overshoot, when the electric field decreases rapidly. This is the case for instance at the end of
the channel of a MOSFET. Since the velocity overshoot at the end of the
channel is not observed by MC simulations, the effect is known as
the spurious velocity overshoot (SVO) [143,144,145]. In [6]
it was demonstrated that the reason for the SVO is due to the closure relation and to the
modeling of the transport parameters. For higher-order transport models, the
error in the SVO decreases. This is shown in Fig. 2.14.
Here, the evolution of the velocity profile within several
structures
calculated with the DD, ET, SM, and the SHE as a reference, is
presented. An electric field of
in the middle of the
channel of each device has been assumed.
For long channel devices, all models yield more or
less the same velocity profile, while for decreasing channel lengths, the SVO in the
ET model and the reduced one in the six moments model are clearly visible.
The velocity of the ET model increases very fast for decreasing channel lengths and
is four times as high as the results obtained
from SHE simulations at
 . On the other hand, the DD model does not predict any velocity overshoot and stays always under the saturation velocity
of the bulk.
The SM model predicts a velocity profile closer to the SHE data than
the DD and the ET model, due to the advanced description of the high-energy part of the
distribution function, following that the closure relation of the SM model is
improved compared to the ET model. One of
the consequences is that the SVO is reduced in the SM model.
Therefore, with a better description of the closure relation and the transport parameters, the SVO would
disappear as demonstrated in Fig. 2.15.
Here, the velocity profile of the ET model is presented,
considering closure relations and relaxation times based on MC simulations.
As can be observed, the SVO in the ET model disappears, which justifies the above mentioned assumption.
The better modeling of device characteristics within higher-order moments is also reflected
in the currents, which is pointed out in Fig. 2.16. Here, the output characteristics of
a
and
channel length
structure
calculated with the DD, ET, SM, and the reference SHE model are shown. While the relative error of the current calculated
with the SM and the ET model stays more or less constant in long channel
devices (see Fig. 2.5), there is a significant deviation of this
pattern in the error in short channel devices.
. On the other hand, the DD model does not predict any velocity overshoot and stays always under the saturation velocity
of the bulk.
The SM model predicts a velocity profile closer to the SHE data than
the DD and the ET model, due to the advanced description of the high-energy part of the
distribution function, following that the closure relation of the SM model is
improved compared to the ET model. One of
the consequences is that the SVO is reduced in the SM model.
Therefore, with a better description of the closure relation and the transport parameters, the SVO would
disappear as demonstrated in Fig. 2.15.
Here, the velocity profile of the ET model is presented,
considering closure relations and relaxation times based on MC simulations.
As can be observed, the SVO in the ET model disappears, which justifies the above mentioned assumption.
The better modeling of device characteristics within higher-order moments is also reflected
in the currents, which is pointed out in Fig. 2.16. Here, the output characteristics of
a
and
channel length
structure
calculated with the DD, ET, SM, and the reference SHE model are shown. While the relative error of the current calculated
with the SM and the ET model stays more or less constant in long channel
devices (see Fig. 2.5), there is a significant deviation of this
pattern in the error in short channel devices.
Figure 2.14:
Evolution of the carrier velocity profiles for decreasing channel
lengths calculated with the DD, ET, and the SM model. The velocities are
compared to the results obtained from SHE simulations. While the maximum velocity of
the DD model is the saturation velocity
, the spurious velocity
overshoot at the end of the channel in the ET and the SM model is clearly
visible. The velocity overshoot at the beginning of the channel
can be quantitatively identified at the
device in the ET and the SM model.
|
|
Figure 2.15:
Velocity profile calculated with ET model and
MC data. Due to the MC closure in the ET model for the fourth
order moment and due to the improved modeling of the transport parameters,
the spurious velocity overshoot at the end of the channel disappears (after [6]).
|
|
Figure 2.16:
Output currents of a
and
a
channel length
structure calculated with the DD, ET, SM,
and SHE model. The ET model overestimates the current at
, while the SM model yields the most accurate result.
|
|
Figure 2.17:
Relative error in the current of the DD, ET, and the SM model for an
structure in the channel range
from
down to
. While the relative error
of the SM model is below
 , the error of the DD and the ET
model is at
, the error of the DD and the ET
model is at
 and
and
 for a channel length
of
, respectively.
for a channel length
of
, respectively.
|
|
In the short channel range from
to
the current calculated with the
SM model is below an error of
 , while the
errors of the DD and the ET model are at
and
for a channel length of
, respectively (see Fig. 2.17).
, while the
errors of the DD and the ET model are at
and
for a channel length of
, respectively (see Fig. 2.17).
As has been pointed out, the ET model is accurate down to a channel length of
, while a strong increase of the current error can be observed below
.
Therefore, the ET model is a suitable transport model for devices down to
channel lengths only. However, with channel length below
the SM model is
the model of choice. The strength of the six moments model is that the model gives more
informations about the distribution function than the ET model.
Footnotes
- ...
model.2.1
- Thanks to Prof. Jungemann for providing his SHE simulator
Next: 3. Homogeneous Transport in
Up: Dissertation Martin-Thomas Vasicek
Previous: 1. Theory of Transport
M. Vasicek: Advanced Macroscopic Transport Models
![\includegraphics[width=0.5\textwidth]{rot_figures_left/simulation/transport/nin/mob_bulk.eps}](img498.png)
![\includegraphics[width=0.5\textwidth]{rot_figures_left/simulation/transport/nin/mob1_bulk_si.eps}](img499.png)
![\includegraphics[width=0.5\textwidth]{rot_figures_left/simulation/transport/nin/mob2_bulk_si.eps}](img500.png)
![\includegraphics[width=0.5\textwidth]{rot_figures_left/simulation/transport/nin/tau1_bulk_si.eps}](img501.png)
![\includegraphics[width=0.5\textwidth]{rot_figures_left/simulation/transport/nin/tau2_bulk_si.eps}](img502.png)
![\includegraphics[width=0.5\textwidth]{rot_figures_left/simulation/transport/nin/velocity_bulk_si.eps}](img506.png)
![\includegraphics[width=0.5\textwidth]{rot_figures_left/simulation/transport/nin/current_long.eps}](img517.png)
![\includegraphics[width=0.5\textwidth]{rot_figures_left/simulation/transport/nin/relativ_error_longch.eps}](img518.png)
![\includegraphics[width=0.5\textwidth]{rot_figures_left/simulation/transport/nin/overshoot.eps}](img521.png)
 and
and 
![\includegraphics[width=0.5\textwidth]{rot_figures_left/simulation/transport/MCdata/bulk/temp_approx_good.eps}](img533.png)
![\includegraphics[width=0.5\textwidth]{rot_figures_left/simulation/transport/MCdata/Si/kurtosis_doping.eps}](img546.png)
![\includegraphics[width=0.5\textwidth]{rot_figures_left/simulation/transport/nin/kur_temp.eps}](img550.png)
![\includegraphics[width=0.5\textwidth]{rot_figures_left/simulation/transport/MCdata/monju/distribution_high.eps}](img551.png)
![\includegraphics[width=0.5\textwidth]{rot_figures_left/simulation/transport/nin/kurtosis_difffield.eps}](img554.png)
![\includegraphics[width=0.5\textwidth]{rot_figures_left/simulation/transport/nin/temp_carrier.eps}](img555.png)
![\includegraphics[width=0.5\textwidth]{rot_figures_left/simulation/transport/nin/velocity_50kV_5kV.eps}](img556.png)
![\includegraphics[width=0.5\textwidth]{rot_figures_left/simulation/transport/ii/Impact_II_200.eps}](img558.png)
![\includegraphics[width=0.5\textwidth]{rot_figures_left/simulation/transport/ii/Impact_II_50.eps}](img559.png)
![\includegraphics[width=0.5\textwidth]{rot_figures_left/simulation/transport/nin/velocity_1000.eps}](img564.png)
![\includegraphics[width=0.5\textwidth]{rot_figures_left/simulation/transport/nin/velocity_500.eps}](img565.png)
![\includegraphics[width=0.5\textwidth]{rot_figures_left/simulation/transport/nin/velocity_250.eps}](img566.png)
![\includegraphics[width=0.5\textwidth]{rot_figures_left/simulation/transport/nin/velocity_100.eps}](img567.png)
![\includegraphics[width=0.5\textwidth]{rot_figures_left/simulation/transport/nin/velocity_80.eps}](img568.png)
![\includegraphics[width=0.5\textwidth]{rot_figures_left/simulation/transport/nin/velocity_40.eps}](img569.png)
![\includegraphics[width=0.5\textwidth]{rot_figures_left/simulation/transport/nin/velocity_30.eps}](img570.png)
![\includegraphics[width=0.5\textwidth]{rot_figures_left/simulation/transport/nin/velocity_20.eps}](img571.png)
![\includegraphics[width=0.5\textwidth]{rot_figures_left/simulation/transport/nin/velocity_15.eps}](img572.png)
![\includegraphics[width=0.5\textwidth]{rot_figures_left/simulation/transport/nin/entransport_mc.eps}](img573.png)
![\includegraphics[width=0.5\textwidth]{rot_figures_left/simulation/transport/nin/current_short.eps}](img574.png)
![\includegraphics[width=0.5\textwidth]{rot_figures_left/simulation/transport/nin/relative_error_short.eps}](img578.png)