2.7 Molecular Dynamics Simulations of Orientation Dependences
Heretofore, the macroscopic oxidation models, parameters, and methods to improve 2D and 3D simulations have been discussed, but not the oxidation kinetics on the atomistic level. Within this work’s context, molecular dynamics (MD) simulations enable first principles investigations of the early stages of the oxidation process, where experimental methods fail to provide the necessary data, due to technical limitations. The main limitation of oxide thickness measurements is a low accuracy of measurements of the oxide growth on very short time scales or oxide thicknesses below 5 nm. The first principles approach is thus essential in order to further develop macroscopic physical models and to estimate initial oxide thicknesses for macroscopic models.
Computational methods on atomic or molecular levels provide powerful ways to explore, develop, and optimize novel materials. Such methods, commonly based on quantum mechanics (QM) [114], are computationally very expensive and can thus be reasonably applied only to small-sized atomic systems, typically containing a few tens of atoms. To overcome this issue, QM structure and energy data can be used to train empirical force fields in order to reduce the computational effort [76]. Therefore, a novel empirical reactive force-field (ReaxFF) method [115, 116] can be utilized. The ReaxFF method replaces harmonic bonds of conventional MD with bond orders and energies that depend on interatomic distances, which thus reduces simulation time by several orders of magnitude [117, 118, 119, 120].
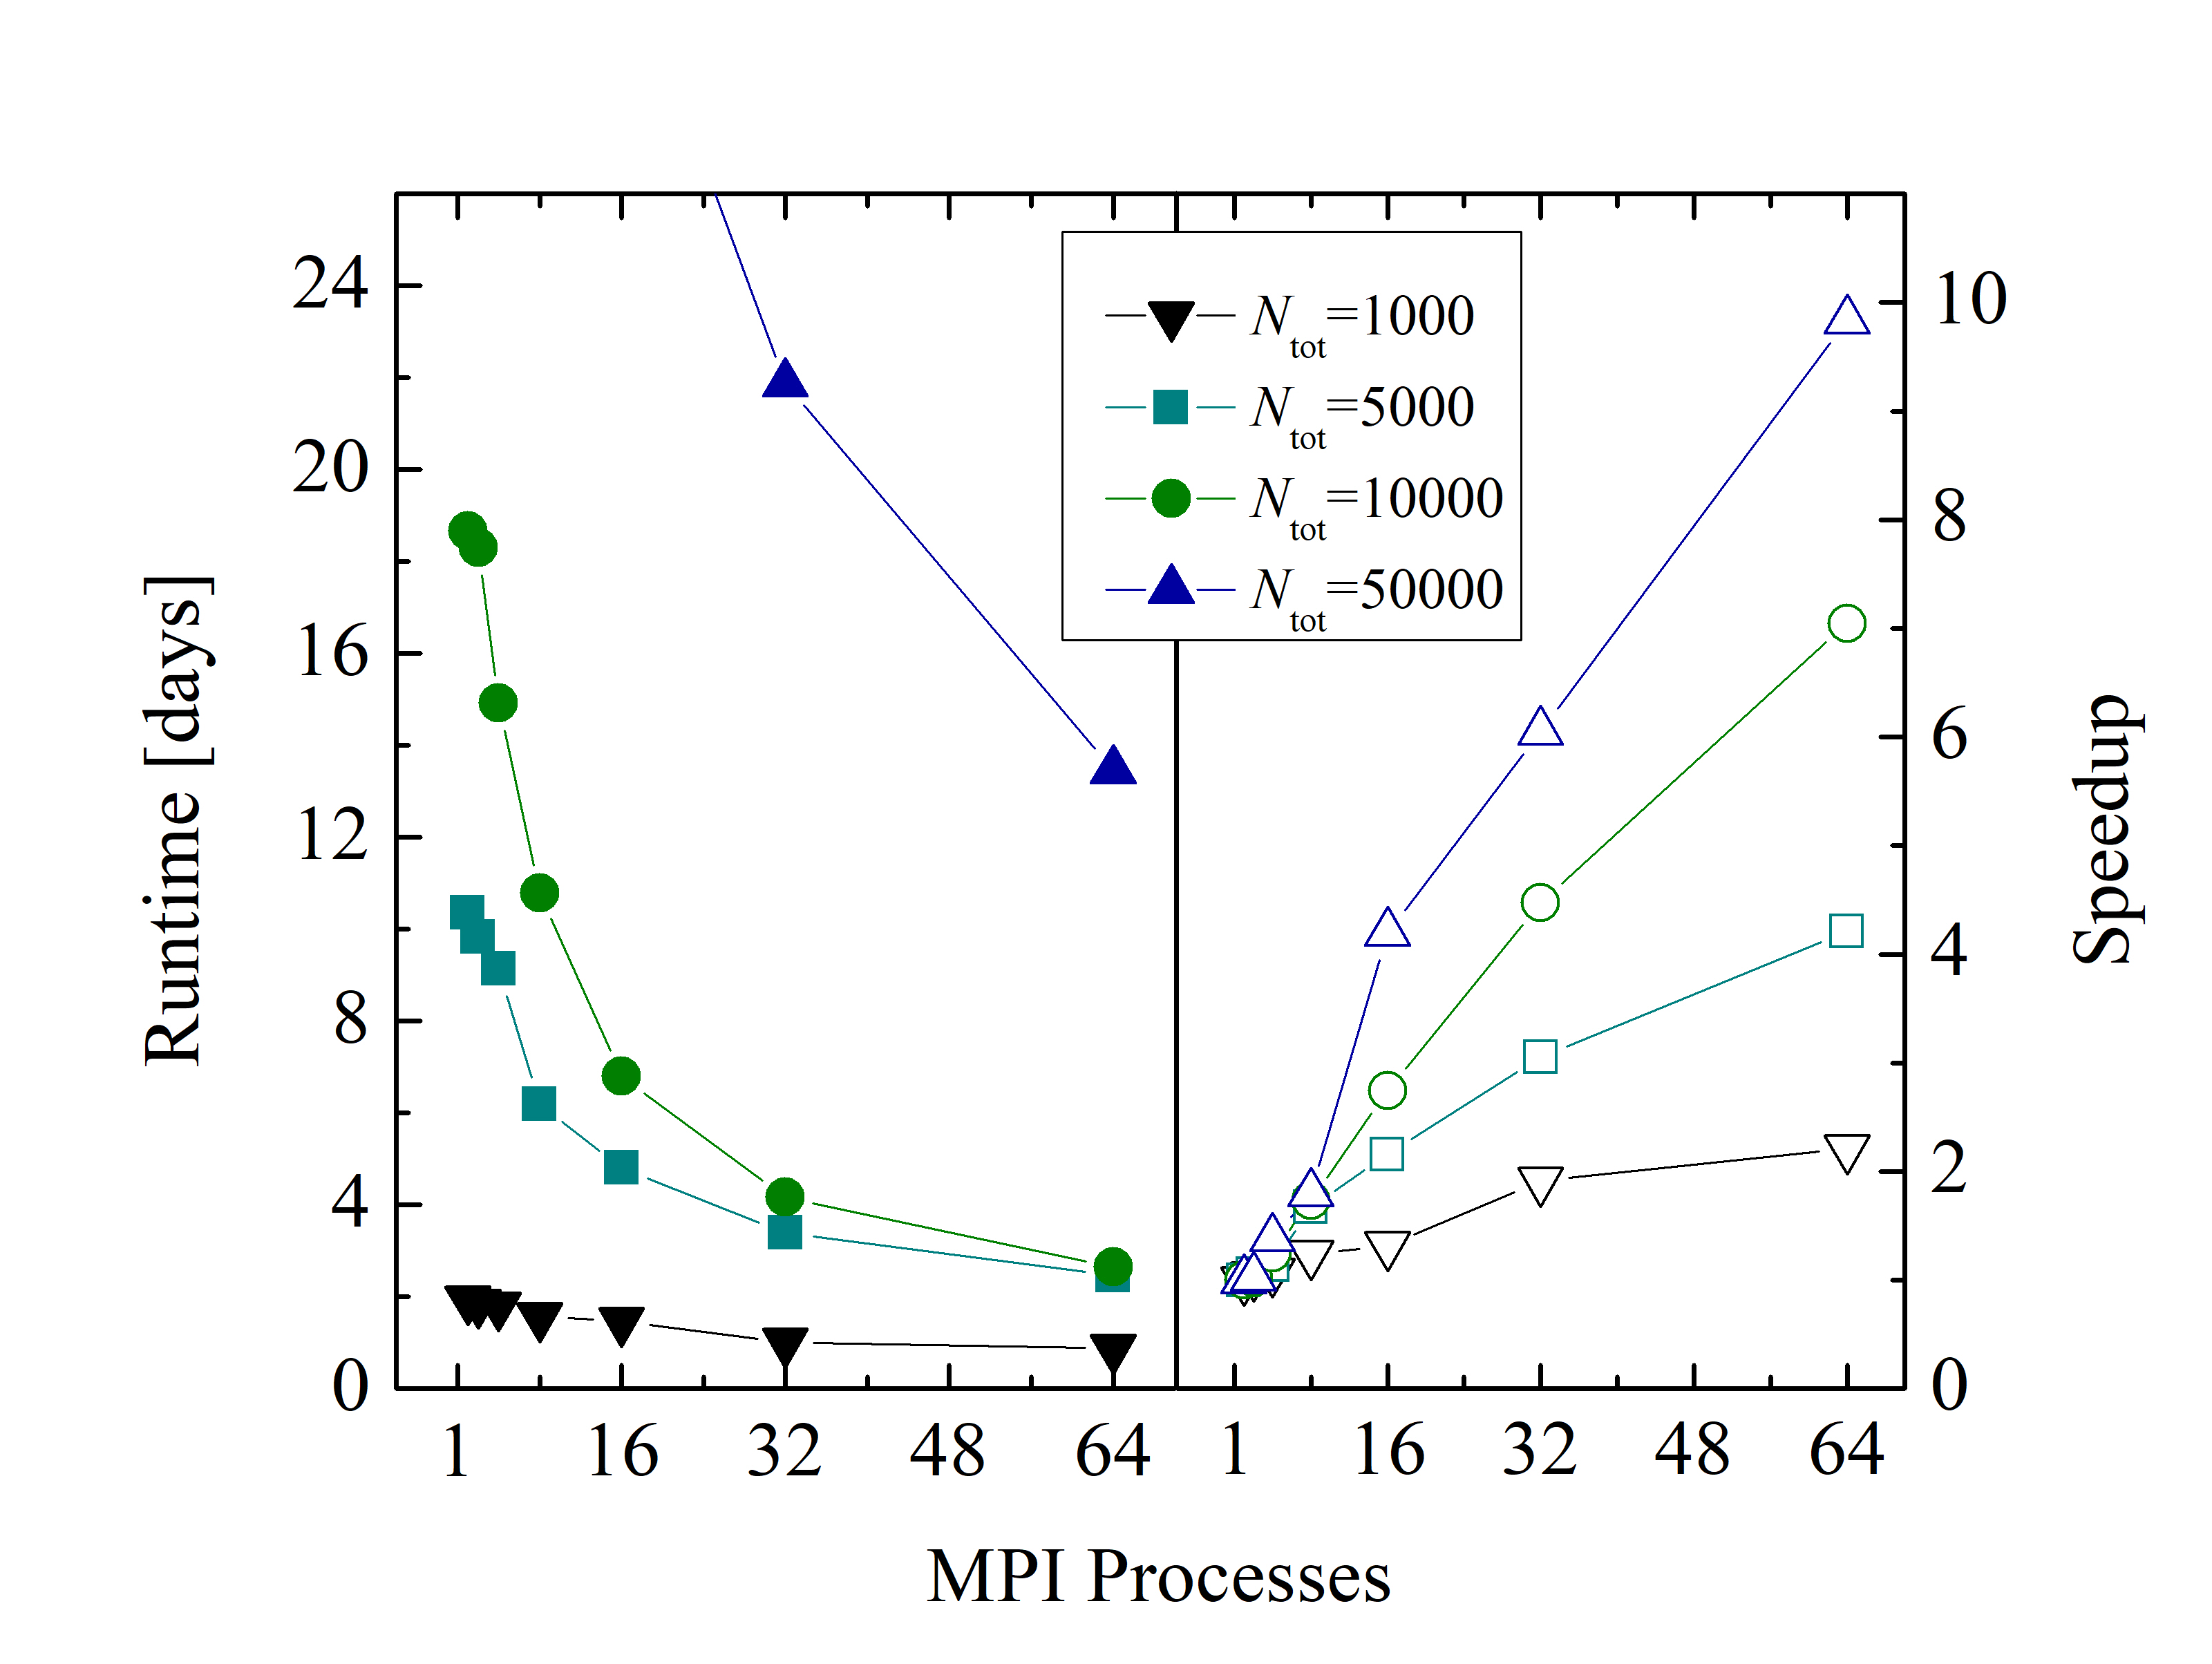
The parameters involved in the ReaxFF potential functions must be parametrized against high-level ab initio calculations and experimental results. The potentials for the atoms involved in the SiC oxidation, i.e., Si/C/O, have been previously developed, calibrated, and parametrized [76, 121, 122]. State-of-the-art implementations of ReaxFF, e.g., provided by the large-scale atomic/molecular massively parallel simulator (LAMMPS) [123], have demonstrated reasonable computational efficiency and accuracy. Furthermore, LAMMPS is distributed as an open-source code and supports parallel computing via OpenMP and MPI. In order to take advantage of the parallel computing features, the analyses presented in the following were executed on the Vienna Scientific Cluster (VSC-3) [124], which consists of 2020 nodes, each equipped with two 8-core Intel Xeon E5-2650v2 2.6 GHz processors (total of 16 physical/32 logical cores per node) and 64 GB of main memory.
An evaluation of the parallelization backends of LAMMPS (i.e., USER-OMP package, including OpenMP and MPI) shows better performance with a pure MPI approach, compared to using a hybrid MPI - OpenMP approach. The benchmark of an example MD simulation for various atom numbers is shown in Figure 2.25. Despite the relatively low parallel efficiency of the simulations (i.e., 35% in the best case), the LAMMPS’ USER-OMP package enables a significant reduction of the overall simulation runtime (e.g., from 18 days to 4 days for 104 particles).
2.7.1 Simulation Setup
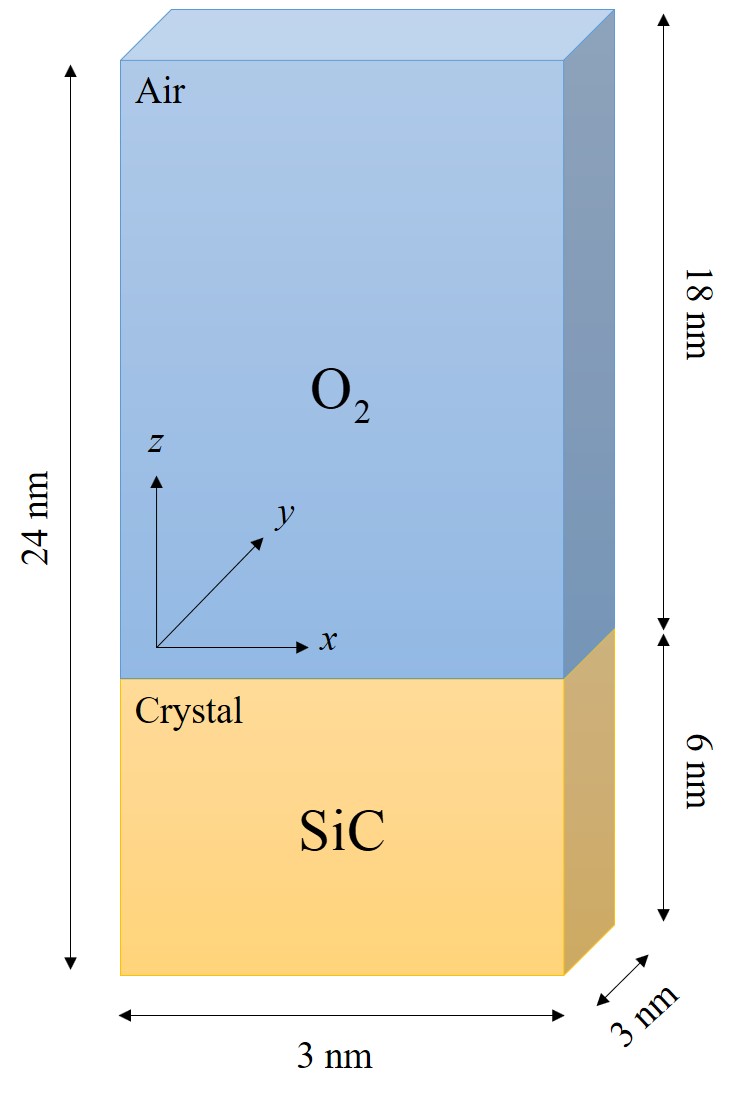
The goal is to investigate several layers of SiO2 and to shed light on the oxide growth differences of various SiC orientations. Therefore, 1 ns oxide growth is simulated with 2 · 106 timesteps using a step size of 0.5 fs. The number of atoms involved in the simulations must be properly limited in order to be able to perform the desired number of timesteps. On the other hand, the number of O2 molecules must be high enough to ensure a constant gas flow. For this reason, numerous control simulations have been performed with respect to various simulation sizes to ensure that the product gases in the air do not further affect the oxidation and that an adequate number of O2 molecules is available at every timestep of the simulation. The initial structure setup consists of approximately 10 SiC layers in x and y directions and 27 SiC layers in z direction. The space on top of the substrate is three times the height of the crystal with uniform random distribution of O2 molecules, indicating dry air conditions for the thermal oxidation. The schematic representation of the 3 · 3 · 24 nm3 simulation domain is shown in Figure 2.26. The total number of particles in all simulations is approximately 104, out of which ≈ 3600 are Si and C atoms. The surfaces of SiC are not initially passivated, as the passivated surfaces could affect the investigation of the orientation dependence of the initial oxidation growth rates [125].
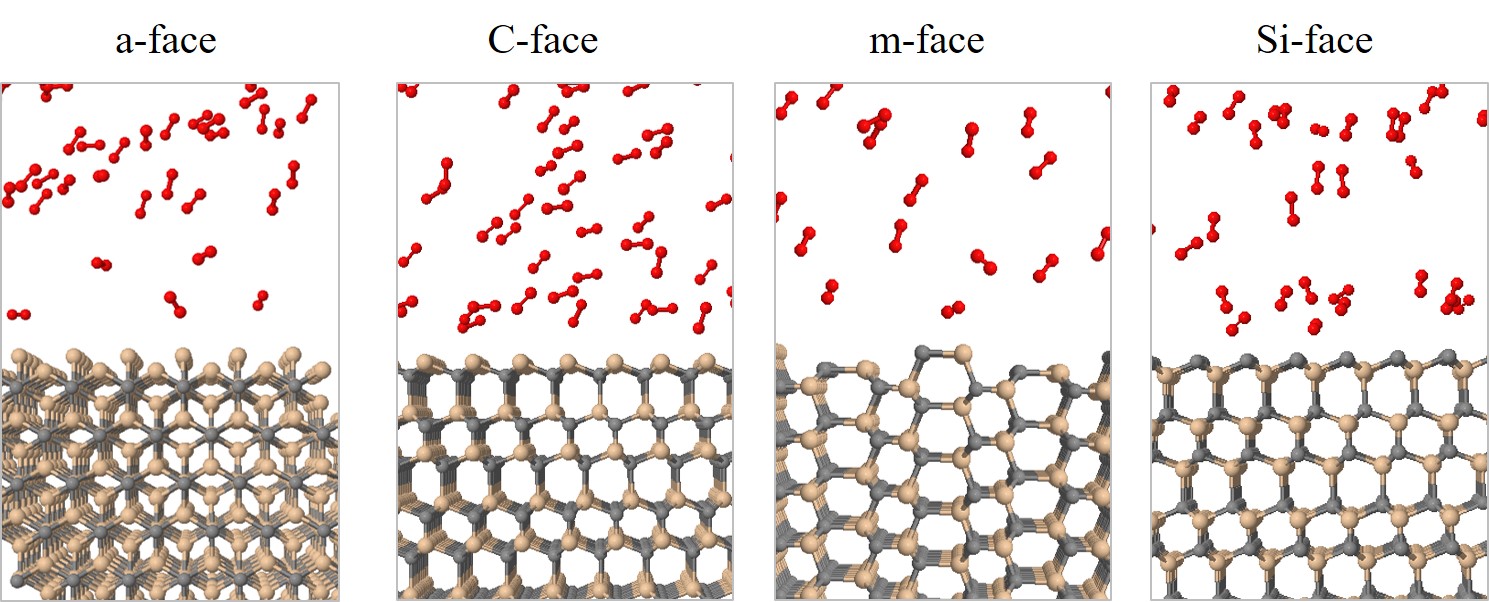
All simulations are performed in the canonical ensemble, depending on the absolute temperature, number of particles, and volume (NVT). The boundary conditions are periodic in x and y directions and reflective in z direction, to avoid undesired oxidation on the bottom of the substrate. The temperature of the simulations is controlled with the Berendsen thermostat [126] with a temperature damping constant of 100 fs. Simulations are performed with four common industry-focused oxidation temperatures: T = 900, 1000, 1100, and 1200°C. In order to investigate orientation dependence, four different initial structures are prepared, which represent the four considered SiC faces, shown in Figure 2.27.
2.7.2 Simulation Results and Analyses
The structural evolution of the SiC/O2 system is shown in Figure 2.28 for 103, 104, 105, and 106 fs, respectively. The time evolution clearly shows all of the oxidation process steps: 1) transport of O2 to the oxide surface, 2) in-diffusion of O2 through the oxide film, 3) reaction of O2 and SiC at the SiO2/SiC interface, 4) out-diffusion of carbon oxide (CO) through the oxide film, and 5) removal of the product gases away from the oxide surface. To follow the oxidation process, the number of O atoms in the SiC crystal (NOSiC) and air (NOAir) is analyzed. The evolution of the O atoms reacting with the SiC structure for the four crystallographic faces at T = 900, 1000, 1100, and 1200°C is shown in Figure 2.29.
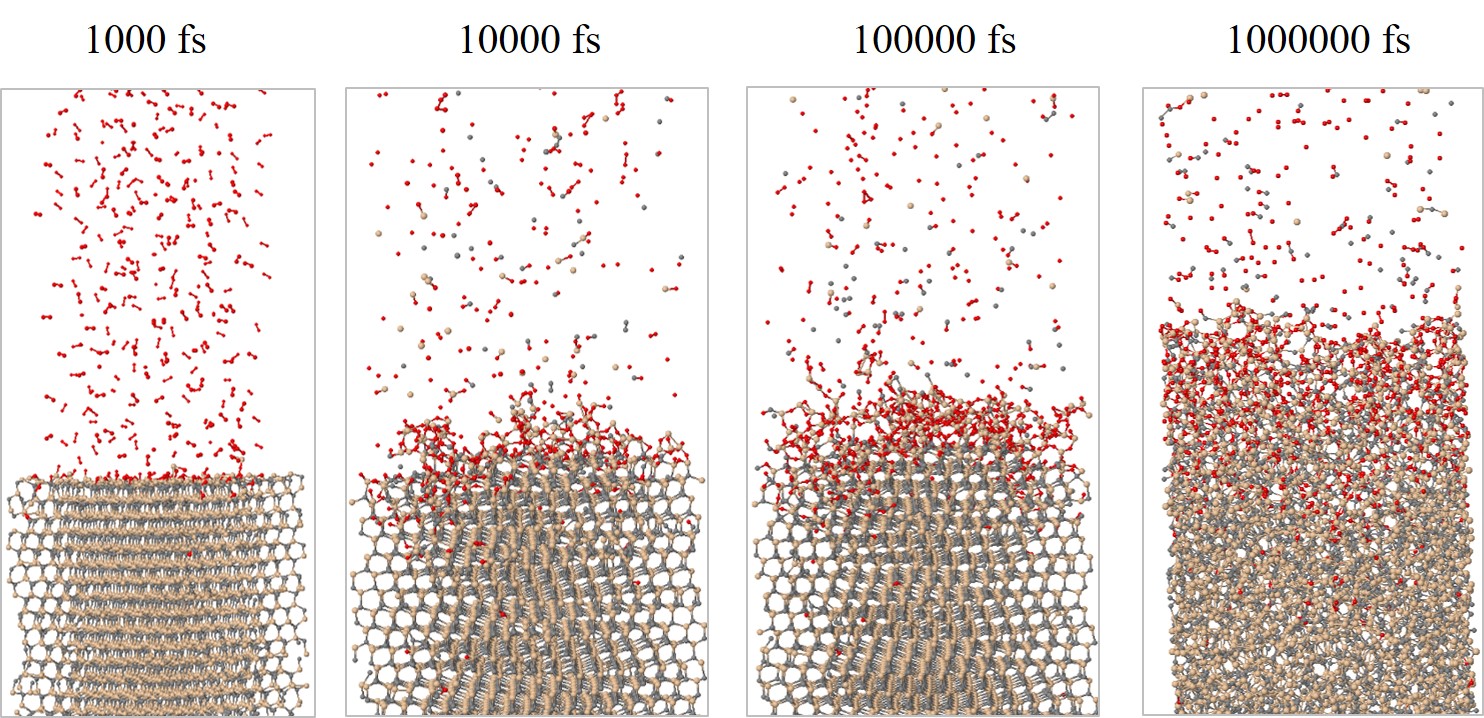
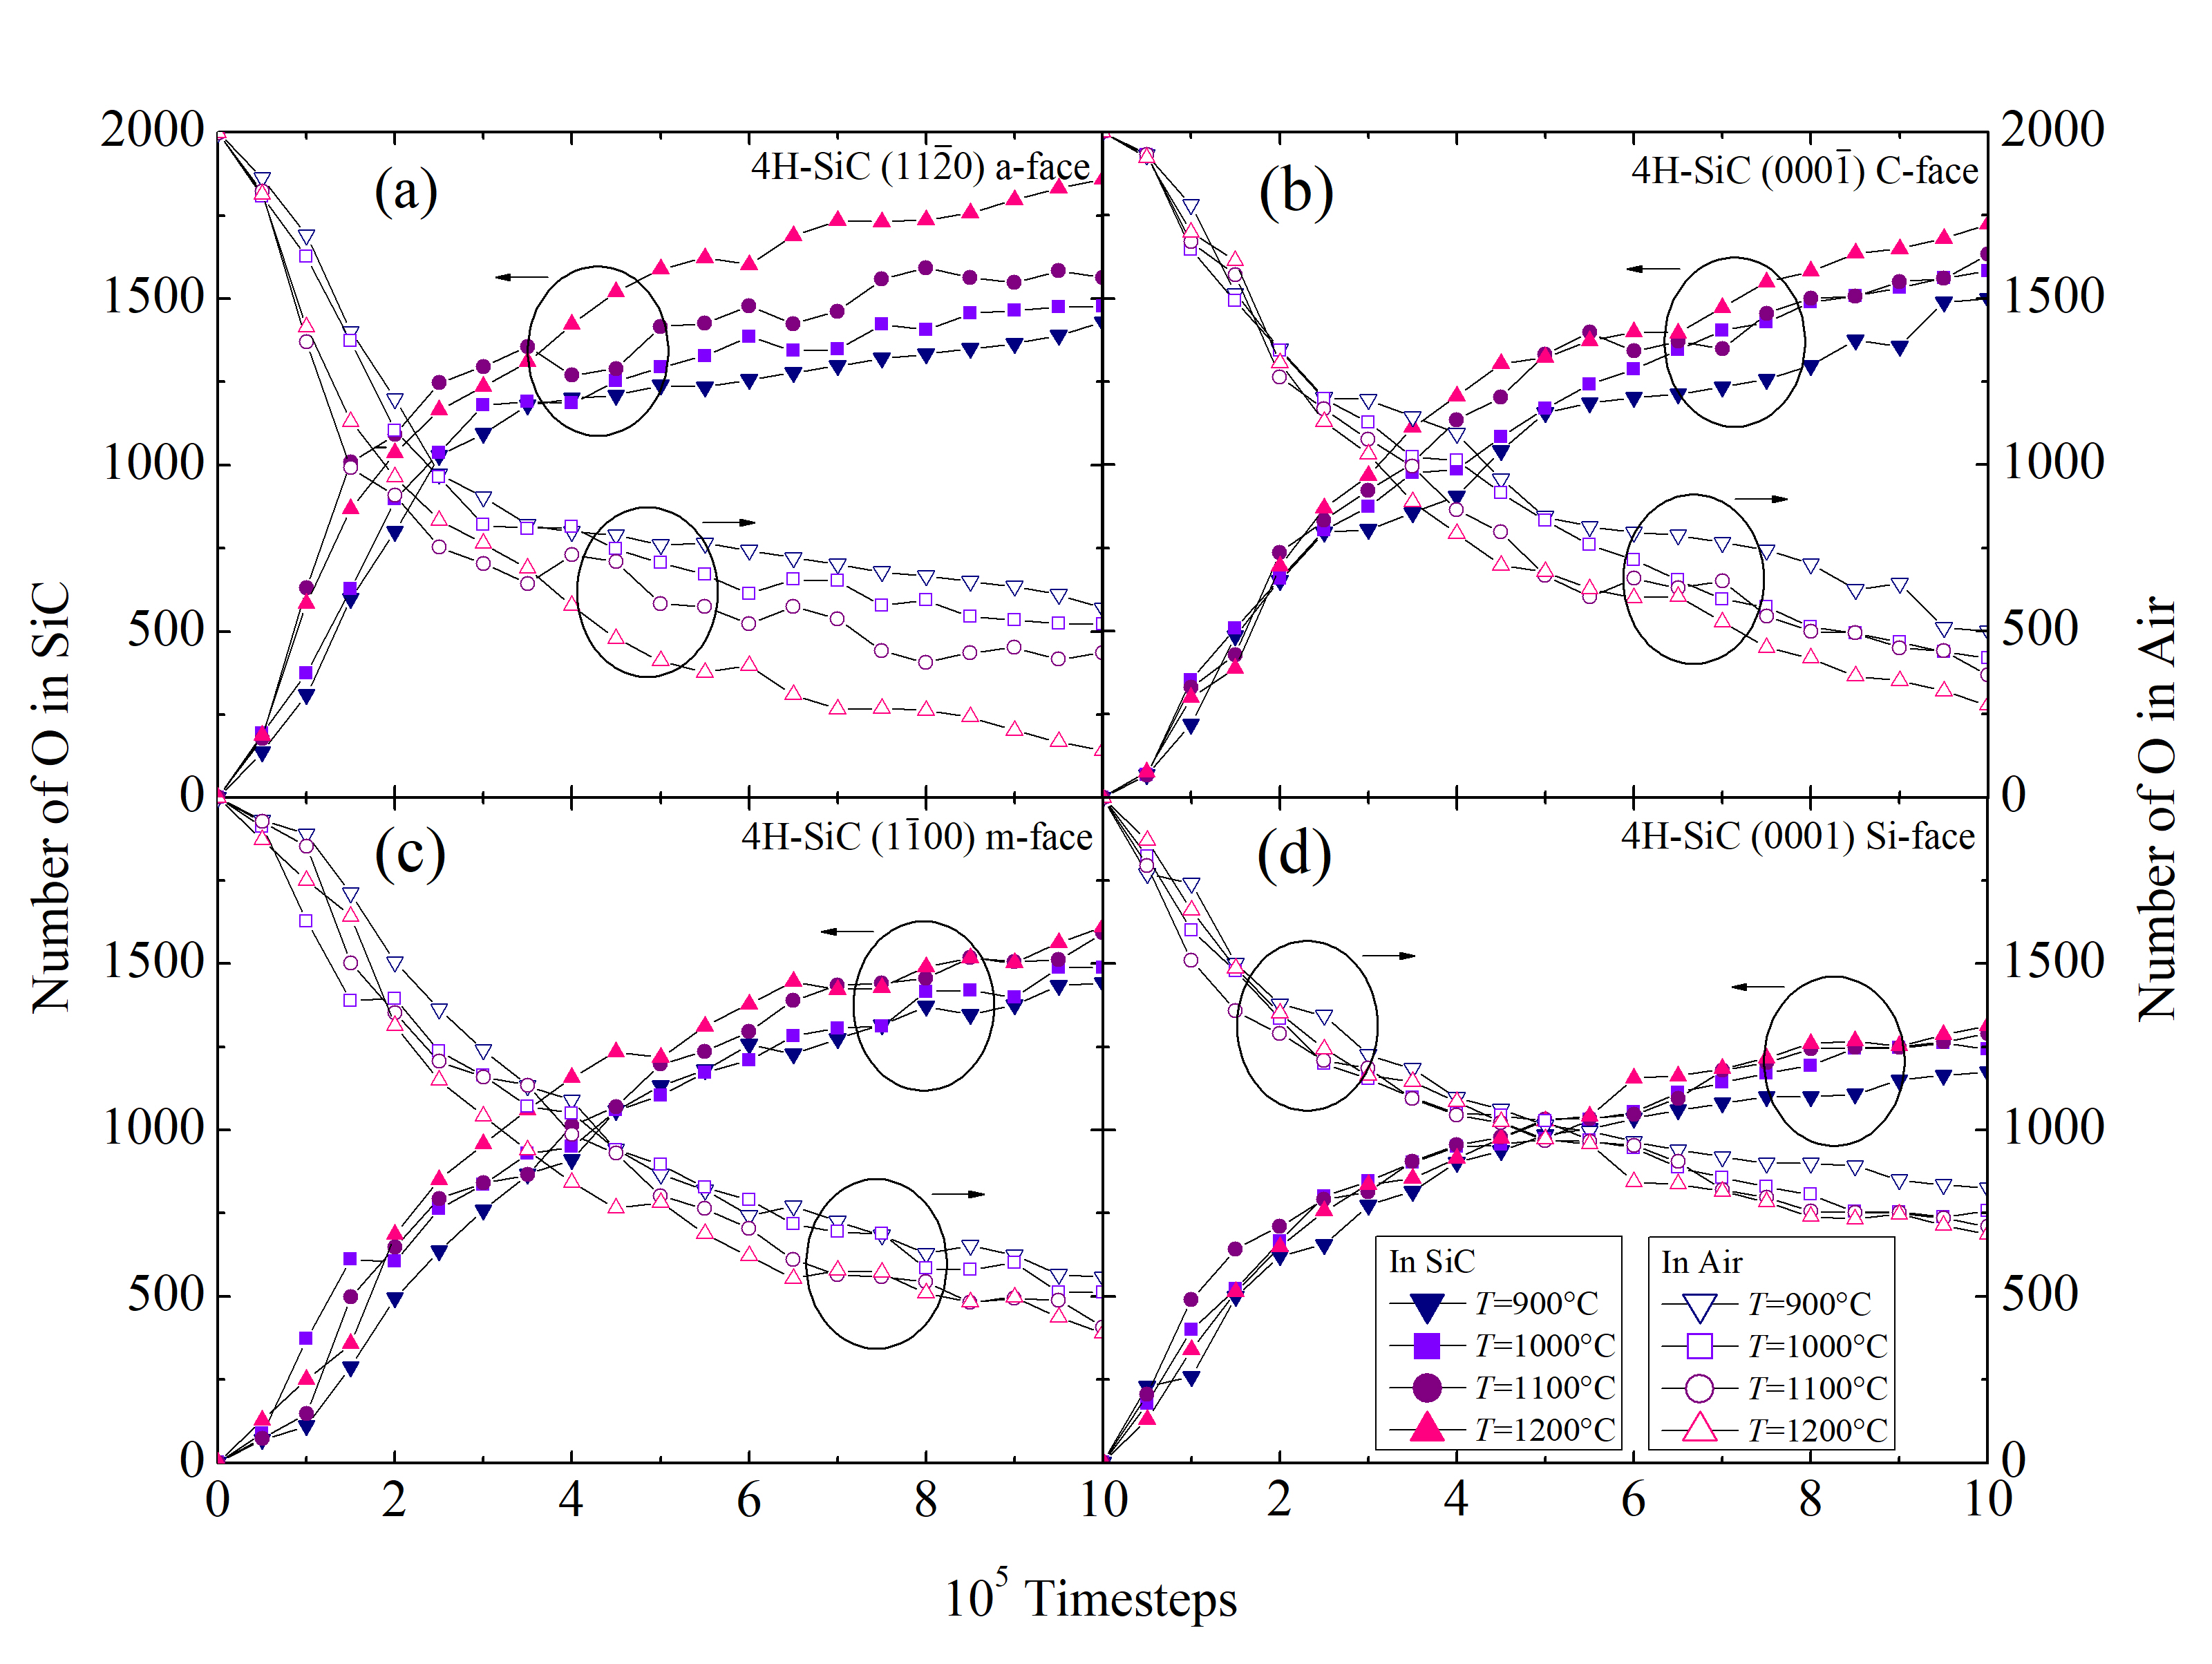
It is clearly evident that the concentration of the O atoms in SiC is increasing with time, which indicates a successful oxidation process. As the SiO2 is formed on top of the crystal, the chemical reaction is passivated, which is evident by the decreasing slope of the curves. The formed oxide affects the in-diffusion of the O2 and the out-diffusion of the product gases through the oxide film, therefore, the oxidation process is decelerated.
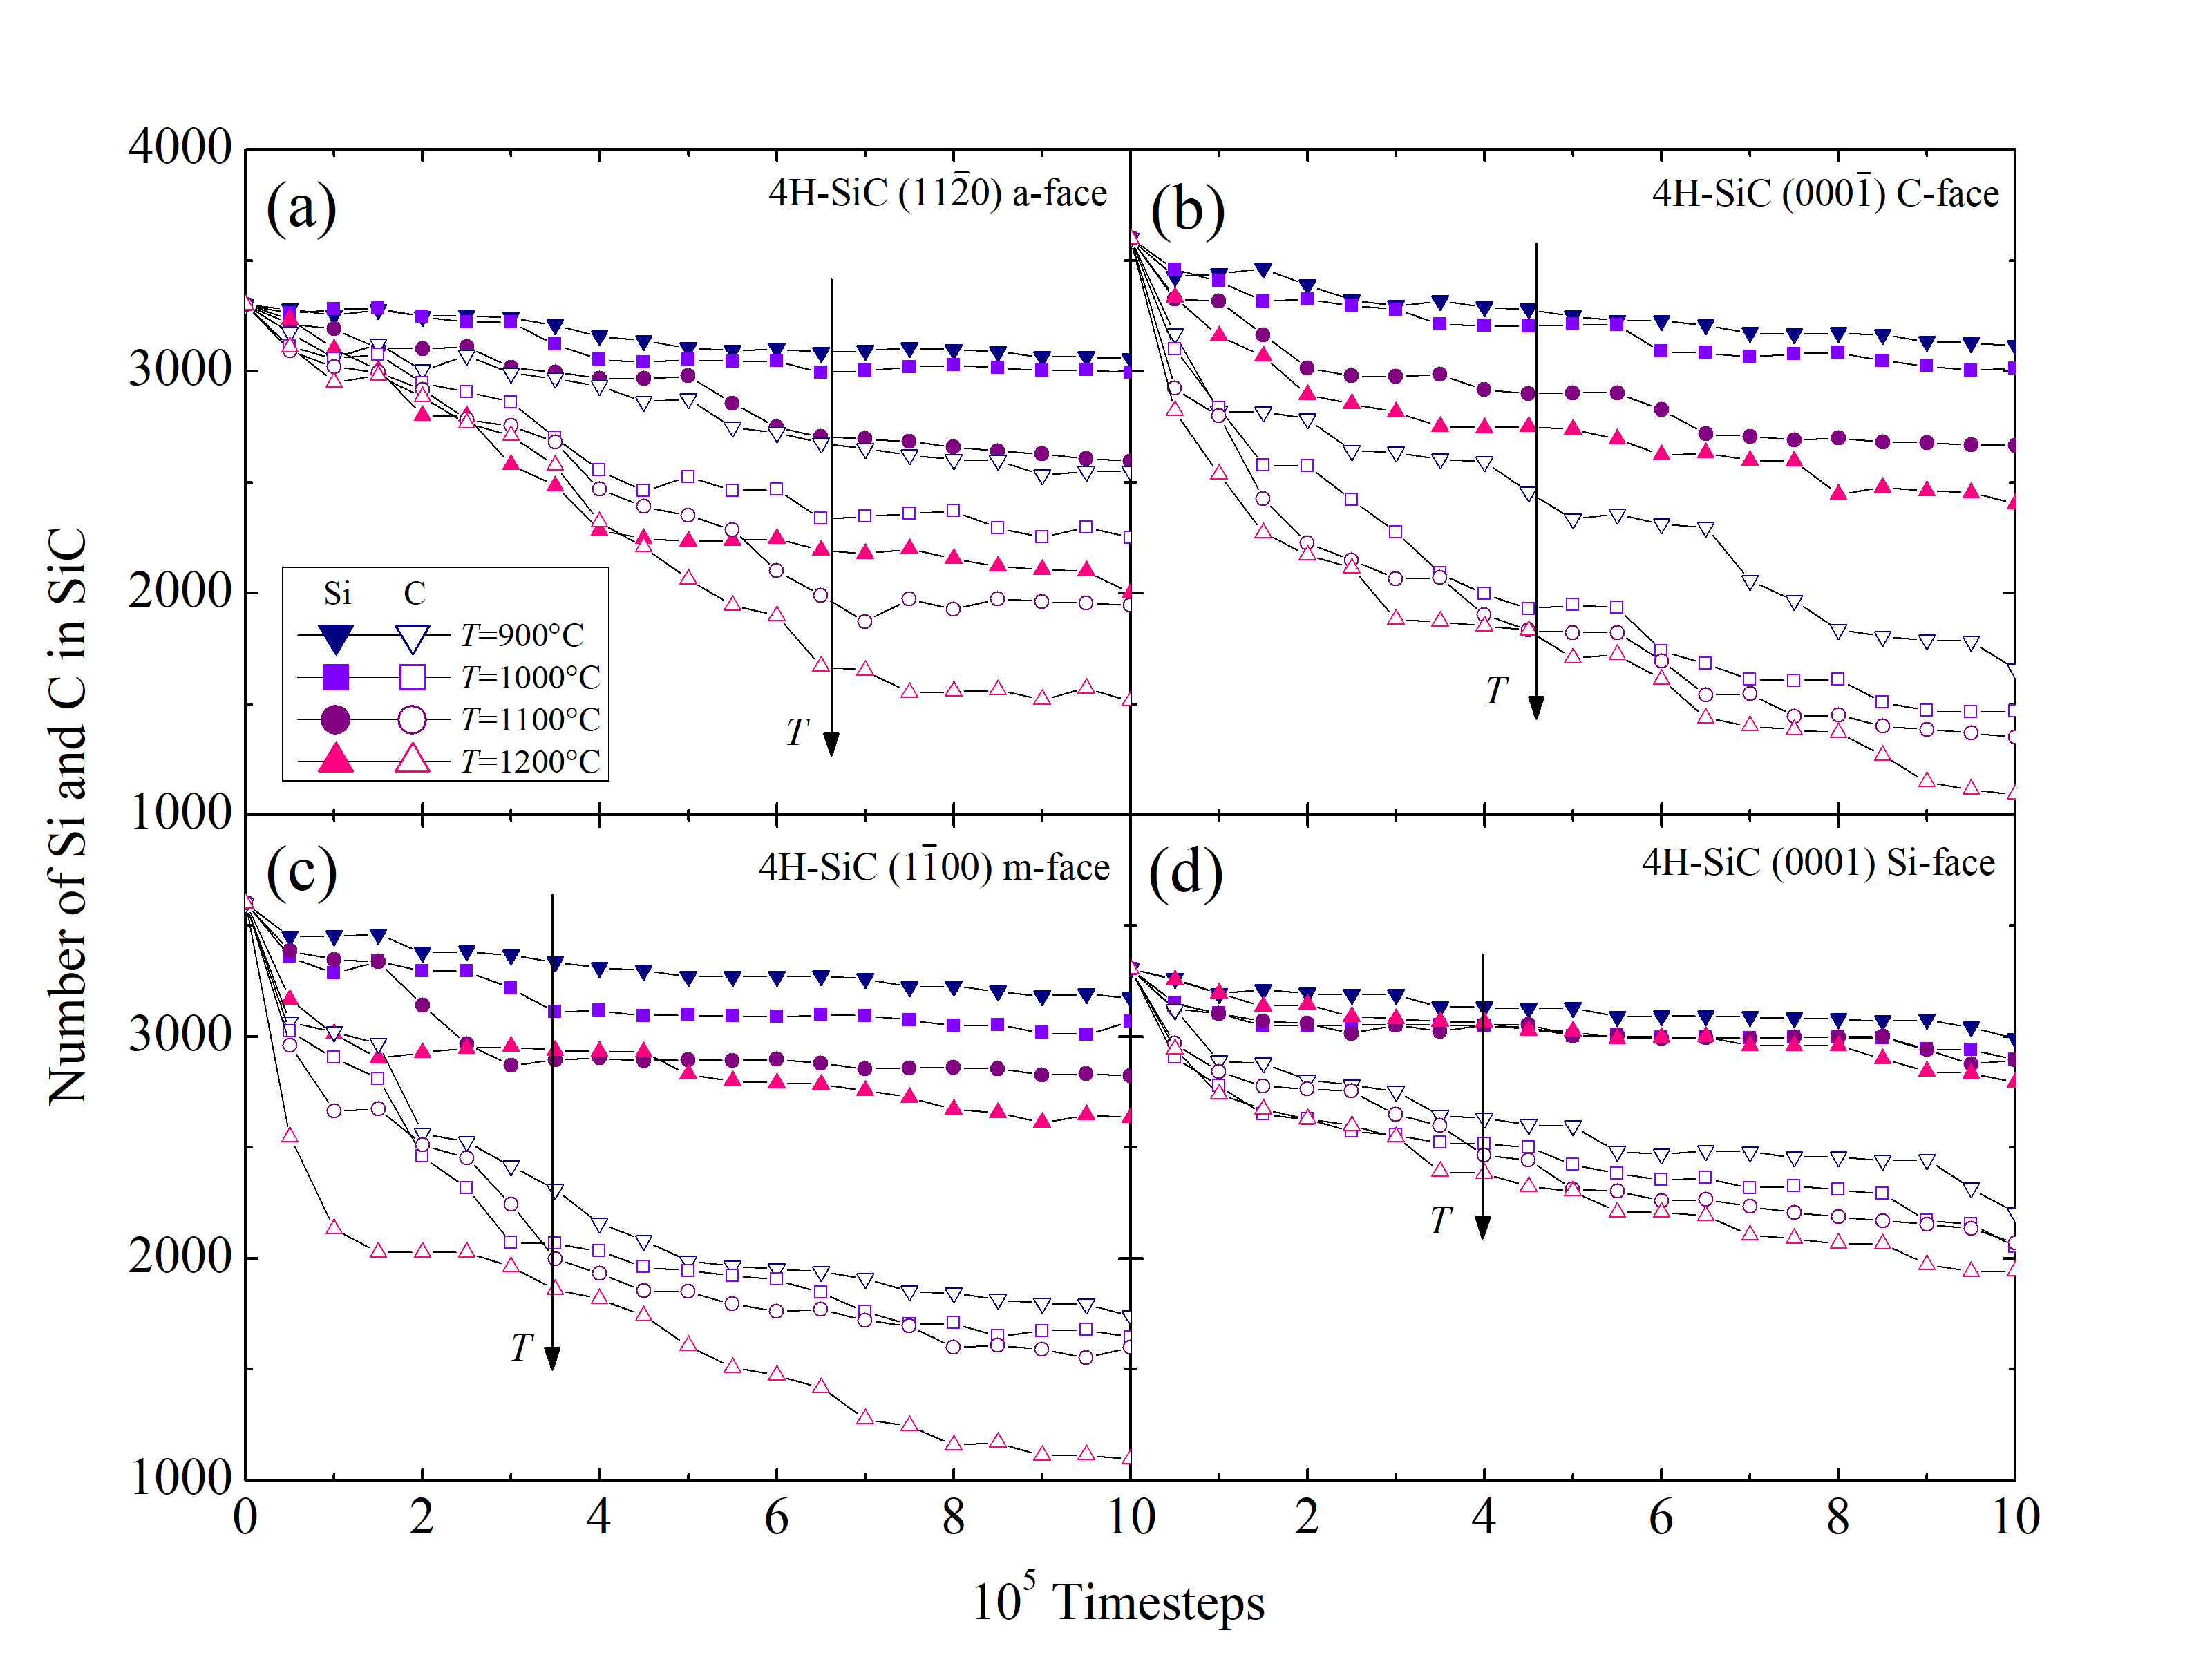
Another essential figure of merit is the time evolution of the number of Si (NSiSiC) and C (NCSiC) atoms in the SiC crystal. The results for the four SiC faces and for the four investigated temperatures are shown in Figure 2.30. Si and C in this case are traced as single atoms, but are in fact diffused out of the crystal as product gases. The oxidation temperature clearly affects the diffusion of the Si, C, and O species, which confirms that even the early stage of the oxidation mechanism, i.e., < 1 ns, is temperature-dependent.
The Figure 2.30 additionally suggest that the out-diffusion of the C interstitials is higher than the one of the Si interstitials. This is in agreement with previous reports [69] and confirms the assumption of the Si and C emission model [102, 75], that the accumulation of the C interstitials becomes saturated prior to that of the Si interstitials. In addition, C and Si emission suppresses the interfacial reaction rate during oxidation.
The impact of the anisotropy on the oxide thickness is further investigated for the particular case of 1100°C, as seen in Figure 2.31 for the four crystallographic faces. The oxide thickness is calculated for each time step of the simulation. The results show that even after a very short time of oxidation (i.e., 1 ns) the thickness of the oxide grows up to 2.7 nm. This suggests that the initial oxidation is taking place almost instantaneously relative to the industry-focused oxidation times and clarifies the assumption of the macroscopic models [72, 70, 75], that the oxide thickness at t = 0 is approximately 2-5 nm.
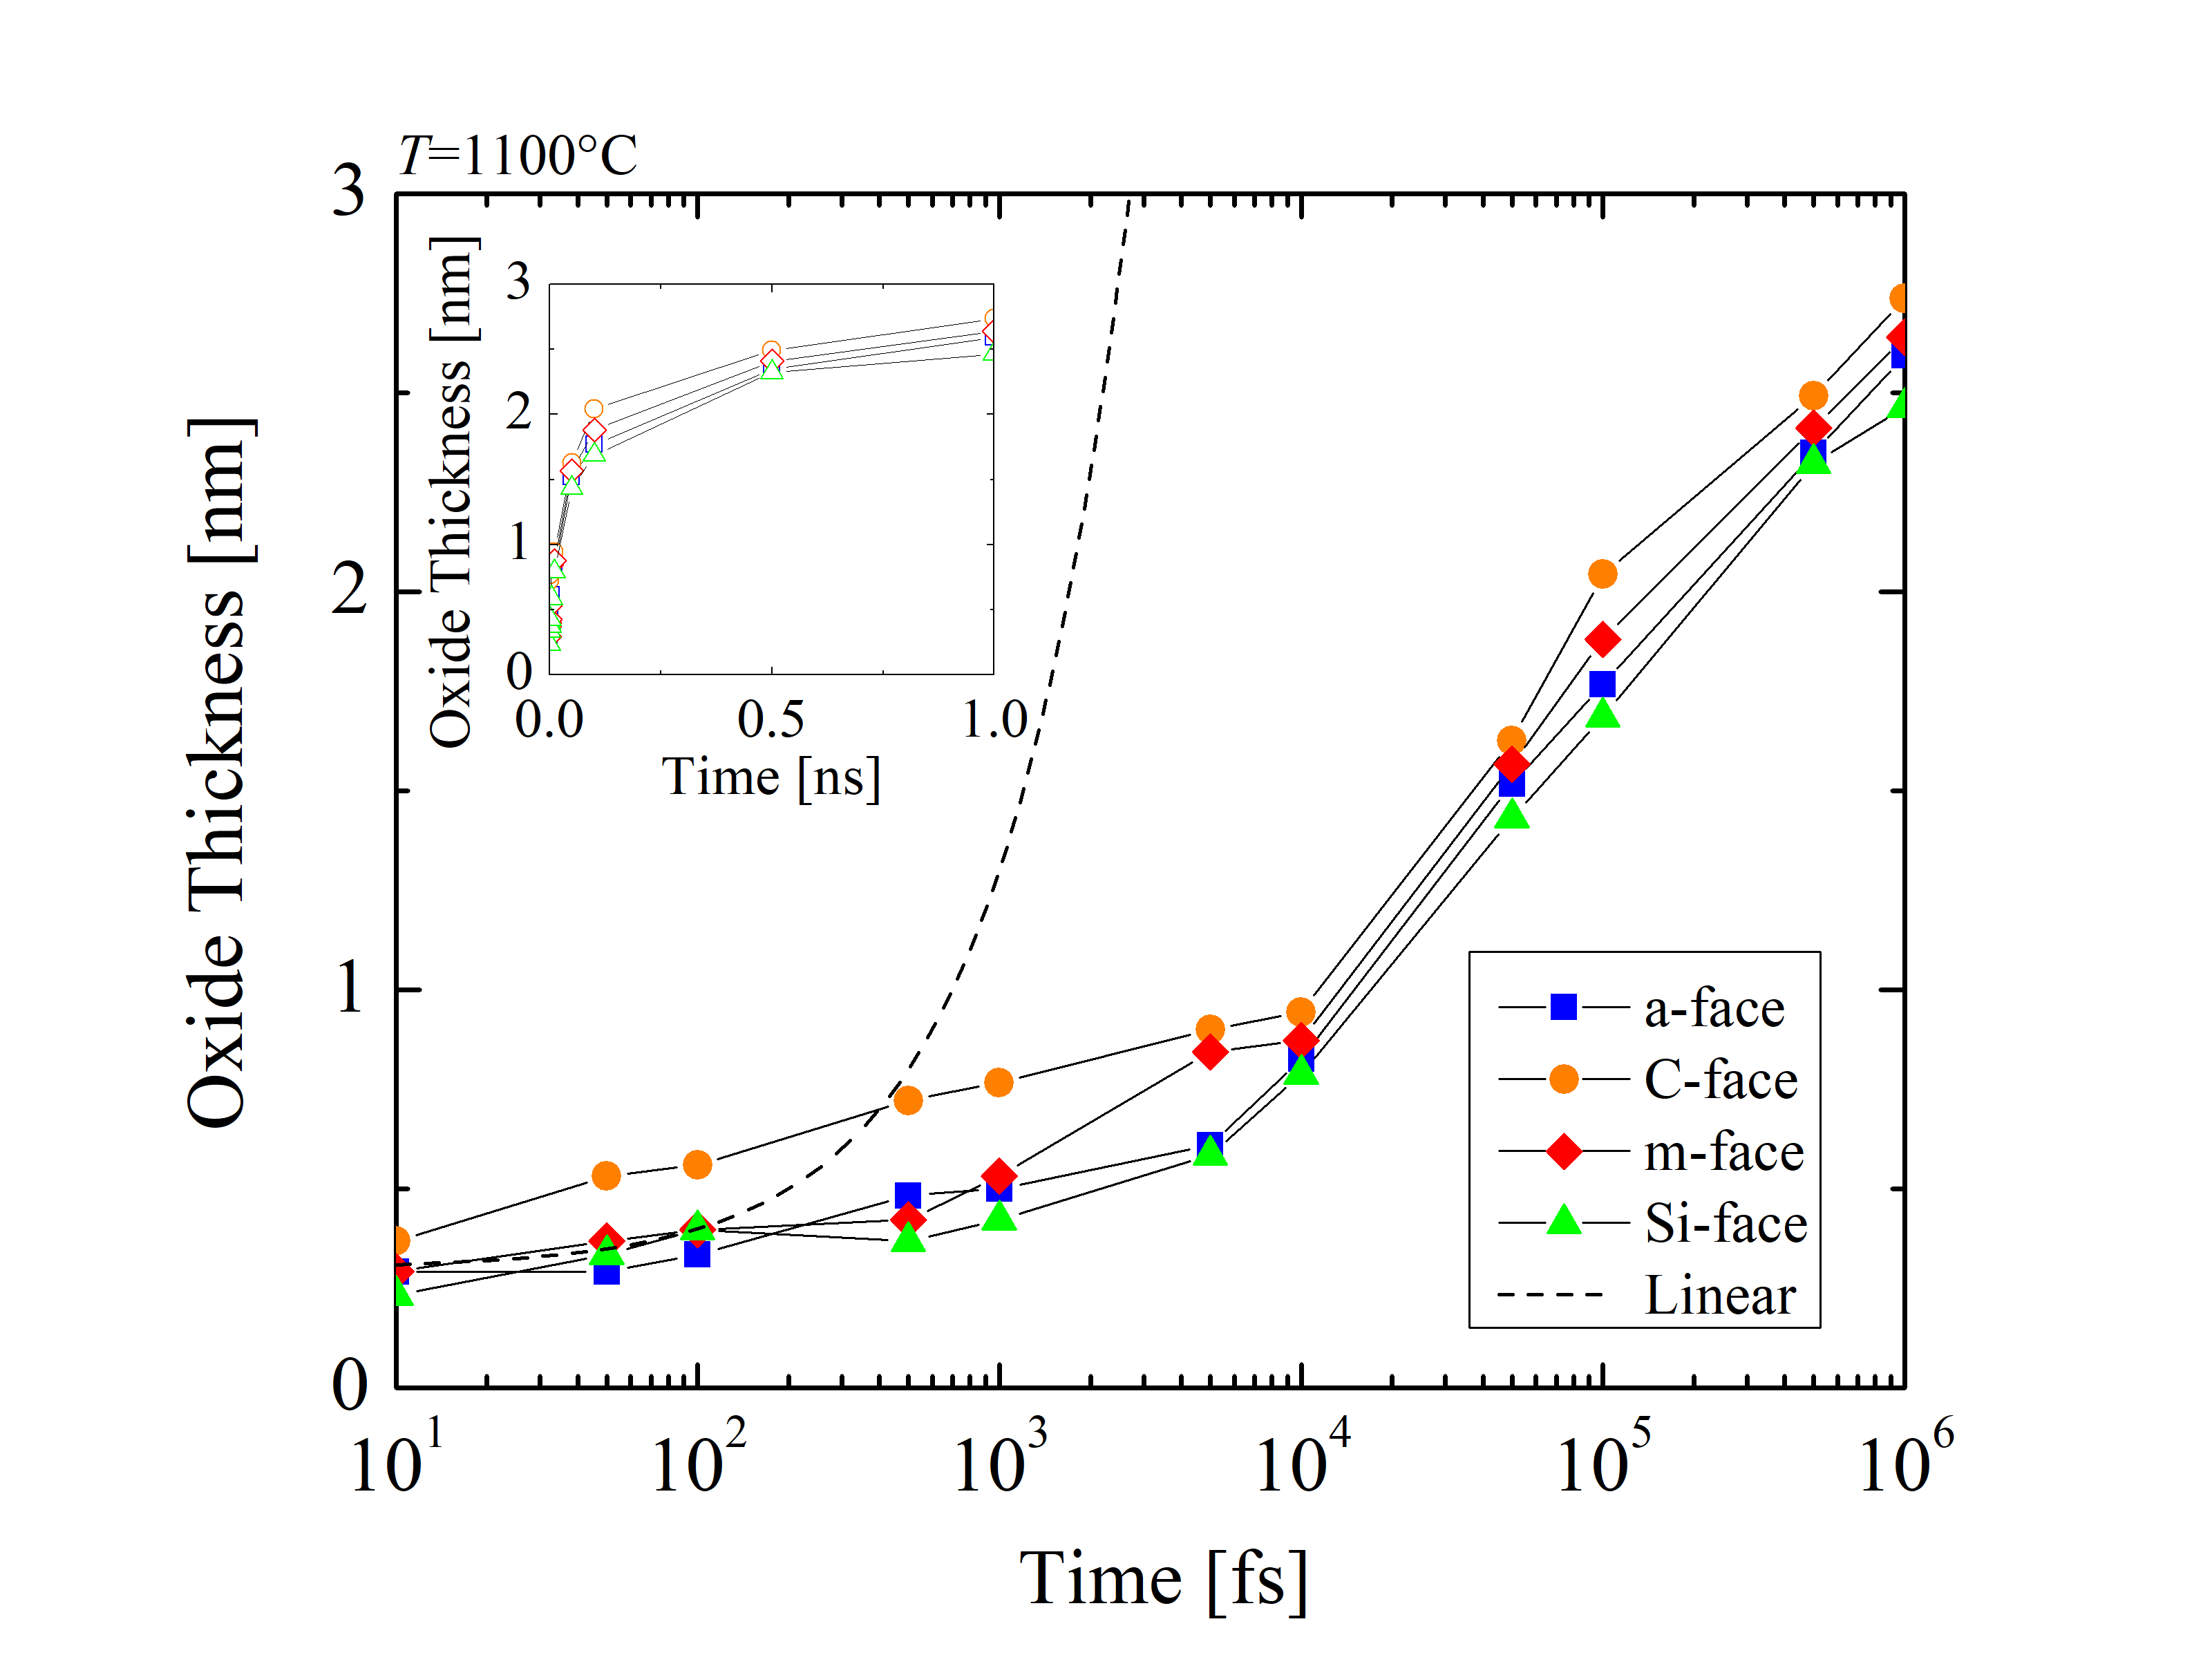
A symbolic linear growth rate (dashed line) with the slope of 1 · 10-3 nm/fs and the intercept 0.3 nm highlights the difference between the simulation results and a hypothetical but inaccurate linear assumption. This clearly shows that a linear growth rate cannot be assumed. Comparing the oxide evolution with linear growth, it is evident that the growth rate is significantly reduced as the oxide layer grows. Thus, it can be concluded that the relationship between the oxide thickness and time is non-linear for the early stage of the oxidation.
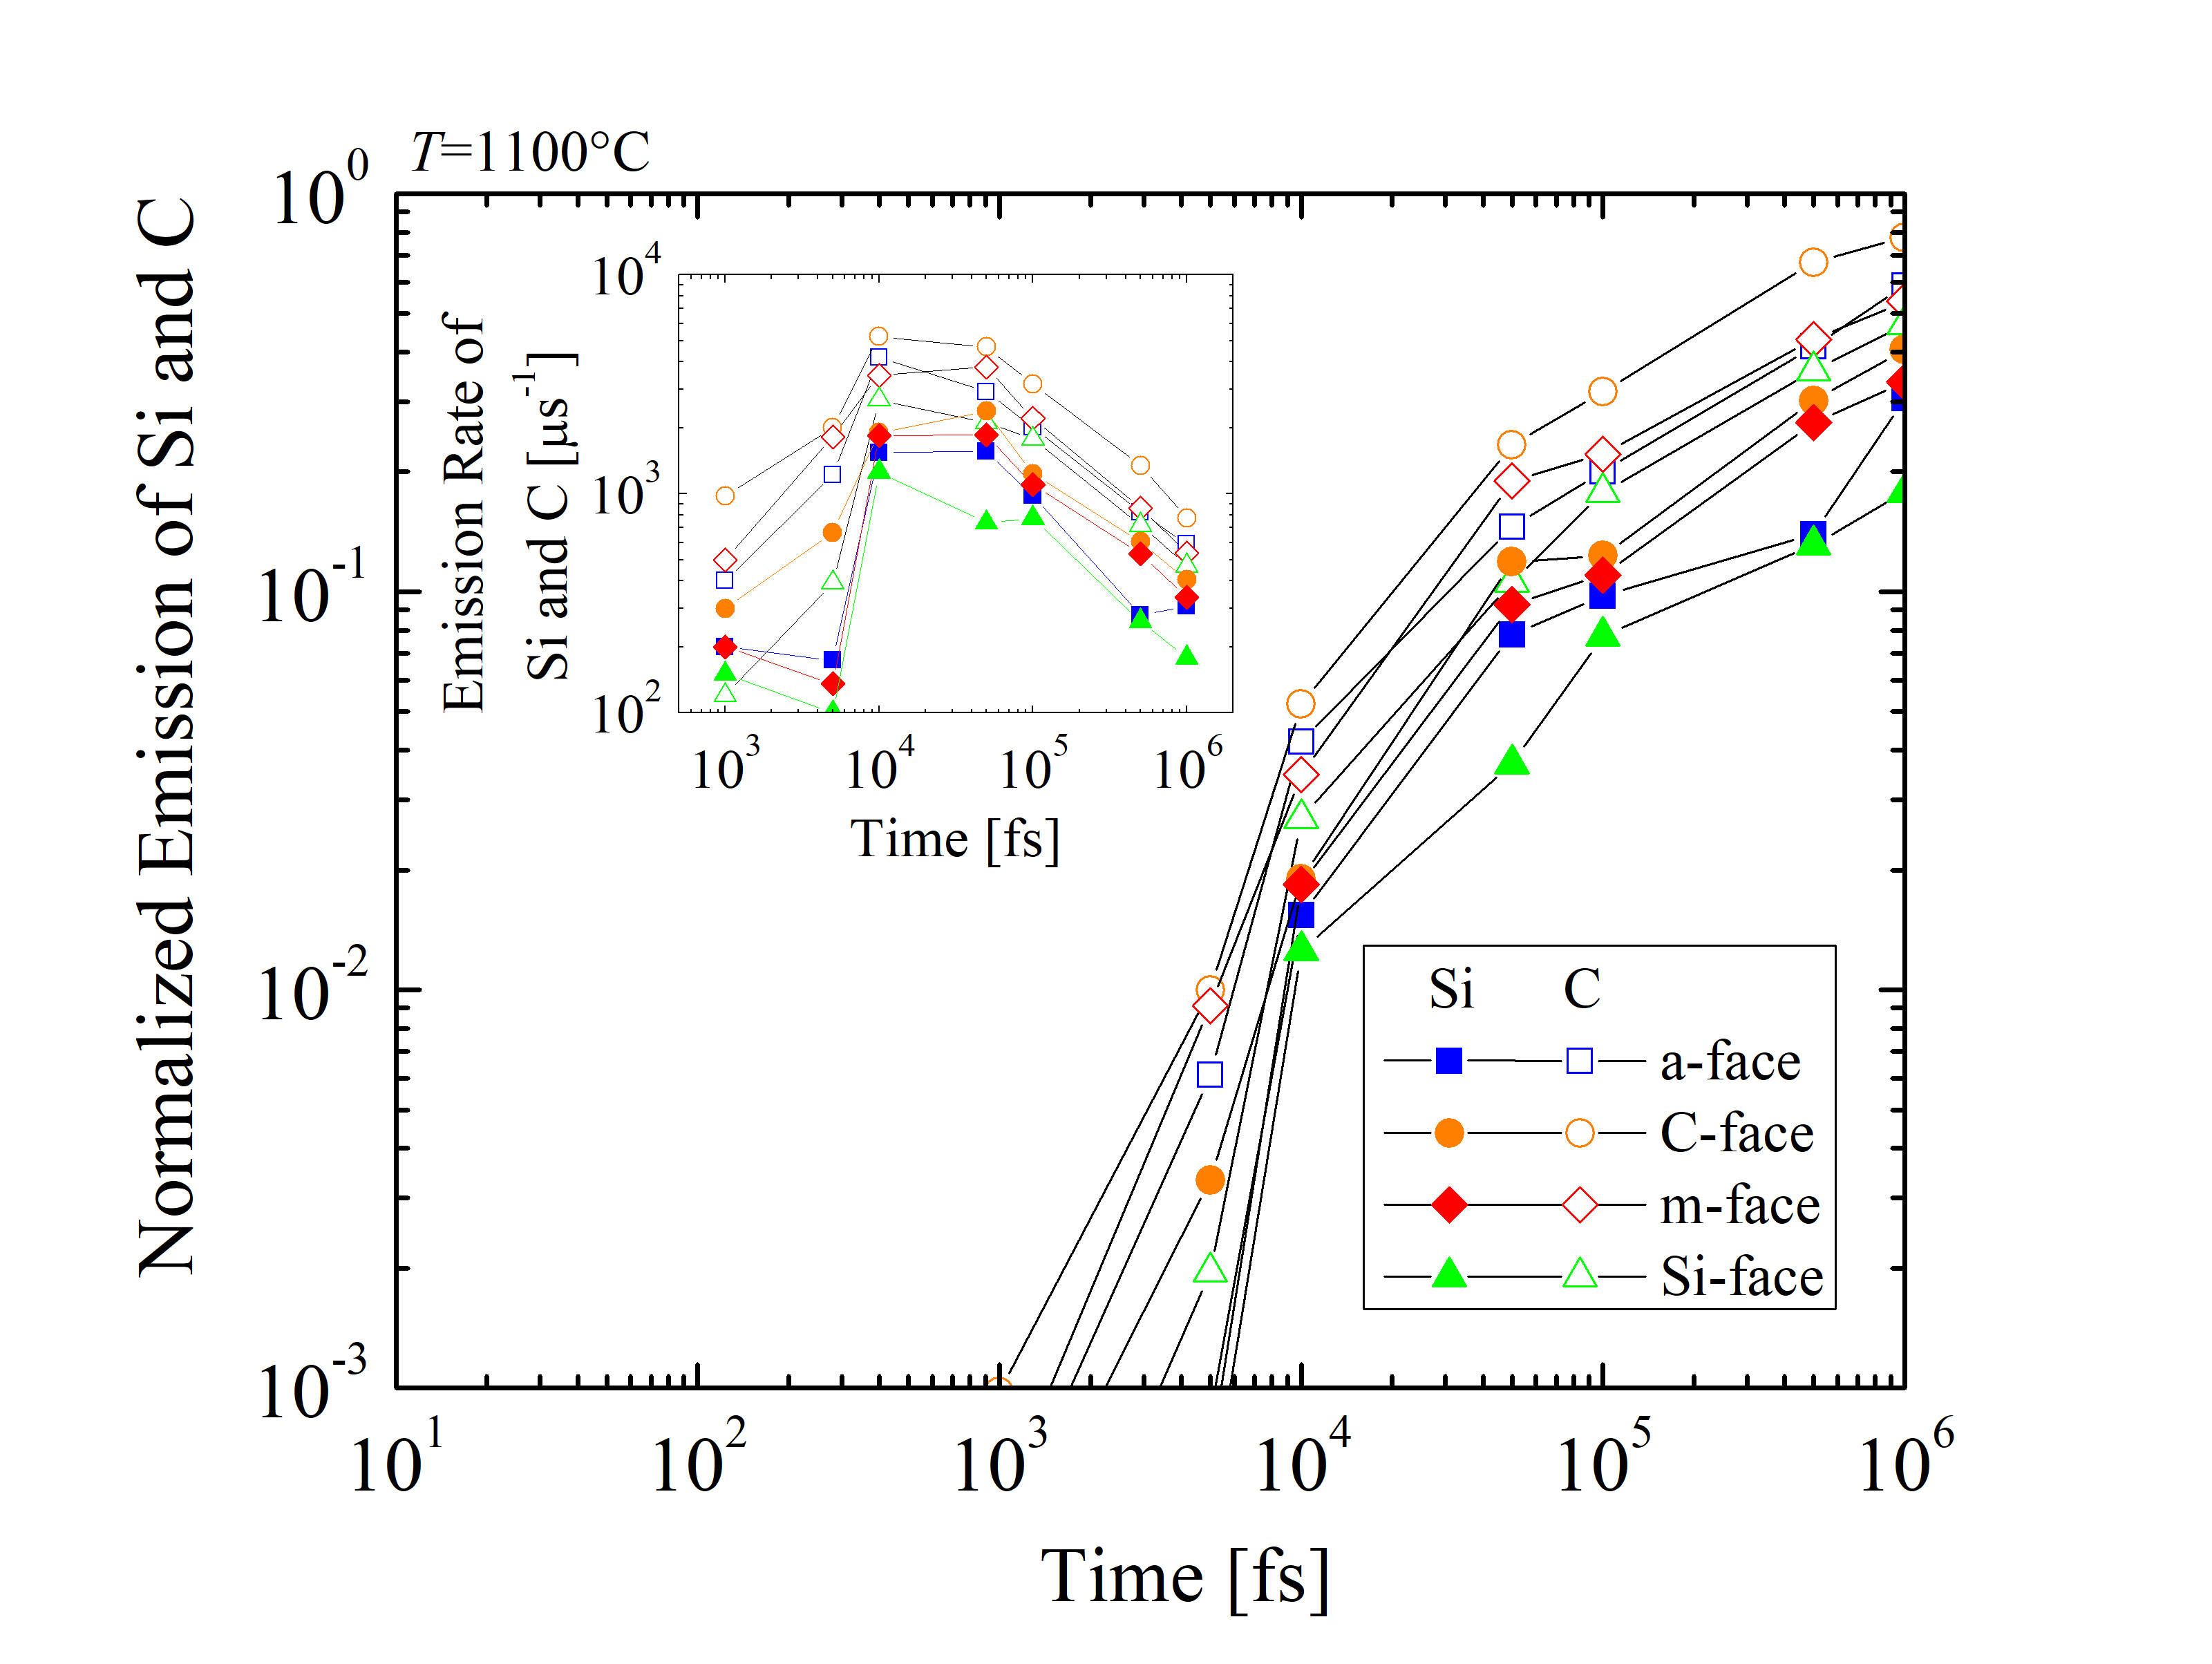
In addition, the emitted Si and C species are normalized as RSi = NSiemitted/NSitot and RC = NCemitted/NCtot, respectively, where Nemitted is the number of emitted and Ntot the total number of Si or C. The time evolution of the normalized emission and the emission rates of Si and C are shown in Figure 2.32. The results suggest differences between the four crystallographic faces and indicate that RC is approximately three times higher than RSi across the whole time scale. An unexpected peak has been observed for the emission rates between 10 and 100 ps, regardless of the crystal orientation. It appears, that at times < 10 ps the oxidation mechanism does not yet require an emission of the Si and C species. On the other hand, for times > 100 ps the emission is considerably decelerated due to the formation of the SiO2 layer. However, the oxidation rate appears not to be limited by the diffusion of the Si and C interstitials, but is limited by the reaction of the surface oxidation.
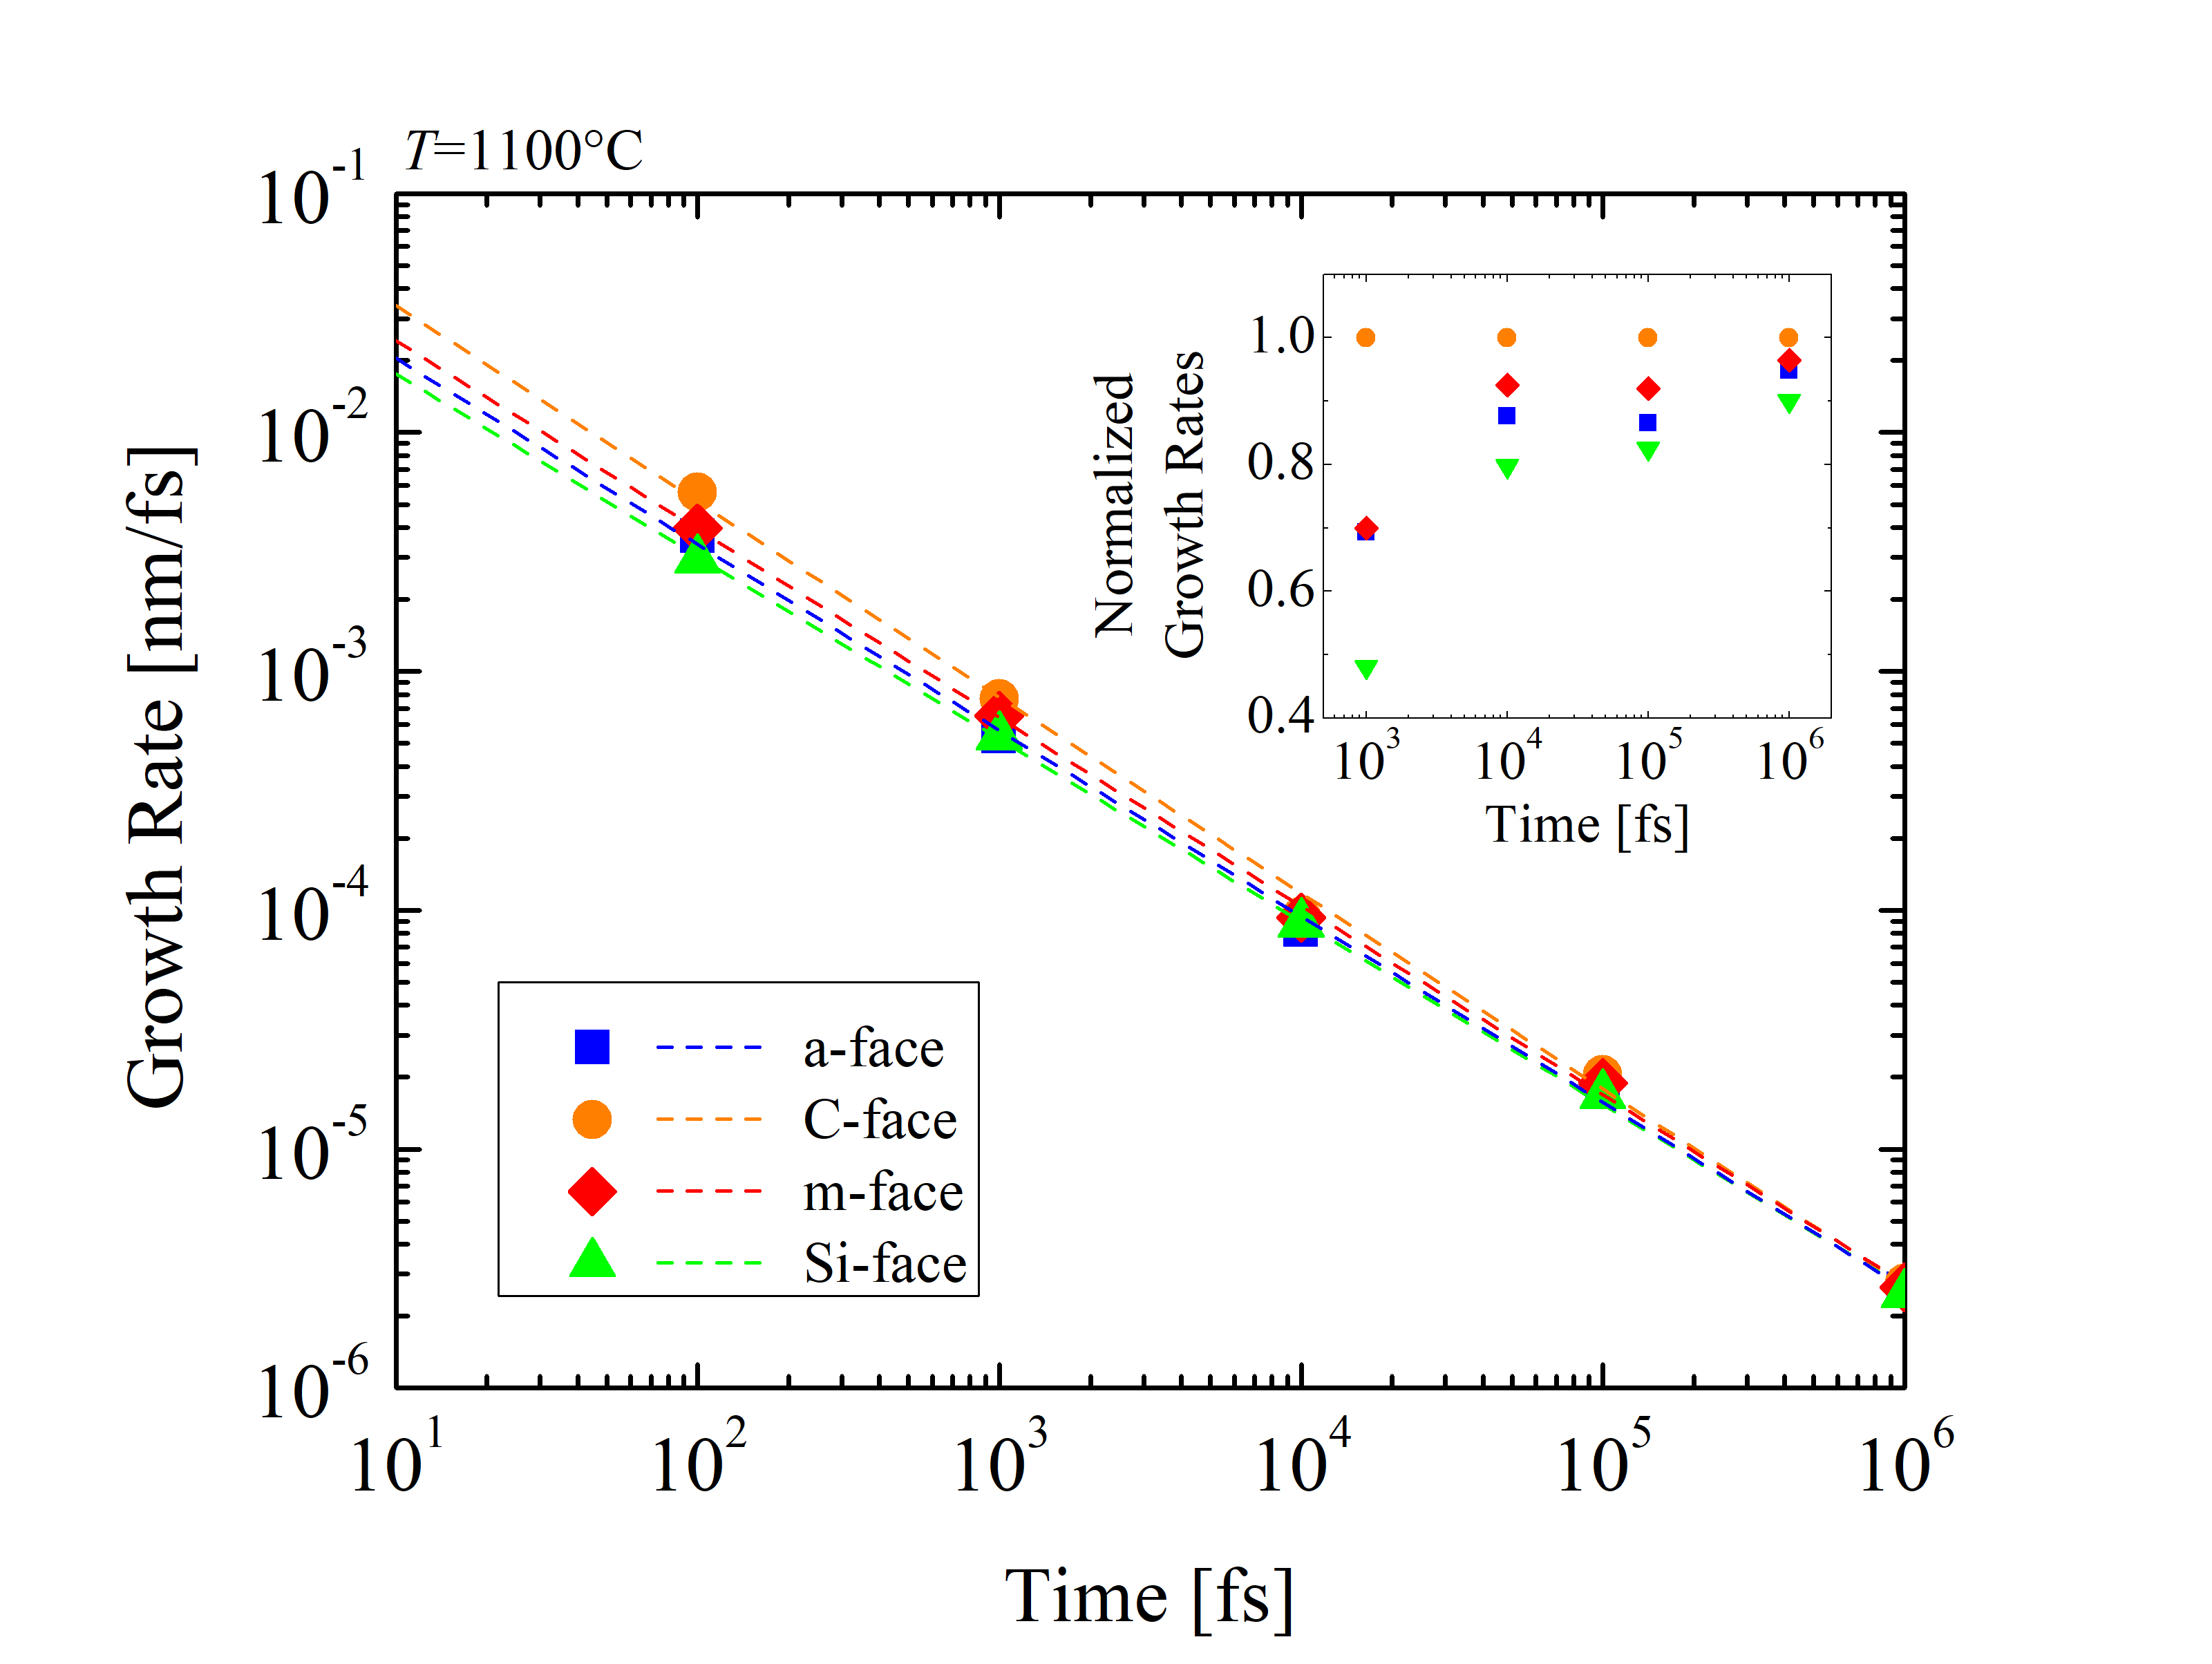
To investigate the orientation-dependent oxidation further, the growth rates of SiC oxidation (dX/dt) [127] are calculated at t = 101, 102, 103, 104, 105, and 106 fs, respectively, as shown in Figure 2.33. It is evident, that the oxidation rate decreases exponentially with time. In fact, the growth rates are extremely high at the beginning, when the oxide layer has not been formed yet due to the absence of rate limiting barriers, such as, e.g., substantial mass transport. Therefore, the rates are comparable with the relative movement of the O2 molecules in air. The orientation dependence of the SiC oxidation is evident during the entire simulation. In particular, the C-face has by far the highest growth rate, followed by the m- and the a-face, and finally the Si-face with the lowest oxidation rate. This sequence is consistent with the currently available macroscopic models [63, 70, 72] and experimental findings [87, 89, 90]. Normalized growth rates show that the orientation dependence is highest at the beginning and decreases with the growing oxide. This implies, that the passivation of the oxidation mechanism due to the in-diffusion of O2 and the out-diffusion of product gases through the grown oxide layer is not orientation-dependent. Goto et al. [70] suggested that the growth rates of the surface oxidation of SiC correspond to the number of Si-C broken bonds, i.e., one Si-C back-bond for the C-face, two Si-C back-bonds for the a-face, and three Si-C back-bonds for the Si-face, yielding growth rate ratios of the C-face : a-face : Si-face close to 1 : 2 : 3. The results for the different crystal structures from the simulations in Figure 2.36 are in agreement with assumptions from macroscopic modeling.
Referring back to Figures 2.29 and 2.30, equivalent ratios between the three faces are observed. On the other hand, the reason for the growth rates for the m-face being 5-10% higher than for the a-face is still not fully understood and should be investigated further. Homo-epitaxial layers of m-face SiC are currently not available, therefore, experimental findings are not available.
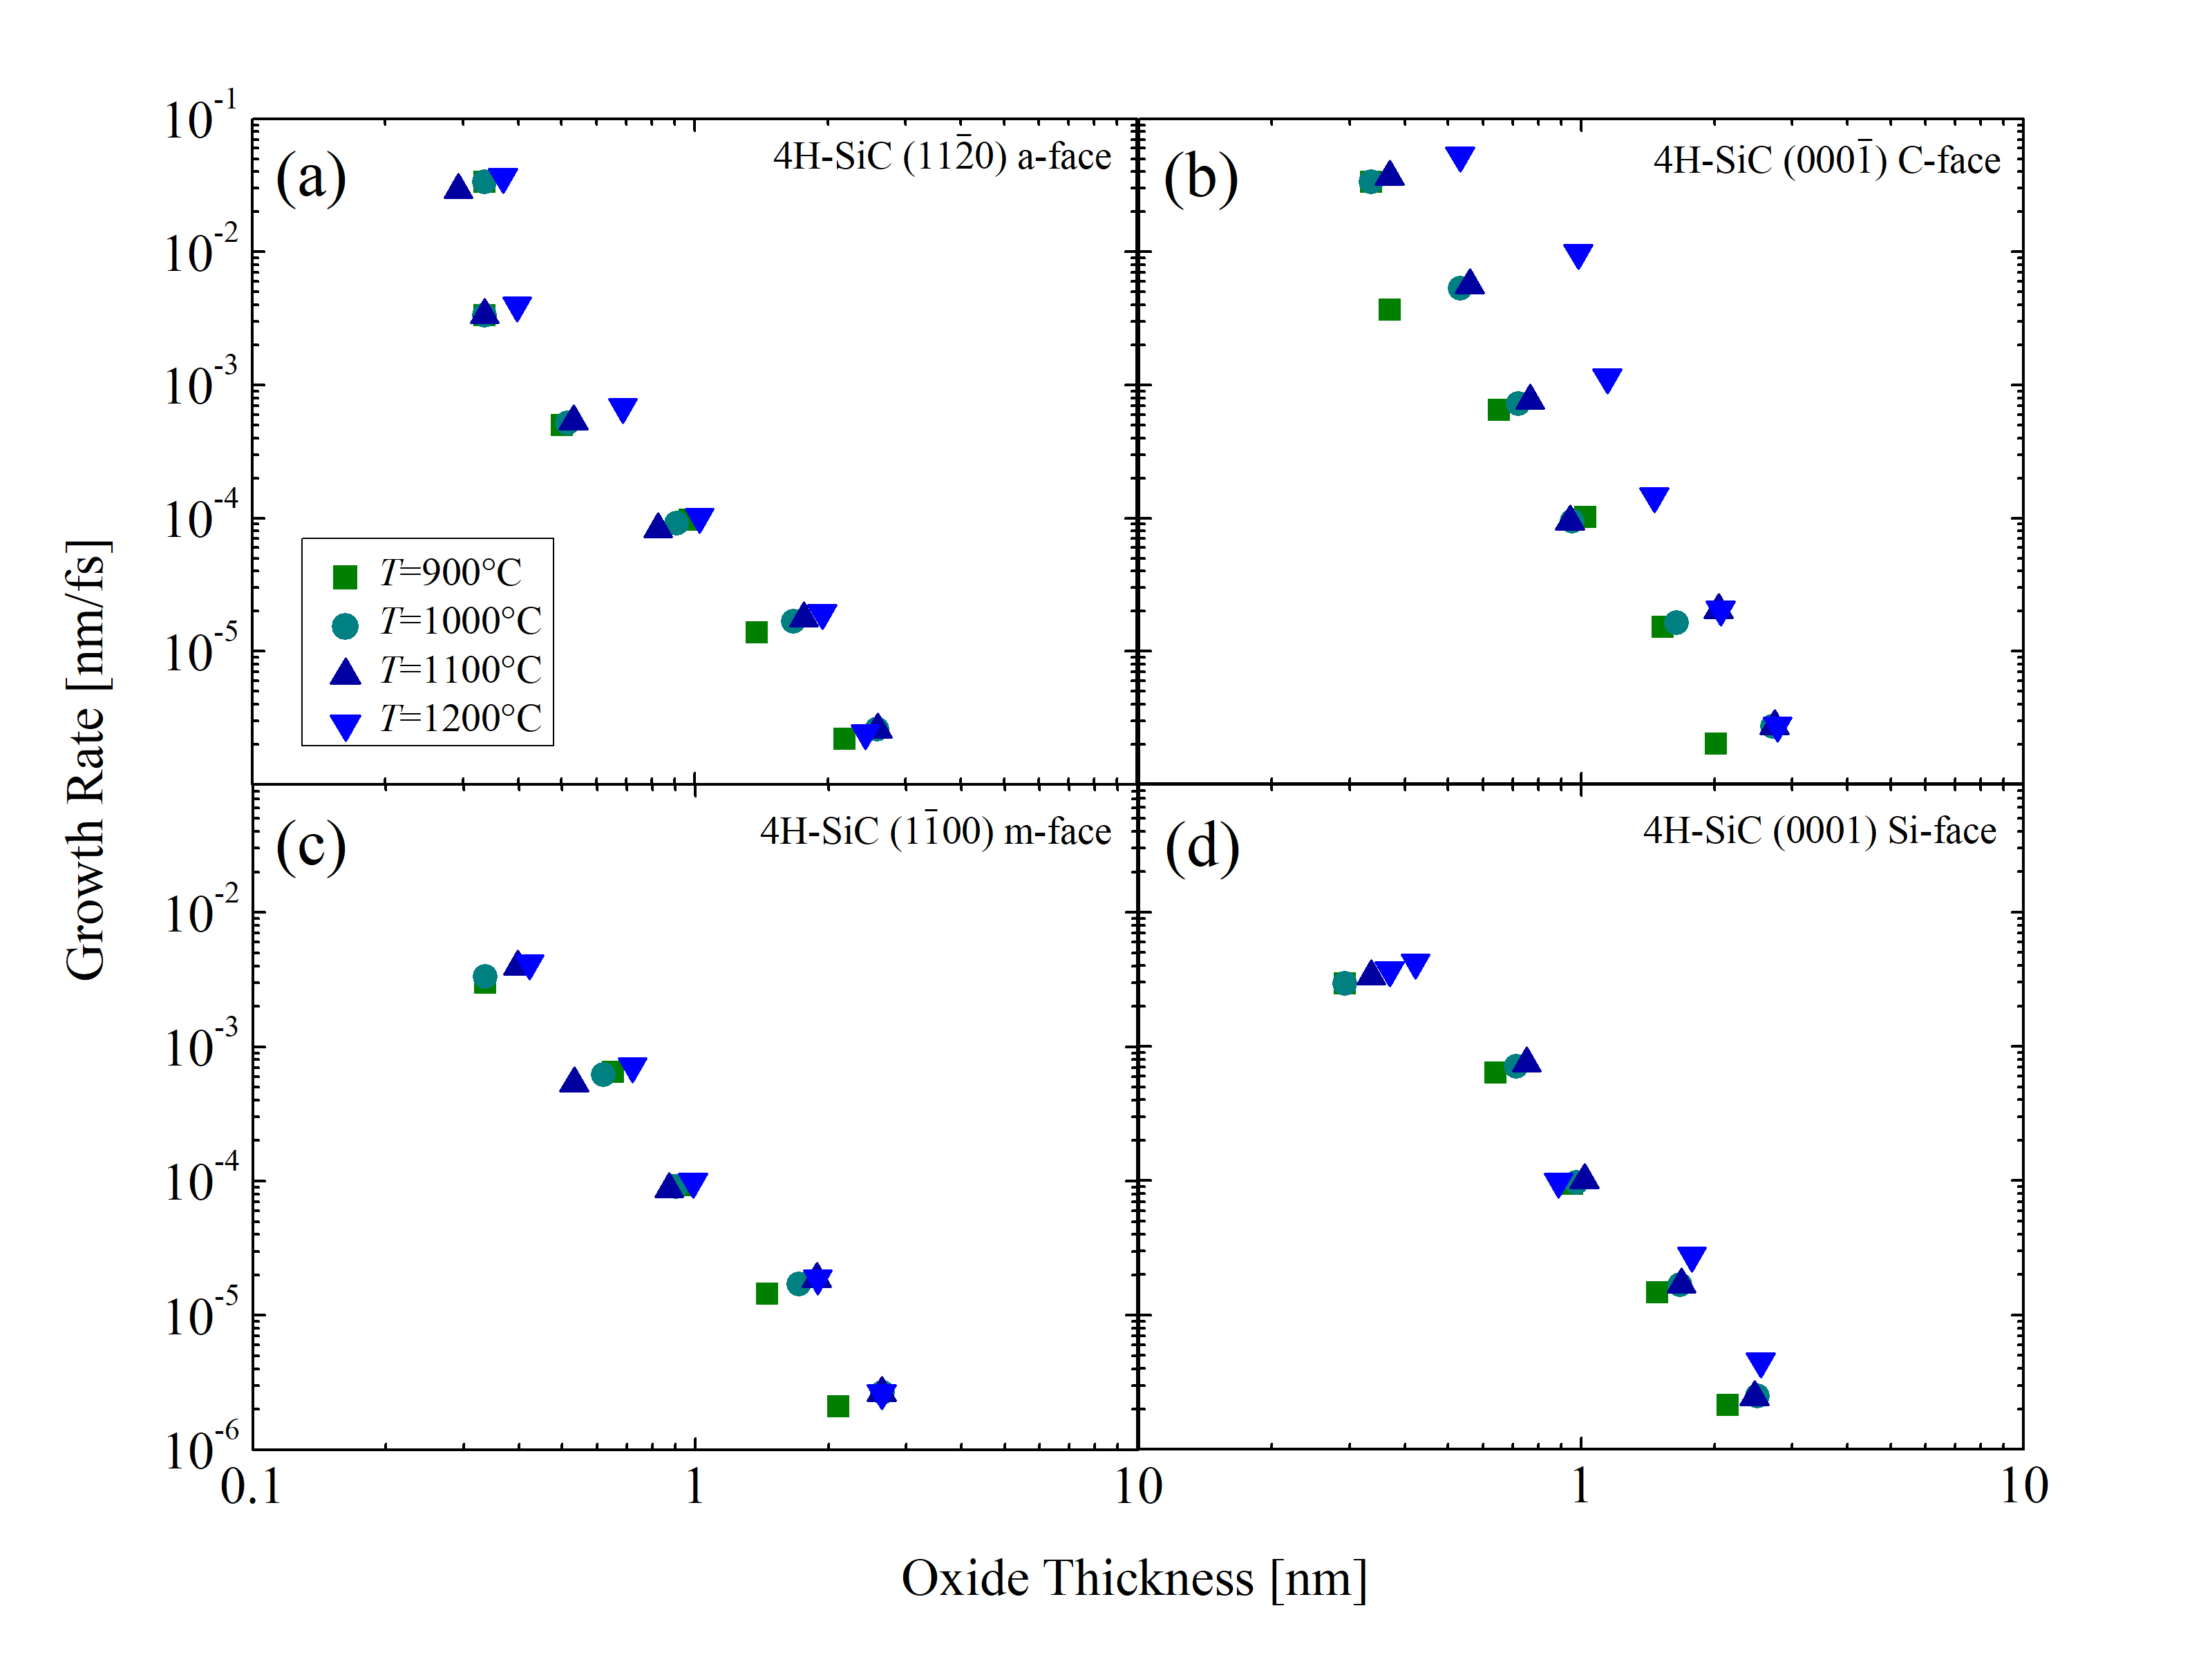
In addition, growth rates as a function of the oxide thicknesses are calculated for temperatures T = 900, 1000, 1100, and 1200°C, shown in Figure 2.34. The results show that the growth rates below 3 nm are extremely high and decrease exponentially. The slopes of the curves do not decrease, which, according to the Si and C emission theory [75], suggests that the surface oxidation is the rate limiting step, rather than the interface oxidation or diffusion. Note, for thin oxides (below 10 nm) the rate-limiting step cannot be exactly determined. Unfortunately, comparing MD results to results from macroscopic models [63, 70, 75] is not possible, as these focus on thicknesses above 10 nm, which is not feasible with current first principles simulation capabilities due to the required simulation times in the regime of several months.
To summarize, the discussed findings prove that MD simulations contribute to the development of orientation-dependent SiC oxidation models [73], which are in turn fundamental for device fabrication simulators, e.g., Silvaco’s Victory Process simulator [53]. As has been pointed out already in several instances, it is crucial for device fabrication modeling to accurately predict oxidation growth of SiC by incorporating the geometry of the oxide. In addition, the presented results promote the advancement of the theory of SiC oxidation. As an outlook, investigations of various oxidation atmospheres, e.g., nitric oxide (NO) [55], are of further interest due to a potentially reduced trap density in SiO2 and other (yet unknown) effects. Finally, a deeper fundamental understanding of the oxidation mechanisms will enable performance improvements of emerging SiC-based devices.