The Bosch process has already been mentioned in Section 4.7.2, when demonstrating the multi-LS framework. A sequence of passivation and etching cycles can be used for high aspect ratio etching. In each cycle a chemically inert polymer layer is uniformly deposited using fluorocarbon gases. This passivation layer prevents the sidewalls from being attacked in the subsequent etching step (compare Figure 4.15).
By feeding a high frequency plasma with etch gases like SF![]() , CF
, CF![]() , or NF
, or NF![]() , a superposition of physical (directional) and chemical (isotropic) etching is obtained. This leads to a faster removal of the passivation layer at the bottom of the trench compared to the sidewalls due to the additional sputtering of the directional ions. After uncovering the substrate at the bottom, chemical etching is dominant. Hence, in simple terms, in each cycle an isotropic etching process is initiated at the bottom of the trench. After many iterations, profiles with high aspect ratios can be obtained. For optimal processing the passivation and etching cycle times must be balanced. If the deposited passivation layer is too thin, the process time for the etching cycle must be smaller to avoid the corrosion of the sidewalls, increasing the number of required iterations. If the layer is too thick, the etching duration must be increased, resulting in a longer total process time. The choice of the process times also has an influence on the undulation of the sidewalls caused by the two-phase procedure. Computer simulations help to study parameter variations in order to optimize the process.
, a superposition of physical (directional) and chemical (isotropic) etching is obtained. This leads to a faster removal of the passivation layer at the bottom of the trench compared to the sidewalls due to the additional sputtering of the directional ions. After uncovering the substrate at the bottom, chemical etching is dominant. Hence, in simple terms, in each cycle an isotropic etching process is initiated at the bottom of the trench. After many iterations, profiles with high aspect ratios can be obtained. For optimal processing the passivation and etching cycle times must be balanced. If the deposited passivation layer is too thin, the process time for the etching cycle must be smaller to avoid the corrosion of the sidewalls, increasing the number of required iterations. If the layer is too thick, the etching duration must be increased, resulting in a longer total process time. The choice of the process times also has an influence on the undulation of the sidewalls caused by the two-phase procedure. Computer simulations help to study parameter variations in order to optimize the process.
A two-dimensional simulator using a cell-based method for surface evolution was presented in [137,138]. Therein a simplified model for the particle transport is used. Etching is modeled by an isotropic etch rate superposed by a directional term which is proportional to the incident ion flux. For the passivation cycle a perfect conformal deposition is assumed, which is equivalent to a constant surface velocity. However, this model is not able to describe the lag effect [35] appropriately. Therefore, a geometric shape factor was introduced [128] to account for different trench widths.
A simulation with a more sophisticated transport model is presented in [63], where different sticking probabilities and higher order reemissions of neutral particles are incorporated using a ballistic transport and reaction model [20,21]. Since the transport of neutrals to the surface is taken into account, the lag effect is inherently incorporated. The surface evolution is calculated using the LS method, while the particle transport is computed using the conventional approach [62]. The MC based calculation of the particle transport was first applied to Bosch process simulation in combination with a cell-based method for surface evolution in [116]. Many particle trajectories and their surface reactions are calculated to determine the surface rates.
Three-dimensional simulations of the Bosch process were recently reported in [43] and [125]. Both use simplified transport models and do not incorporate higher order reemissions of neutrals. Instead, a uniform surface rate is assumed. The particle transport is calculated using conventional integral methods. For surface evolution, a cell-based method and the LS method are used, respectively.
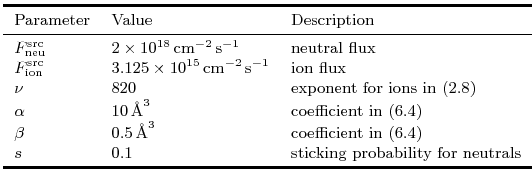
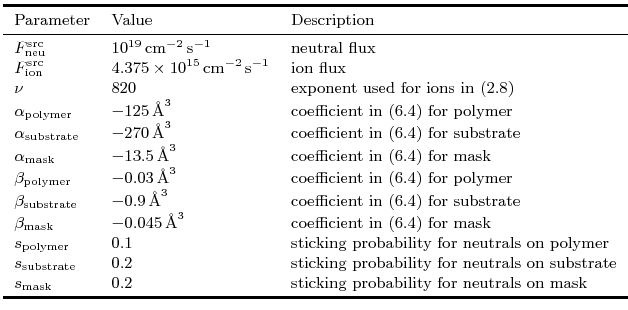
The numerical methods presented in the previous chapters allow an efficient solution of the more realistic model described in [63] even in three dimensions. The model assumes linear surface reactions for the passivation and the etching cycle (see Section 2.3.1)