5.2.3 Simulation Results
The first goal of this study was to understand the reasons for the stress discrepancy between
the TSV and the full-plate samples. Therefore, the following configurations were considered
for simulation: TSV without scallops, TSV with scallops, and TSV with weak adhesion. The
first case was performed to control the hypothesis, whereas the other two cases were used for
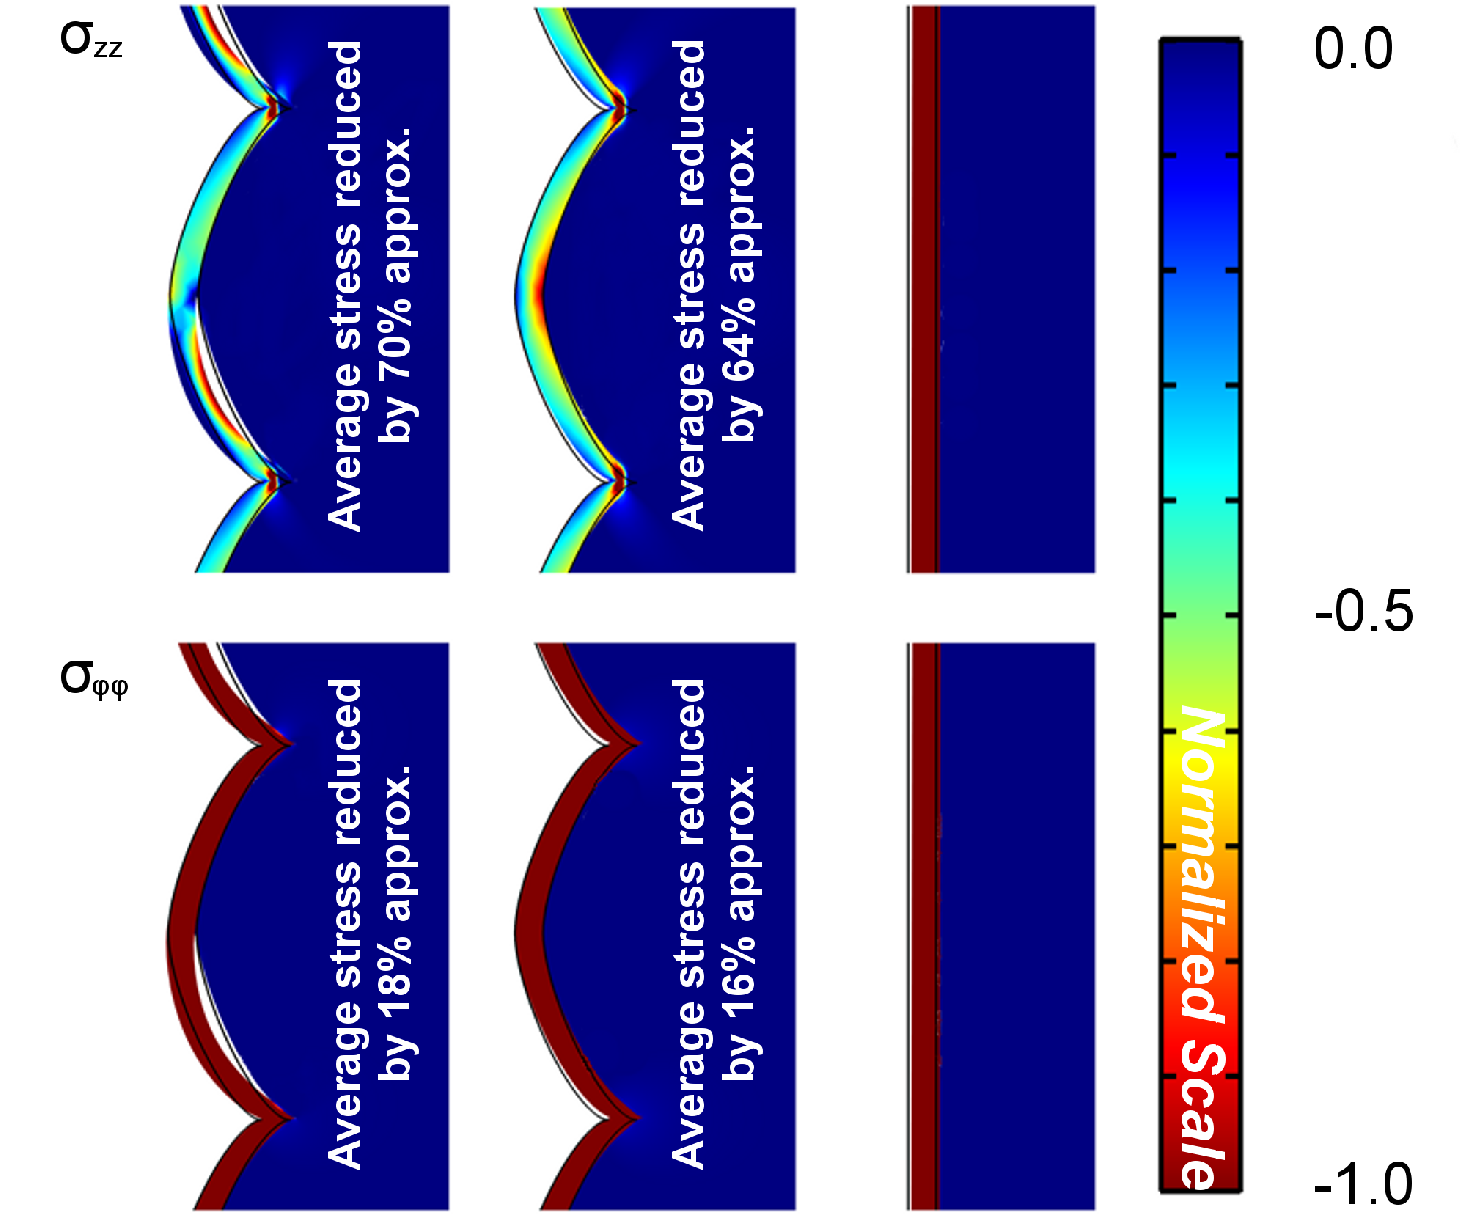
an evaluation of each particular feature on stress. The geometry of the scallops has
been identified as the main cause for stress reduction inside the tungsten layer, as
shown in Fig. 5.7. Although the weak adhesion has introduced some relaxation
( 17%), it superimposes to a stress state already reduced by the geometry. Moreover,
the in-plane stress on tungsten is not equal in every direction in the presence of
scallops. Krauss et al. were unaware of this fact during their measurements and
assumed an in-plane equibiaxial condition for the stress [85]. Nevertheless, this
possibility is discussed in their work. Consequently, the reported stress by Krauss et al.
does not fully characterize the state in the tungsten layer, but rather the average
normal stress in the vertical direction, according to their described experimental
setup.
17%), it superimposes to a stress state already reduced by the geometry. Moreover,
the in-plane stress on tungsten is not equal in every direction in the presence of
scallops. Krauss et al. were unaware of this fact during their measurements and
assumed an in-plane equibiaxial condition for the stress [85]. Nevertheless, this
possibility is discussed in their work. Consequently, the reported stress by Krauss et al.
does not fully characterize the state in the tungsten layer, but rather the average
normal stress in the vertical direction, according to their described experimental
setup.
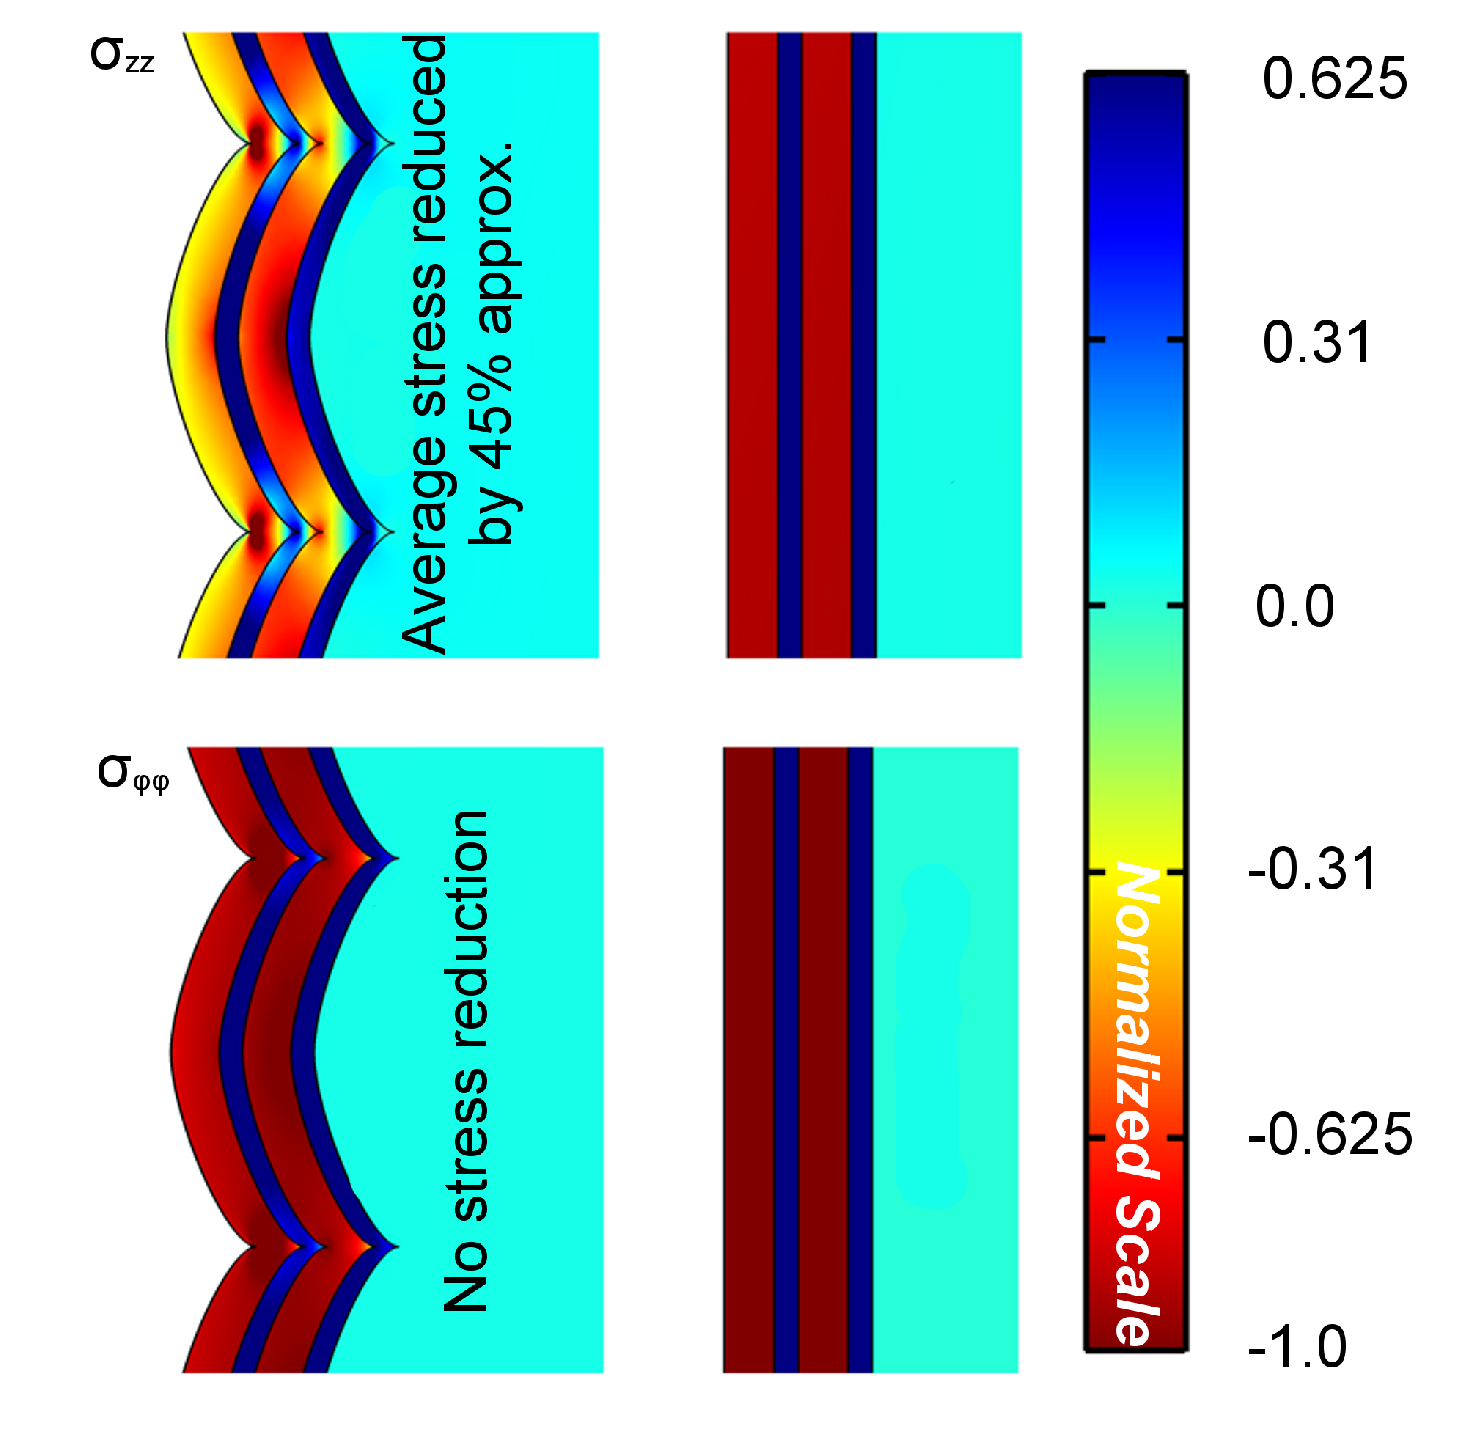
The double stack structure was simulated under the same conditions as the single stack,
except that the weak adhesion case was not considered, as shown in Fig. 5.8. Since the
equibiaxial stress assumption is not valid in the presence of scallops, the simulated and
experimental stress results have not been compared. Instead, the strain was compared,
which is a direct measure and free of any assumptions.
The average simulated strain of 0.00169 in the vertical direction was in reasonable
agreement with the measured strain of 0.00111 [85] for the tungsten layer. The intrinsic
stress on the Ti/TiN layers was ignored due to the lack of experimental data.
However, simulations considering a compressive stress in the Ti/TiN layers resulted
in an average strain of 0.00127 in the tungsten layer. Hence, the absence of the
intrinsic stress on Ti/TiN can justify the difference between simulated and observed
values.
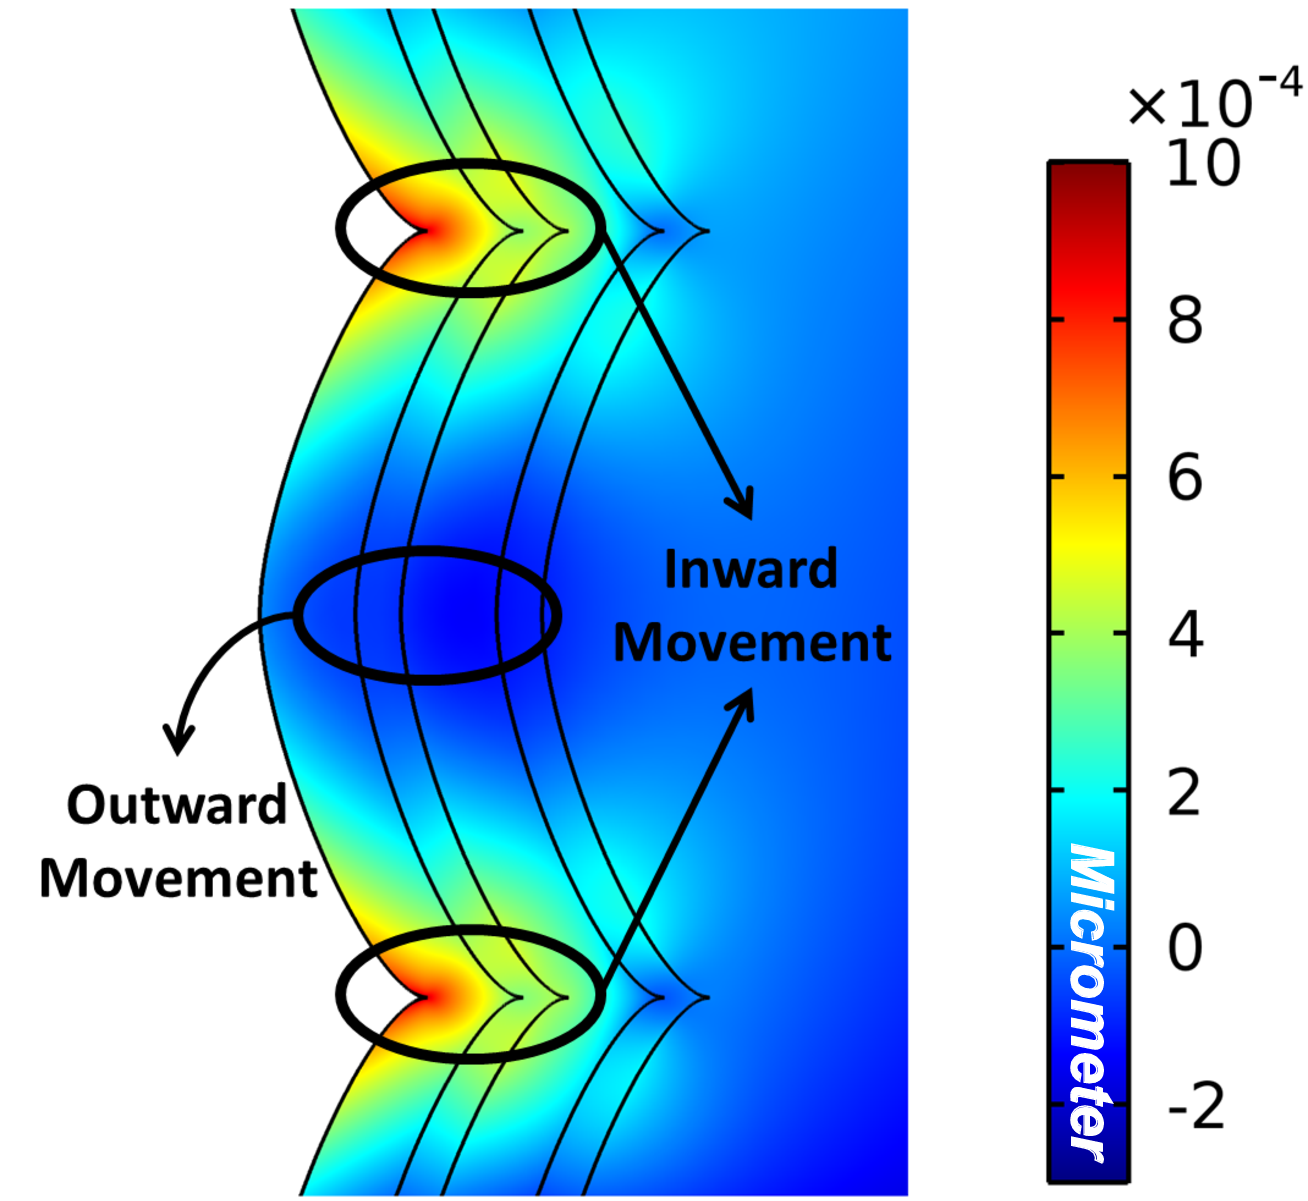
The rigidity characteristic of the scallops in the vertical direction modifies the stress
distribution on TSV films. The tensile stress induces an inward movement in the region of
valleys between scallops, shown in Fig. 5.9. This leads to a relief of the stress along the via,
since the material finds a favorable point to stretch. Consequently, the average normal stress
in the vertical direction in tungsten is reduced, causing the difference between TSV
and full-plate samples. However, in the tangential direction there is almost no
stress reduction. Along this axis the geometry is not modified by the scallops.
Therefore, the initial load faces a similar scenario in the presence or absence of
scallops.
Additional insight concerning reliability is gathered from an analysis of the von Mises stress.
The mean values for structures with and without scallops are very similar and no significant
difference was detected. Hence, the full-plate sample measurements could be used safely to
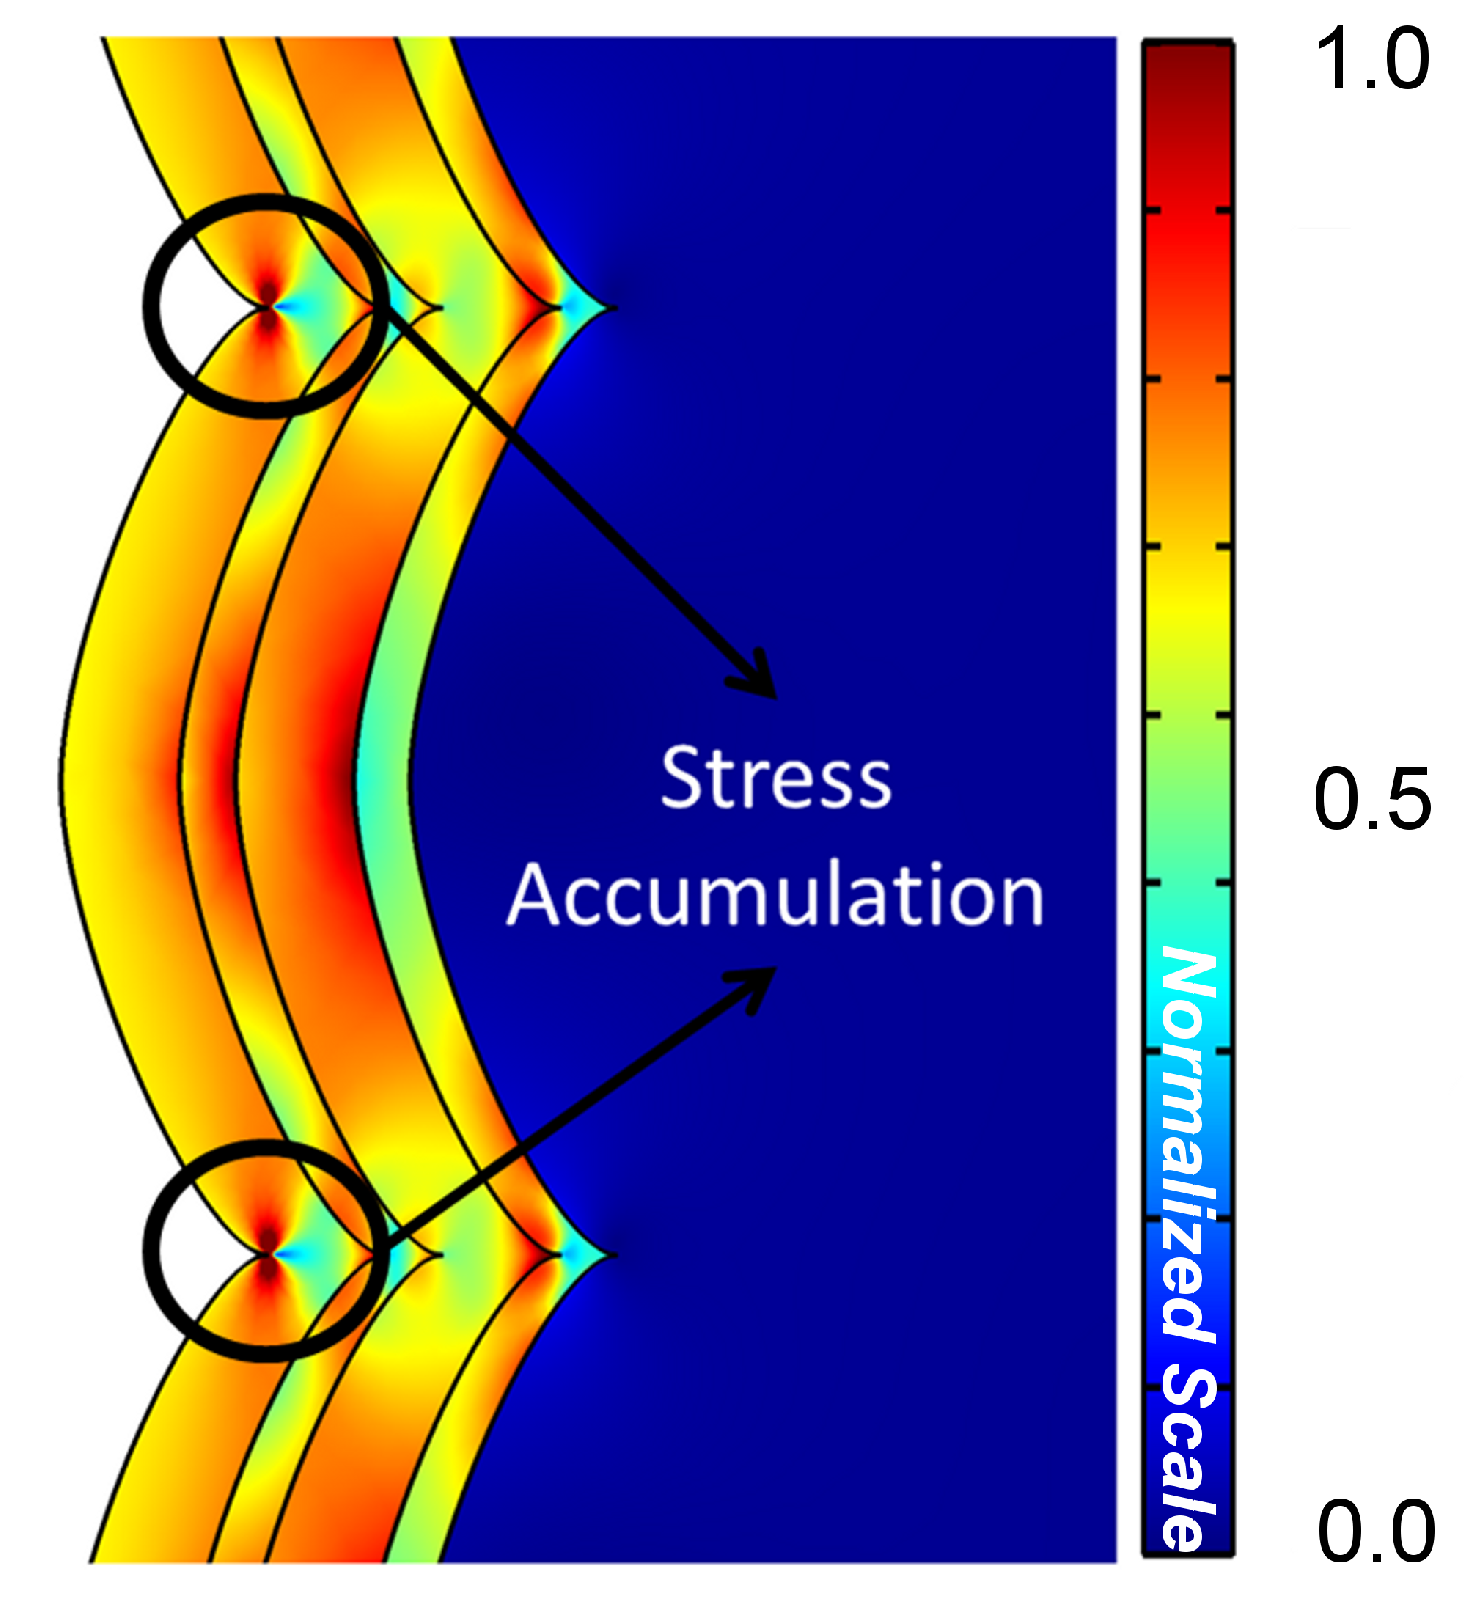
determine the average von Mises stress. However, the mean value of the von Mises
stress did not suffice when the scallops were present due to the modified stress
distribution. Fig. 5.10 outlines the accumulation stress points. The von Mises
stress can reach peaks of stress up to 3 times higher than those experienced on
full-plate samples. However, such high values could be the result of the sharp
transition between the Bézier curves used to represent the scallops (singularity points).
Even if the sharp transitions, observed with Bézier curves, were removed, there is
still a pinched transition region between scallops. There, points of pinch-off are
a region of potential failure, as increased stress could lead to a fracture in the
metal.
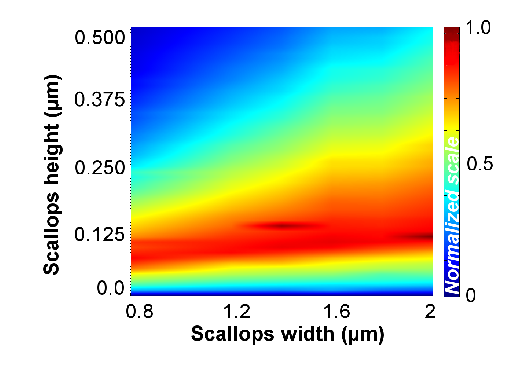
Regarding scallop dimensions, the stress magnitude behavior depends on the scallops height
and width, as shown in Fig. 5.11. As the height increases, the stress increases very rapidly
until a peak is reached, then it drops slowly toward a saturation value. For small heights
most of the scallop still retains its flat geometry, impeding material expansion and leading
to an increased stress. This scenario persists until the scallop reaches a height which favors
the curvy geometry and material expansion (flat characteristic is no longer dominant),
resulting in stress relaxation. The peak stress in Fig. 5.11 is defined by this change in the
scallop geometry. As the scallops’ widths are increased, the peaks broaden with a
linear dependence, both in height and width directions. This peak movement is a
consequence of the fact that wide scallops need higher heights to lose their flat
behavior.