![\includegraphics[width=0.3\textwidth]{figures/site-binding-model.ps}](img742.png)
|
The Gouy-Chapman-Stern model describes the main contributions to the electric double layer. It relates the accumulated charge at the surface of the electrochemical interface to the applied potential. Despite the accurate description of the electrostatic interactions, there is no chemical interaction included in the model. Chemical reactions at the interface can lead to a net charge presence at the insulator's interface[198]. In this section the site-binding model will be investigated, allowing to include chemical processes at the insulator interface in the description. The inability of the regular double layer model to predict the correct net charge density in the electrolyte, shows the need for embracing chemical reactions at the interface with the site-binding model.
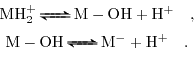
Unlike for electrostatic forces which act over long ranges, chemical reactions only occur within molecular distances. Therefore the assumption that chemical reactions are only possible within the OHP is chosen. Firstly, ionic species from the dissolved salt hold a water shell and cannot come closer to the interface than the OHP. Therefore, ions cannot contribute to the chemical reactions at the insulator interface (neglecting the possibility of specific adsorbtion of salt ions). Secondly, the much smaller hydrogen ions are not blocked by the OHP, due to their much smaller ionic radius and being not hydrated. They can approach the interface close enough to enable chemical reactions. As depicted in Fig. 5.3 the surface of an insulator inhabits a huge amount of unsaturated bonds. Neglecting unspecific adsorbtion, the only ions capable of bonding these sites are the hydrogen and hydroxyl ions [196,197,198], because they are not shielded by water layers. The following chemical reactions are dynamically balanced in the membrane, under the assumption of thermal equilibrium and without any net reaction5.3:
Calculating the surface charge from (5.17) one has to take care not to proceed with the bulk hydrogen concentrations. Since the surface potential is different from the bulk potential and the chemical reactions also take place directly at the surface, the ionic charge population of hydrogen at the surface is expected to be different from the bulk hydrogen concentration as well. Therefore, the activity of hydrogen should be used rather than the bulk hydrogen concentration. If the only affecting forces are of electrostatic nature, the activity of hydrogen can be formulated like in (5.15) and can be expressed for the positive hydrogen ions as:
| (5.19) |
One may have wondered, why the hydrogen distribution is considered via the Boltzmann type terms at the interface within the site-binding region, while outside the OHP in the electric double layer the charge distribution of the salt ions is taken into account and the hydrogen distribution is neglected. This apparent contradiction can be resolved as follows:
At the oxide surface the hydrogen concentration has a strong influence on the equilibrium constants for the reactions (5.17), while the hydrogen diffusive layer is much smaller than the ion diffusive layer. In a relatively dilute solution containing
![]() of
of ![]() , the salt is completely dissolved into
, the salt is completely dissolved into
![]()
![]() and
and
![]()
![]() . Assuming a pH of
. Assuming a pH of ![]() , the hydrogen concentration in the electrolyte will be about
, the hydrogen concentration in the electrolyte will be about
![]() . This shows that the concentration difference between the hydrogen and the sodium is four orders of magnitude. Therefore, the hydrogen diffusive double layer has a negligible influence on the potential in the Gouy-Chapman layer compared to the site-binding region of the electrolyte.
. This shows that the concentration difference between the hydrogen and the sodium is four orders of magnitude. Therefore, the hydrogen diffusive double layer has a negligible influence on the potential in the Gouy-Chapman layer compared to the site-binding region of the electrolyte.
|
|
![\begin{displaymath}\begin{array}{ccc} K_{a}&=&\frac{\left[\mathrm{M-OH}\right] \...
...hrm{H}^{+}\right]}{\left[\mathrm{M-OH}\right]}\quad.\end{array}\end{displaymath}](img744.png)
![$\displaystyle \sigma_{\mathrm{Ox}}=q N_{s}\,\frac{\frac{\left[\mathrm{H}^{+}\ri...
...left[\mathrm{H}^{+}\right]_{b}}\,e^{\frac{q \psi_{0}}{q k_{\text{B}} T}}}\quad.$](img748.png)