6.2 Standard Model of Kirton and Uren
Since the McWhorter model suffers from a weak temperature dependence of  and small time constants, Kirton and Uren [56] incorporated field-independent
barriers
and small time constants, Kirton and Uren [56] incorporated field-independent
barriers  in the cross sections
  and
and  (see Section 2.5). The ‘ad
hoc’ introduction of these barriers has been motivated by the theory of nonradiative
multi-phonon transitions (NMP) process [115]. However, Kirton and Uren have not
provided a detailed theoretical derivation based on this NMP theory. Nevertheless,
their work is regarded as a substantial improvement in the interpretation of charge
trapping at semiconductor-oxide interfaces and thus also referred to as the standard
model throughout this thesis. In an extended version of the McWhorter
model, the holes can also be captured by traps with an energy below the
substrate valence band. As illustrated in Fig. 2.5 of Section 2.5.2, the required
barriers consist of two components, namely
(see Section 2.5). The ‘ad
hoc’ introduction of these barriers has been motivated by the theory of nonradiative
multi-phonon transitions (NMP) process [115]. However, Kirton and Uren have not
provided a detailed theoretical derivation based on this NMP theory. Nevertheless,
their work is regarded as a substantial improvement in the interpretation of charge
trapping at semiconductor-oxide interfaces and thus also referred to as the standard
model throughout this thesis. In an extended version of the McWhorter
model, the holes can also be captured by traps with an energy below the
substrate valence band. As illustrated in Fig. 2.5 of Section 2.5.2, the required
barriers consist of two components, namely  and
and  . The latter is
the required minimum energy for a hole capture process while
. The latter is
the required minimum energy for a hole capture process while  is
the barrier component which must be overcome for hole capture as well
as emission. In this variant, the capture and emission time constants read
is
the barrier component which must be overcome for hole capture as well
as emission. In this variant, the capture and emission time constants read
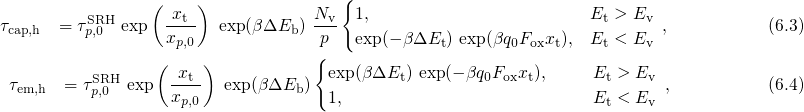
where the traps are not restricted to lie within the bandgap. Its behavior with
respect to the temperature and the oxide field is illustrated in Fig. 6.1 and evaluated
based on the TDDS checklist in Table 6.1. When the trap level lies below the valence
band edge ( ),
),  shows an exponential field dependence, which is
superimposed by a sharp peak due to a drop of the hole concentration at weak
oxide fields. Comparing the model to the experimental TDDS data (see
Section 1.3.4), this exponential behavior allows for reasonable and approximative fits
to
shows an exponential field dependence, which is
superimposed by a sharp peak due to a drop of the hole concentration at weak
oxide fields. Comparing the model to the experimental TDDS data (see
Section 1.3.4), this exponential behavior allows for reasonable and approximative fits
to  but it is incompatible with the observed curvature in
  .
Furthermore, the model predicts
.
Furthermore, the model predicts  to be field insensitive for
  according to the equations (6.4). It should be mentioned at this point that the
derivation of the analytical expression (6.3) and (6.4) is based on Boltzmann
statistics, leading to small deviations in
according to the equations (6.4). It should be mentioned at this point that the
derivation of the analytical expression (6.3) and (6.4) is based on Boltzmann
statistics, leading to small deviations in  and
and  compared to the
simulations of Fig. 6.1 (left) using Fermi-Dirac statistics. The weak field
dependence of the simulated
compared to the
simulations of Fig. 6.1 (left) using Fermi-Dirac statistics. The weak field
dependence of the simulated  reasonably agrees with the behavior
of ‘normal’ (constant emission times) but is inconsistent with as well as
‘anomalous’ traps (a drop at weak oxide fields). Nevertheless, Fig. 6.1 reveals that
the introduction of
reasonably agrees with the behavior
of ‘normal’ (constant emission times) but is inconsistent with as well as
‘anomalous’ traps (a drop at weak oxide fields). Nevertheless, Fig. 6.1 reveals that
the introduction of  yields the required temperature activation and
larger time constants in agreement with the points (ii) and (v) of the TDDS
findings.
yields the required temperature activation and
larger time constants in agreement with the points (ii) and (v) of the TDDS
findings.
A fit of the Kirton model to the experimental TDDS data is presented in Fig. 6.2.
Although the model can reproduce some features seen in the TDDS data, except
for the curvature in  , no reasonable agreement with the measurement
data could be achieved. This discrepancy can be explained as follows: The
exponential bias dependence extends up to a voltage
, no reasonable agreement with the measurement
data could be achieved. This discrepancy can be explained as follows: The
exponential bias dependence extends up to a voltage  at which
  coincides with
  . In Fig. 6.2 (left)
  is approximately
  so
that
so
that  shows an exponential bias dependence up to this value and
becomes constant afterwards. Therefore,
shows an exponential bias dependence up to this value and
becomes constant afterwards. Therefore,  must be chosen such that
  lies above the voltage range used in the measurements. This is only the
case for defects whose trap levels
lies above the voltage range used in the measurements. This is only the
case for defects whose trap levels  are situated sufficiently low. Note
that those defects are also characterized by a large
are situated sufficiently low. Note
that those defects are also characterized by a large  , which marks the
voltage where
, which marks the
voltage where  coincides with
  . After equation (2.66), their
  must equal their
  at
at  , visible as the crossings between
  and
and  in Fig. 6.2. At a low gate bias, their trap levels are moved far
below
in Fig. 6.2. At a low gate bias, their trap levels are moved far
below  so that their emission times fall several orders of magnitude below
their corresponding capture time constants. The large difference between
so that their emission times fall several orders of magnitude below
their corresponding capture time constants. The large difference between
 and
and  predicted by the Kirton model is inconsistent with the
experimental TDDS data. Additionally, a fit of the Kirton model to
predicted by the Kirton model is inconsistent with the
experimental TDDS data. Additionally, a fit of the Kirton model to  is
presented in Fig. 6.1 (right). It clearly shows that the simulated
is
presented in Fig. 6.1 (right). It clearly shows that the simulated  fails to
reproduce the experimentally obtained
fails to
reproduce the experimentally obtained  when a good match with
  is
achieved.
is
achieved.
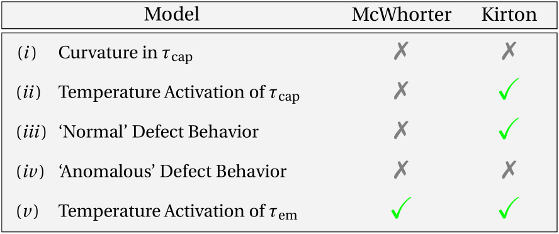
Table 6.1: Checklist for a TDDS defect. The individual criteria stem from the
TDDS data addressed in Section 1.3.4. The McWhorter as well as the Kirton
model do not fulfill all criteria and thus do not describe the defects seen in
TDDS experiments.
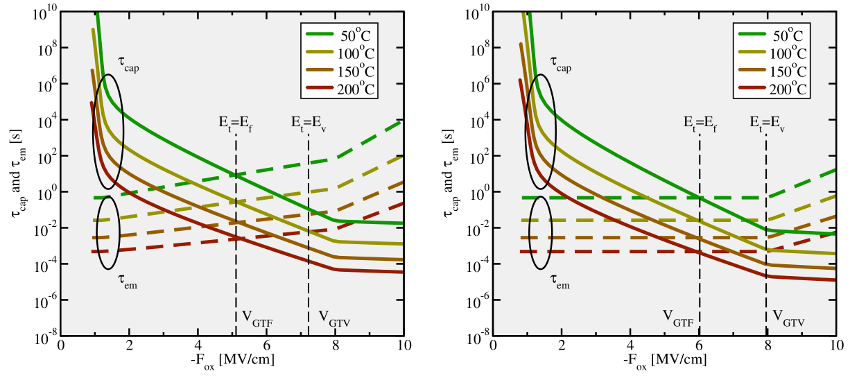
 are plotted as solid lines, while the
  are
depicted by dashed lines. The vertical dashed lines mark the values of
are
depicted by dashed lines. The vertical dashed lines mark the values of  or
or
 when the trap level
  passes either the Fermi level or the valence band
edge in the substrate, respectively. Equation (
passes either the Fermi level or the valence band
edge in the substrate, respectively. Equation ( remains constant in the region
  as
shown in the right figure. Using more accurate Fermi-Dirac statistics the
emission time constants are subject to a weak field dependence (cf. left figure).
On the logarithmic scale, the
as
shown in the right figure. Using more accurate Fermi-Dirac statistics the
emission time constants are subject to a weak field dependence (cf. left figure).
On the logarithmic scale, the  follow a linear behavior in
  over a wide
range but do not have the same curvature as present in the TDDS data. The
over a wide
range but do not have the same curvature as present in the TDDS data. The
 show neither a plateau nor a drop towards weak fields. Compared to the
McWhorter model,
show neither a plateau nor a drop towards weak fields. Compared to the
McWhorter model,  and
and  exhibit a clear temperature activation
over the whole range of oxide fields so that their values are moved to larger time
scales relevant for NBTI.
exhibit a clear temperature activation
over the whole range of oxide fields so that their values are moved to larger time
scales relevant for NBTI.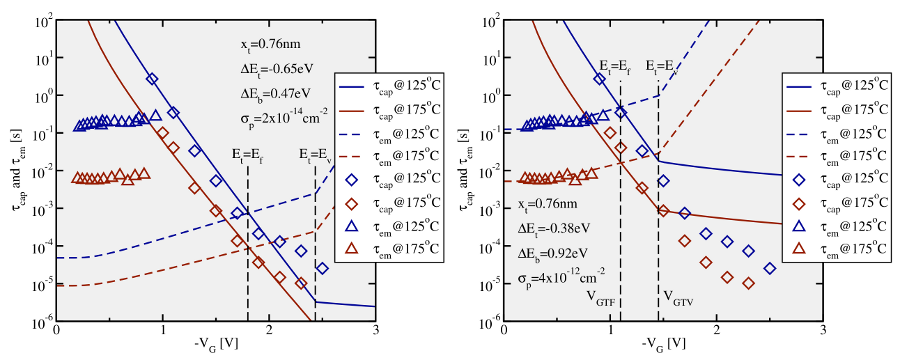
 (left),
reasonable fits can be achieved for them but
(left),
reasonable fits can be achieved for them but  is predicted three orders of
magnitudes too low. Alternatively, a good agreement (right) can be obtained
for the hole emission times
is predicted three orders of
magnitudes too low. Alternatively, a good agreement (right) can be obtained
for the hole emission times  but with a strong mismatch of the capture
times
but with a strong mismatch of the capture
times  for
for  . From this it is concluded that the Kirton model
is not capable of fitting
. From this it is concluded that the Kirton model
is not capable of fitting  and
and  at the same time.