7.3 Model Evaluation
The multitude of transition possibilities in the eNMP model results in quite complex
defect kinetics, which allow to explain the defect behavior seen in TDDS. This is
indeed important, since NBTI stress and relaxation processes are a superposition of
several single trapping and detrapping events. Therefore, the degradation could in
principle be reproduced by well-chosen distributions of model parameters.
However, TDDS experiments give insight into the behavior of single defects and
can therefore reveal whether a trapping model reflects the physics of a real
defect.
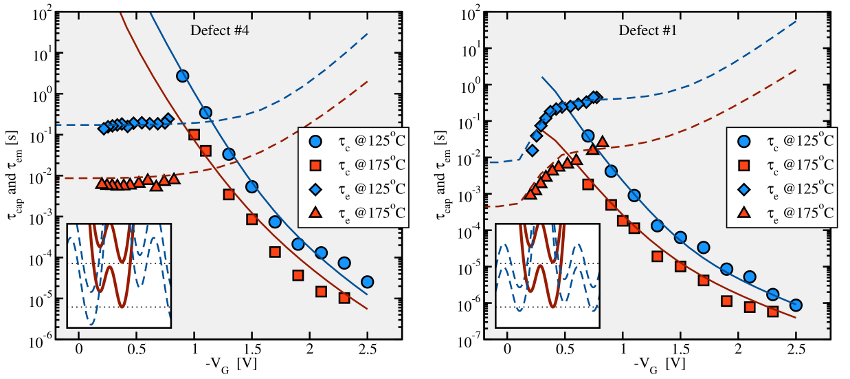
The time constant plots in Fig. 7.4 depict a fit of the eNMP model against
TDDS measurement data. An evaluation of the checklist in Table 7.1 is given
below:
- The curvature in
 is reproduced by the eNMP model for the first
time.
is reproduced by the eNMP model for the first
time.
 shows a marked temperature activation over the whole range of
  ,
visible as a parallel upward shift.
,
visible as a parallel upward shift.
- In general, the eNMP model yields field-insensitive
 as displayed
in Fig. 7.4 left. It is important to note here that at larger oxide fields
this model also predicts an exponential dependence, which has also been
observed for some defects in RTN measurements [55].
as displayed
in Fig. 7.4 left. It is important to note here that at larger oxide fields
this model also predicts an exponential dependence, which has also been
observed for some defects in RTN measurements [55].
- However, it also allows for a field-dependent
 provided that the energy
minima of the states
provided that the energy
minima of the states  and
and  are separated by only a few hundredth
of an electron Volt at small
are separated by only a few hundredth
of an electron Volt at small  (cf. Fig. 7.4 right).
- In both cases,
 is thermally-activated.
The above checklist demonstrates that the eNMP model predicts the key features of
the hole capture and emission process correctly, strongly indicating that the eNMP
model can describe the physics of the defects seen in TDDS.
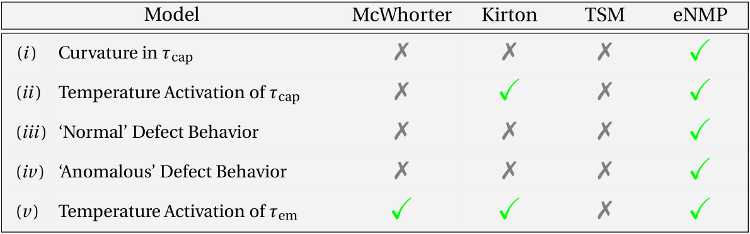
Table 7.1: Checklist for a defect model (see Section 1.3.4). The McWhorter
model, the Kirton model, as well as the TSM do not fulfill all criteria and
thus do not describe the defects seen in TDDS experiments. By contrast, the
eNMP reproduces the correct field and temperature dependence and gives an
explanation for the ‘normal’ and ‘anomalous’ defects.
 and
and  differ by at least a few tenth of an
electron Volt. This fact eventually characterizes this trap as a ‘normal’ defect.
differ by at least a few tenth of an
electron Volt. This fact eventually characterizes this trap as a ‘normal’ defect.
 at low
  or
or  . In contrast to a ‘normal’ defect, the
energy minima of the states
. In contrast to a ‘normal’ defect, the
energy minima of the states  and
and  coincide, which allows for the strong
sensitivity of
coincide, which allows for the strong
sensitivity of  to
to  .
.