7.5 Short-Term and Long-Term Relaxation
As illustrated in Fig. 7.7 the initial relaxation rate  after NBTI stress is
higher than its PBTI counterpart. For NBTI
after NBTI stress is
higher than its PBTI counterpart. For NBTI  increases with increasing
  ,
while for PBTI
,
while for PBTI  only slightly increases with increasing
  . Due to also
higher
. Due to also
higher  at the beginning of the relaxation with higher
  , the effect
even results in lower relative recovery per decade with higher
, the effect
even results in lower relative recovery per decade with higher  . Furthermore,
for PBTI
. Furthermore,
for PBTI  decreases with increasing
  because of the higher contributing
permanent part.
because of the higher contributing
permanent part.
In contrast, the long-term relaxation  increases with
  and
and  , which
clearly shows enhanced relaxation after PBTI stress, but lower relaxation after
NBTI compared to the corresponding
, which
clearly shows enhanced relaxation after PBTI stress, but lower relaxation after
NBTI compared to the corresponding  , cf. Fig. 7.8. All these results support
the trends schematically shown in Fig. 7.4.
, cf. Fig. 7.8. All these results support
the trends schematically shown in Fig. 7.4.
 ) and second (
 ) logarithm are
plotted over
) logarithm are
plotted over  as a function of the device thickness
  and its oxide
electric field
and its oxide
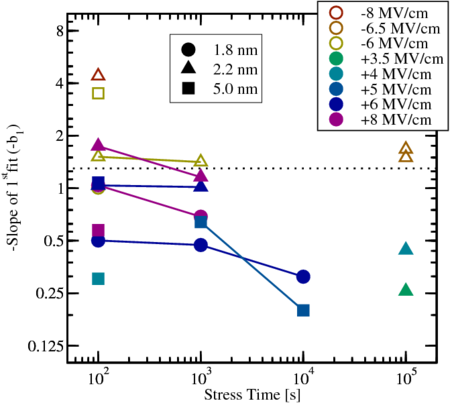
electric field  . The slope
  of NBTI stress is higher than that resulting
from PBTI stress, and decreases with
of NBTI stress is higher than that resulting
from PBTI stress, and decreases with  as shown by the solid lines. The
dashed line denotes the boundary between NBTI and PBTI. The initial
relaxation slopes
as shown by the solid lines. The
dashed line denotes the boundary between NBTI and PBTI. The initial
relaxation slopes  increase from
  (PBTI) to
  (NBTI), which is
a factor of more than
(NBTI), which is
a factor of more than  . This demonstrates the different initial relaxation
behavior following NBTI and PBTI stress.
. This demonstrates the different initial relaxation
behavior following NBTI and PBTI stress. 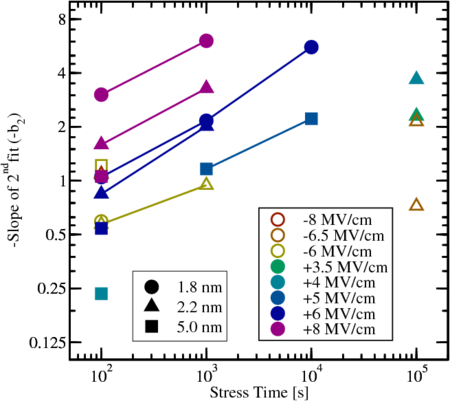
 ) and second (
 ) logarithm are
plotted over
) logarithm are
plotted over  as a function of the device thickness
  and its oxide
electric field
and its oxide
electric field  . The slope
  for the long-term characteristics increases
with
for the long-term characteristics increases
with  and
and  and clearly reflects the increased relaxation after PBTI
stress with values ranging from
and clearly reflects the increased relaxation after PBTI
stress with values ranging from  (NBTI) to
  (PBTI). Combining
this fact and recalling that PBTI does practically not recover during the
first few seconds supports the assumption that the performed kind of stress
condition already constitutes the short-term and long-term relaxation.
(PBTI). Combining
this fact and recalling that PBTI does practically not recover during the
first few seconds supports the assumption that the performed kind of stress
condition already constitutes the short-term and long-term relaxation. 