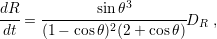
The estimation procedure developed here begins with a 1D simulation of the Volmer-Weber growth process for the TSV metal [99][109]. The purpose is to identify the island size distribution for a given set of growth parameters. The droplets are placed randomly over a substrate following a pre-established nucleation distribution which defines the amount of droplets per unit length. All droplets are considered to appear instantaneously at the beginning of the growth process. It is not an optimal assumption, but further improvements are left for future work. The island growth with time is given by
|
| (6.9) |
where  is the island radius,
  is the contact angle, and
  is the deposition rate in
units of length per time. Here, a constant deposition rate was employed in the range
between 1nm/s and 3nm/s, thus the island radius in each instant can be obtained by a
simple multiplication of the right hand side of (6.9) by the time. A nucleation rate of 0.01
nuclei per nanometer is assumed. In Fig. 6.9 a snapshot of the simulation evolution at one
instant in time is shown.
is the deposition rate in
units of length per time. Here, a constant deposition rate was employed in the range
between 1nm/s and 3nm/s, thus the island radius in each instant can be obtained by a
simple multiplication of the right hand side of (6.9) by the time. A nucleation rate of 0.01
nuclei per nanometer is assumed. In Fig. 6.9 a snapshot of the simulation evolution at one
instant in time is shown.
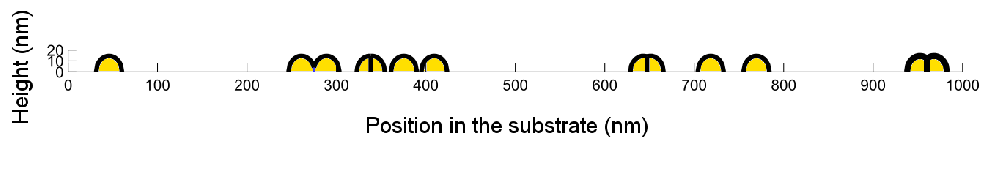
| Figure 6.9.: | Snapshot of the VW simulation used in this section. The grains will grow until the entire substrate is covered. |
During the VW growth simulation each island’s encounter characterizes an event. At every time step the simulation algorithm looks for an event occurrence. When one is found, the islands’ sizes are stored and the islands are marked as merged. In future time steps, the intersection points of the merged islands are computed and a boundary is defined at the line between the intersection point and the substrate, as depicted in Fig. 6.8.
The simulation is terminated, when every droplet has at least one encounter and the entire substrate is covered. At this point the histogram of the island size at first encounter is calculated and a distribution curve can be fitted. It follows an exponential decay as expected. A histogram, resulting from a sample simulation, is sketched in Fig. 6.10.
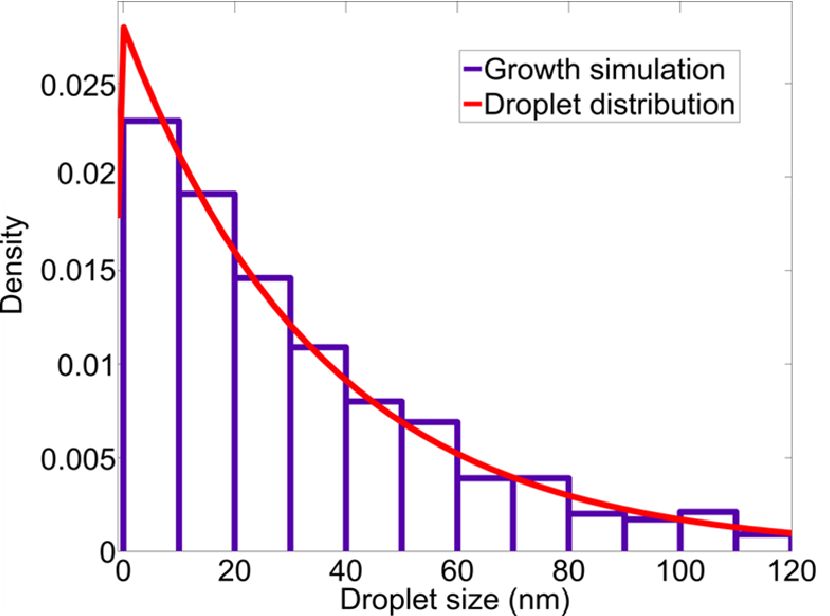
| Figure 6.10.: | Droplet size distribution during coalescence for the growth parameters considered in this work. The droplets’ sizes follow an exponential distribution. |