Next: 5. Analytic Modeling Approach for HCD Up: 4. The Charge-Pumping Technique Previous: 4.4 Analysis of the Threshold Voltage Turn-Around Effect
In this Section a direct comparison of simulated and experimental interface state density profiles is undertaken. For this purpose a 5V n-type MOSFET presented in Figure 3.2 is used as an experimental base. The devices have been stressed at a gate voltage Vgs of 2.0V and source-drain voltage Vds of 6.75V. The ambient temperature was T = 23oC and the stress time t = 105s. The constant-base-level CP technique [176,178,179,190,191] with Vgl = -5V and increased Vgh from -4V to 4V in 0.04V increments is used. Here Vgl and Vgh are the base and the high level of the gate pulse, respectively (see Figure 4.21a inset). As stated above, such a small step in gate pulse amplitude is set to obtain a detailed spatial resolution. Below the approach suggested in [174,190,176] is employed for the extraction of the Nit profile from the CP current.
(a)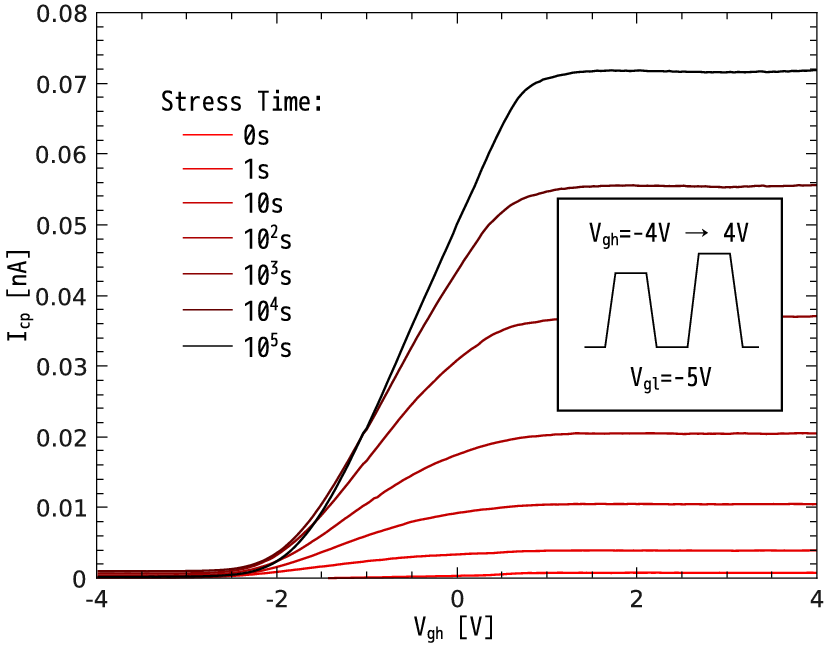 (b)
(b)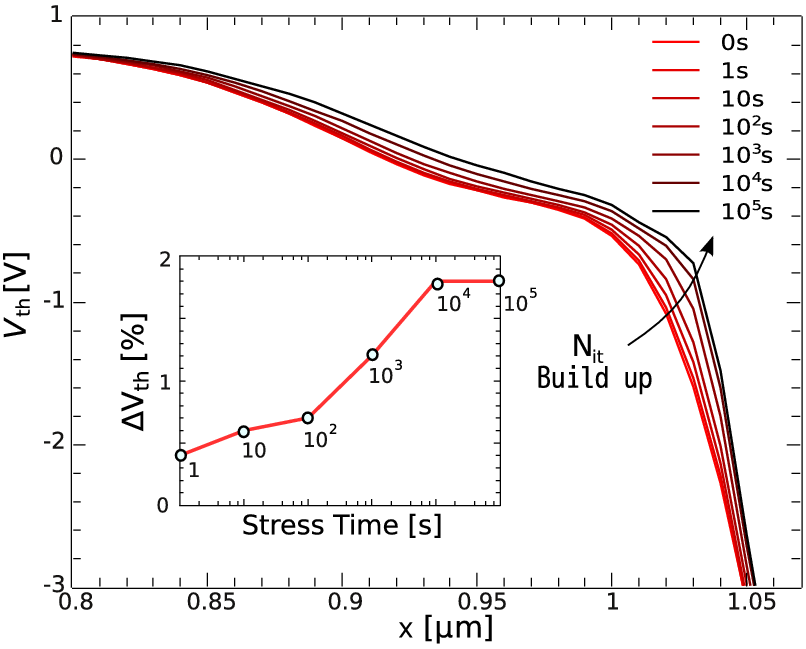 |
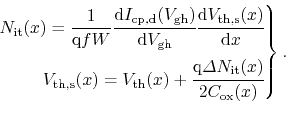
The Vth(x) distribution keeps its initial form corresponding to an undamaged device during HC stress only if the influence of the interplay between oxide and interface charges is small enough [174,175,176]. As explained in Section 4.3 in the case of the absence of a significant amount of oxide charges generated under hot-carrier stress one can use a simplified method for interface state density extraction and consider only the effect of Nit(x) on the calculated Vth(x). To be more precise, in the case of the technique with varying high level of the gate pulse, the extraction procedure can be reduced to a self-consistent solution of the system
In [191,22,179,190] the impact of the bulk oxide trap Not and interface trap density Nit on the CP current has been analyzed. A change inNot(x) without changing Nit(x) results only in a local shift of Icp along the Vgh axis. On the other hand, an increase of Nit(x) without changing Not(x) will only cause a local increase of dIcp/dVgh. Thus, based on the shape evolution of the Icp and dIcp/dVgh curves for different HC stress times it is believed that no significant amount of oxide charges are generated under the chosen stress conditions. This fact is confirmed by a measurement of the threshold voltage shift ΔVth by the maximum transconductance method (see Figure 4.21b inset). The increase of ΔVth demonstrates the dominance of Nit generation during the entire measurement time (see Section 4.4). Simply speaking, the aforementioned facts allow us to conclude that system (4.32) is valid and applicable for the established stress regime. A comparison of the extracted and the simulated data with HCD model interface state density profiles for several stress times is demonstrated in Figure 4.22a.
As mentioned in Chapter 1., it is usually assumed that the most severe hot-carrier degradation is localized of the electric field (or the driving force) peaks. This is because in this area carriers gain their maximum energy and the Si-H bond dissociation process is most intensive. However, the maxima of such physical quantities as the electric field, electron energy or dynamic temperature are not necessarily observed at the same position. Moreover, since both SP- and MP-processes are controlled by the AIs, just the maxima of these integrals correspond to the Nit peak. The AI maximum is controlled by the shape of the distribution function or - more precisely - the depth of the high energy tails. Therefore, the device area where the most extended tails of the DF are observed corresponds to the highest degradation dose. To conclude, it is rather important to compare coordinates for the most intensive trap creation, determined according to different criteria and the maxima of Nit (as well as Nit peak for the undamaged device). This information is provided in Figure 4.22b.
(a)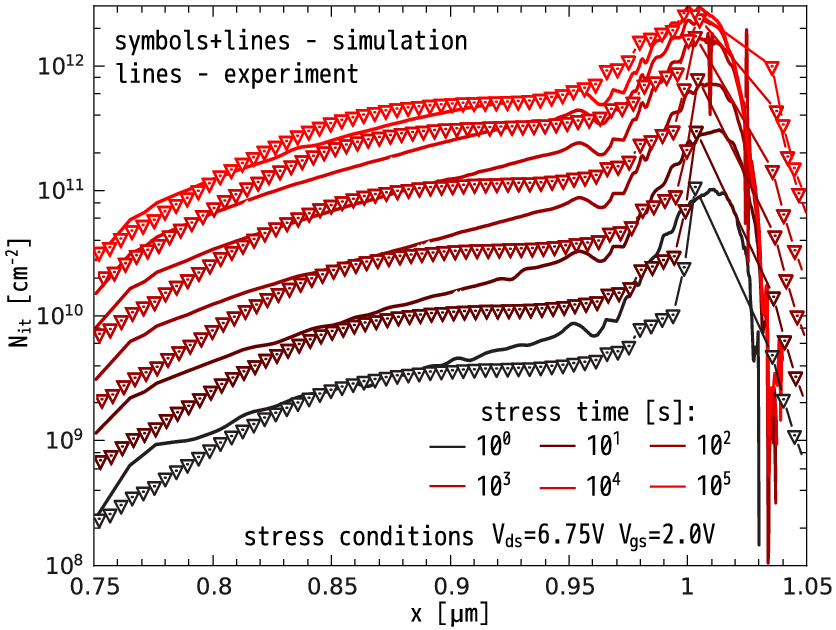 (b)
(b)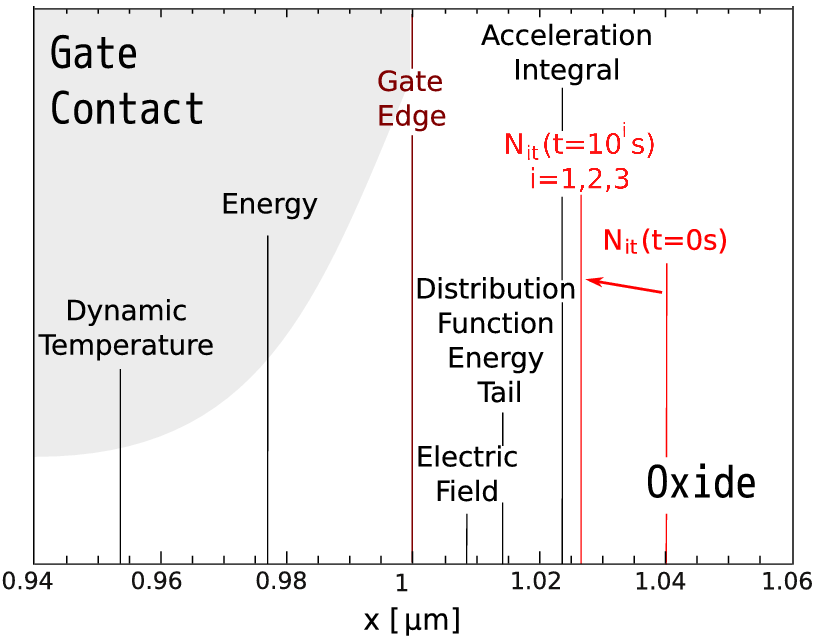
|
One essential feature should be emphasized. As demonstrated in Section 4.2, the "virgin" device is characterized by the pre-existing interface state density and the initial Nit has a peak at a certain position which differs from the position of the maximal AI(s) and is described by features of the fabrication process. This results in a shift of the interface state density profile maximum for the first few seconds of the degradation (Figure 4.22b). After 10s of hot-carrier stress the peak of the experimental Nit profile practically coincides with the peak of ISP (peak of the theoretical Nit, with the difference in positions less than ~4nm. Such a system behavior depicted in Figure 4.22b allowing for the conclusion that the description of the hot-carrier degradation is untenable in the framework of the most principal physical quantities. Figure 4.22b shows that the peak positions are distributed in space and the extension of this distribution is ~100nm which is already rather large (especially compared to the distance between Nitand AI maxima). Moreover, these results once again confirm that the maximum of the interface state profile should be described in terms of the AI rather than linking it with the position of the deepest high-energy tail of the distribution function [23,40]. Both SP- and MP-mechanisms of Si-H bond-breakage are described by the carrier AI controlled by the DF. The structure of the integrand herein contains a superposition of rapidly decaying high-energy tails of the distribution function and quickly increasing capture cross sections, carrier velocity and the density-of-states. Therefore, the maximum of this integral is shifted with respect to the position where the DF demonstrates the deepest high-energy tails.
|
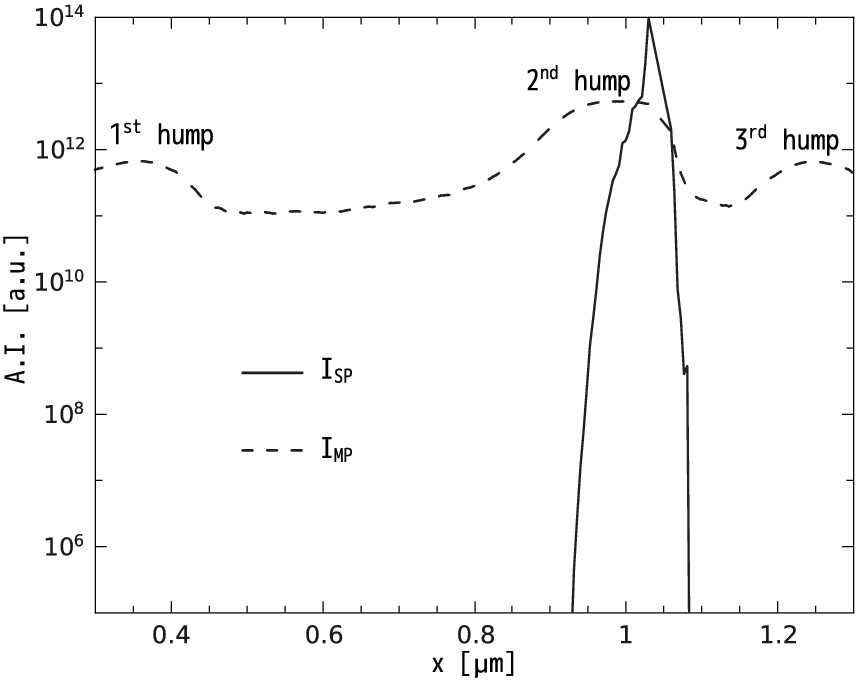
After 103s it is possible to observe a weak second shift (~17nm) of the Nit peak to the drain contact side. This could be explained by the necessity of a self-consistent simulation of the DF (or still existence of Not build-up influence). Figure 4.23 demonstrates a strong localization of the degradation portion associated with the single-particle process. The interface state density corresponding to the SP-mechanism abruptly changes practically from 0 to a significant value (compared to Figure 4.24a). In contrast, the MP-related acceleration integral does not change so drastically with the coordinate. Three pronounced humps in the profile mimic the energy tails of the DF. The first (centered at x≈0.25um) and the third (positioned at ≈1.25um) hump are associated with the p-n junctions of the source/channel and channel/drain sections of the MOSFET while the second one is observed near the drain end of the gate, i.e. just near the areas where the DF demonstrates deepest high-energy tails. This tendency is reflected on the SP- and MP-induced interface states profiles plotted in Figure 4.24a and Figure 4.24b, respectively.
Note that the AI for the MP-process controls the interface state density via the prefactor (Pu/Pd) in expression (3.9) and thus its variation is not as large as in the case of the SP-component. Figure 4.24b shows that NMP represents the behavior of the corresponding AI. This means that electrons in the channel cannot reach high energies in this range and are "cold" from the perspective of the SP-process but still have sufficient energy to contribute to the MP-mechanism. In conclusion, the MP-component is present at all values of the x coordinate, in contrast to the SP-component which contributes only in a rather narrow region. It should be noted that only NMP is responsible for the flat plateau situated left of the maximum of the total concentration Nit (this plateau is schematically shown in Figure 4.22a).
It is worth commenting on the choice of parameters entering the acceleration integral. For the SP-process parameters similar to those reported in previous papers are employed (e.g. [30,31,99,32]): the threshold energy for the bond-breakage process is set equal to Eth,SP = 1.5eV and the exponent in the Keldysh-like reaction cross section pit,SP = 11. The parameters characterizing the energetics of the truncated harmonic oscillator were similar to those listed in Table 1.1, however, experimental data is fitted with our simulations, taking pit,MP ~0.1, i.e. the process is practically energy-independent. Actually, pit,SP and pit,MP describe different physical processes, i.e. the excitation of the bonding electron to the antibonding state in the former case and electron-phonon interaction in the latter one. Generally speaking, these processes are described by different values of reaction cross sections. The value of Eth,MP equal to 1.5eV (used in the model) should also be verified, because it is also inherited from the SP-process. Although the pair of parameters pit,MP ~0.1, Eth,MP = 1.5eV satisfactorily described the matter, this issue must be clarified. A weak energy dependence of the cross section for the MP-process may also be related to the parameter dispersion, when the large standard deviation dictates that an effectively smaller value of the parameter produces the main contribution.
Due to the employment of the Monte-Carlo method, calculations of the distribution function with a good spatial resolution and accurate high-energy tails is a time-consuming challenge. Therefore, in spite of the good agreement between the simulated and extracted Nit profiles, there is room for improvement at the expense of increased computational costs. Although good agreement between the experiment and simulation has been achieved, the theoretical Nit profile may be further refined. The stochastic nature of the Monte-Carlo method is responsible for some computational noise while evaluating the distribution function. Therefore, one may envisage a niche for improvement related to perfect calculations of the DF. Alternatively, a refinement may be achieved in the extraction technique of the Nit profile from CP data. In (4.32) Cox(x) is considered as a constant with stress time, which could work only as a first order approach. The presence of the oxide and/or interface charges transforms Cox into a function of the interface coordinate and degradation time. Already at the present stage one can emphasize the necessity of a self-consistent procedure for the extraction of the Nit profile from CP measurements - after each time step of the HC stress influence of the Nit and Not on the threshold and/or flatband voltages should be taken into account. Otherwise a discrepancy between the extracted and the experimental values could amount up to one order of magnitude.
(a)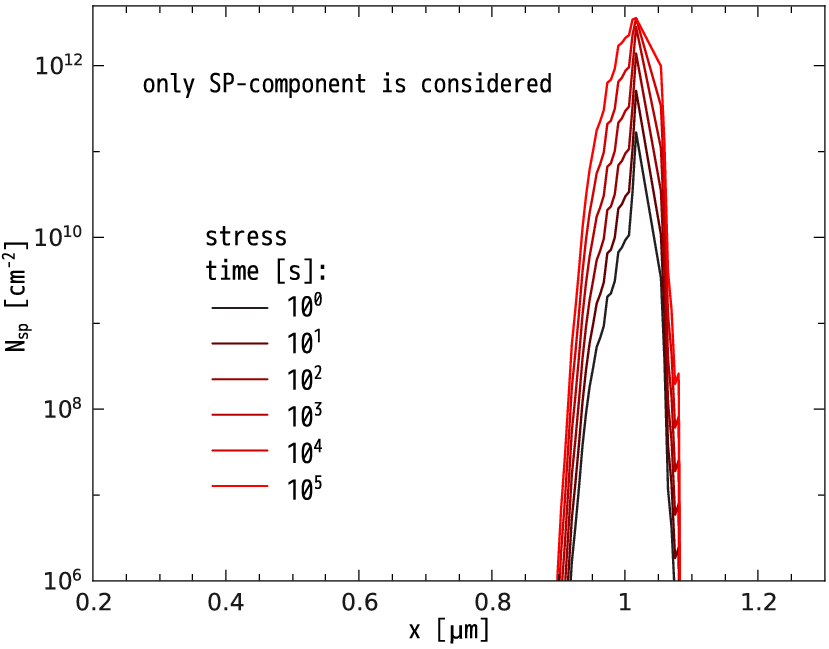 (b)
(b)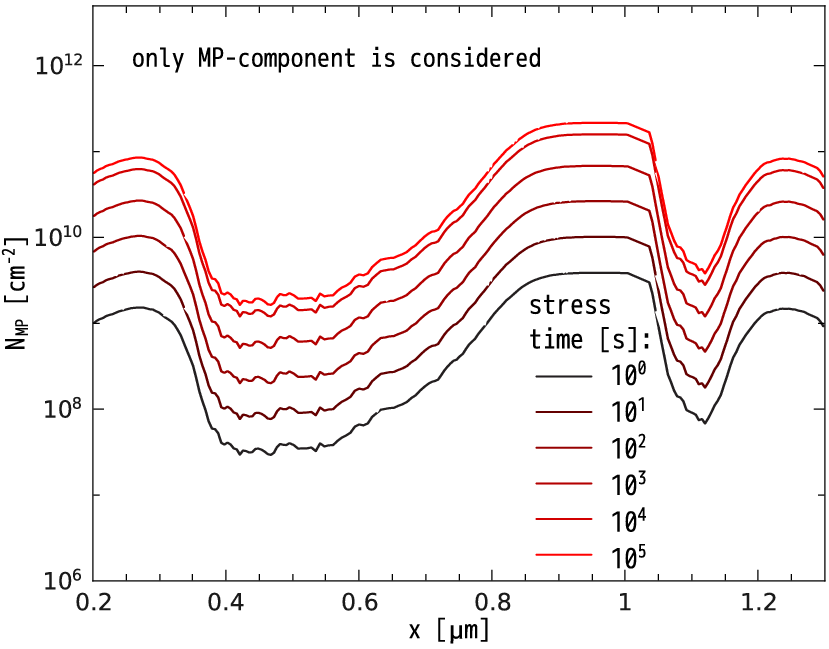 |
The main advantage of the developed model is that one does not have to recalibrate it when switching from one device architecture and/or stress conditions to another. In other words, the set of parameters describing the Si-H dissociation kinetics is fitted once and does not depend on process conditions. As for the transport module, the Boltzmann transport equation is to be solved each time the device topology and stress conditions are changed in order to obtain the new set of DFs corresponding to the current situation. As a result, the model is suitable to predict the device life-time not only for accelerated stress conditions but also under normal operating conditions and thus is useful for development and reliability engineers. Another advantage is that the model provides information about the Nit profiles, and in in particular captures the strong localization of HCD. Two additional important peculiarities of hot-carrier degradation captured by the model are the saturation of the damage as well as the representation of the worst-case conditions.