and
and  in the
configuration coordinate diagrams are approximated by the parabolas around their
respective minima
in the
configuration coordinate diagrams are approximated by the parabolas around their
respective minima  and
and  assuming the harmonic approximation:
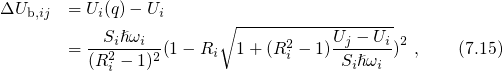
The transition rates of charge transfer reactions must be discussed on the basis of
configuration coordinate diagrams. One such a diagram is depicted in Fig. 7.1 for the
case of hole trapping. The adiabatic potentials and in the
configuration coordinate diagrams are approximated by the parabolas around their
respective minima and assuming the harmonic approximation:
 and
and  denote the vibrational frequency of the oscillator potential
when the defect is in the charge state
denote the vibrational frequency of the oscillator potential
when the defect is in the charge state  and
and  , respectively. It is stressed
that these oscillator potentials of both charge states are assumed to have
different curvatures
, respectively. It is stressed
that these oscillator potentials of both charge states are assumed to have
different curvatures  in this derivation. The transition barriers
  and
and  differ by the energy
  , which can be expressed as
using the relations
, which can be expressed as
using the relations 
 , accompanied by an upwards shift of the left
parabola from
, accompanied by an upwards shift of the left
parabola from  (solid) to
  (dashed). By contrast, when the defect
is positively charged (right parabola), the whole system including the defect
and the substrate is represented by the parabola
(dashed). By contrast, when the defect
is positively charged (right parabola), the whole system including the defect
and the substrate is represented by the parabola  (solid). In general, the
curvature of
(solid). In general, the
curvature of  and
and  do not need to be equal. As a consequence, both
adiabatic potentials are characterized by their own oscillator frequency (
do not need to be equal. As a consequence, both
adiabatic potentials are characterized by their own oscillator frequency ( ,
,
 ) and in further consequence their own Huang Rhys factor (
 ,
,  ).
). corresponds to the separation of the trap level from the valence band edge
and
corresponds to the separation of the trap level from the valence band edge
and  gives the kinetic energy of the substrate hole. Making use of
expression (7.3), the difference between the transition barriers can be expressed as:
gives the kinetic energy of the substrate hole. Making use of
expression (7.3), the difference between the transition barriers can be expressed as:

 and
and  are required. The former is defined as the energy difference
between
are required. The former is defined as the energy difference
between  and the intersection point IP in the configuration coordinate
diagram. The position of of this point can be derived from the condition
and the intersection point IP in the configuration coordinate
diagram. The position of of this point can be derived from the condition

 is defined by the equation
 and
and  differ and thus
the quantity
differ and thus
the quantity  deviates from unity. Since
  enters the above expression for the
barrier height, the oscillator frequencies have a strong impact on the transition
rates. When the kinetic energy of the substrate hole is taken into account,
enters the above expression for the
barrier height, the oscillator frequencies have a strong impact on the transition
rates. When the kinetic energy of the substrate hole is taken into account,
 must be replaced by
  and equation (7.17) can be rewritten as
In the case of strong electron-phonon coupling,
and equation (7.17) can be rewritten as
In the case of strong electron-phonon coupling,  holds and
the third term can be neglected. Assuming parabolic bands (see Appendix A.4), the
valence band density of states can be expressed as with
holds and
the third term can be neglected. Assuming parabolic bands (see Appendix A.4), the
valence band density of states can be expressed as with 

 denotes the Gamma function, which is defined by


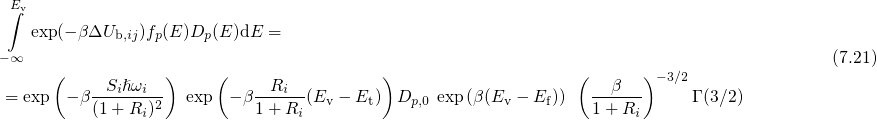
 equals
  and the hole capture and emission time
constant reads It is emphasized that the barrier heights are correctly calculated by determining the
crossing point of two parabolas. Thereby, one avoids the artificial differentiation,
whether
and the hole capture and emission time
constant reads It is emphasized that the barrier heights are correctly calculated by determining the
crossing point of two parabolas. Thereby, one avoids the artificial differentiation,
whether  is located above or below
  , as it has been the case in equation
(6.10) of the TSM. Additionally, the NMP barriers have not been assumed to be
independent of the energy of the hole in contrast to the Kirton model and the
TSM.
, as it has been the case in equation
(6.10) of the TSM. Additionally, the NMP barriers have not been assumed to be
independent of the energy of the hole in contrast to the Kirton model and the
TSM.