A Supplementary Material 1

In the following, the results for the test cases in Chapter 3 are provided for various resolutions.
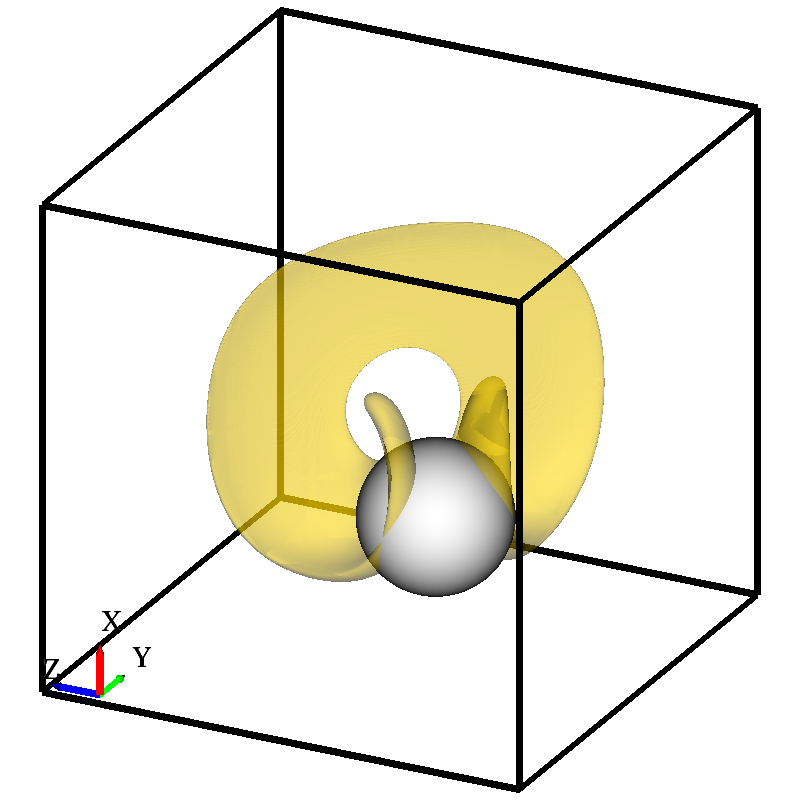
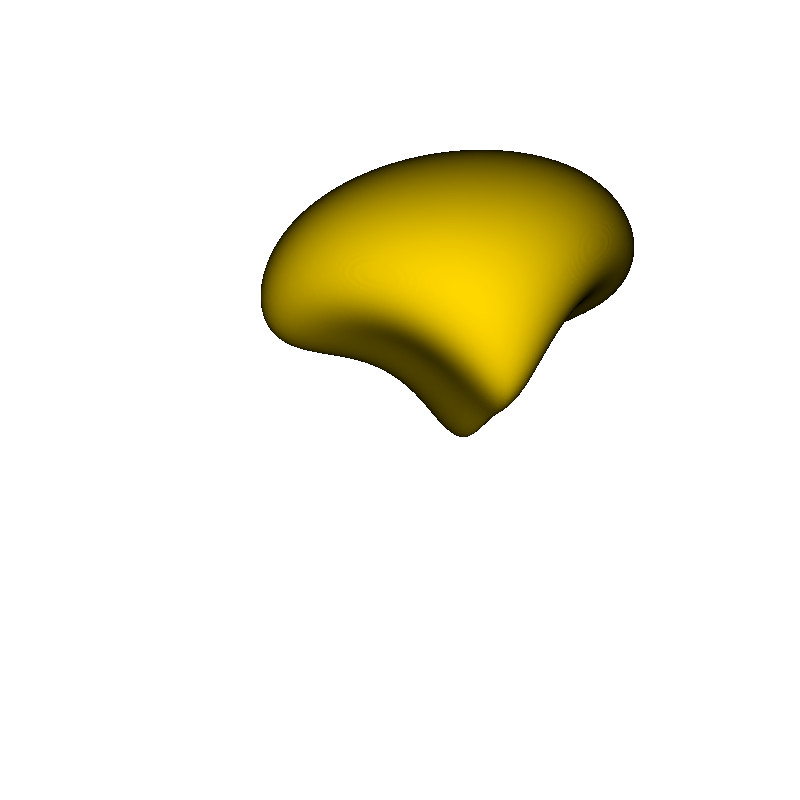
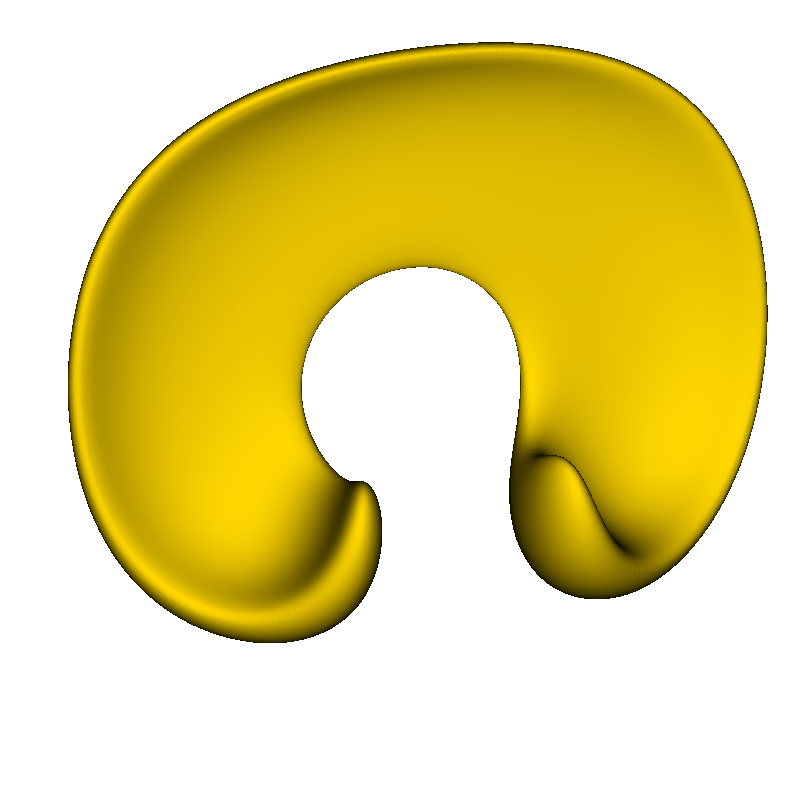
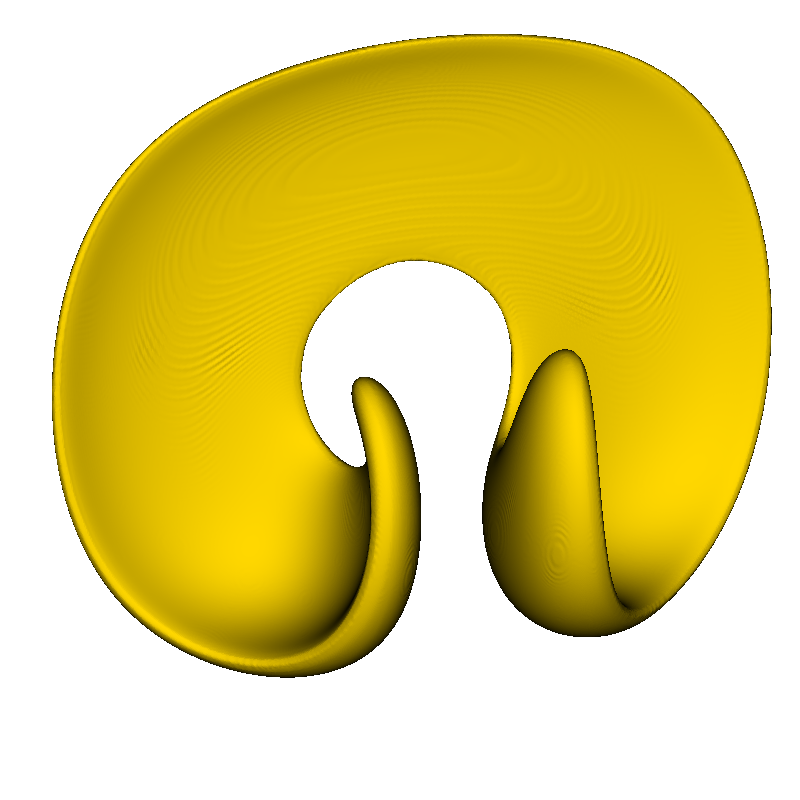
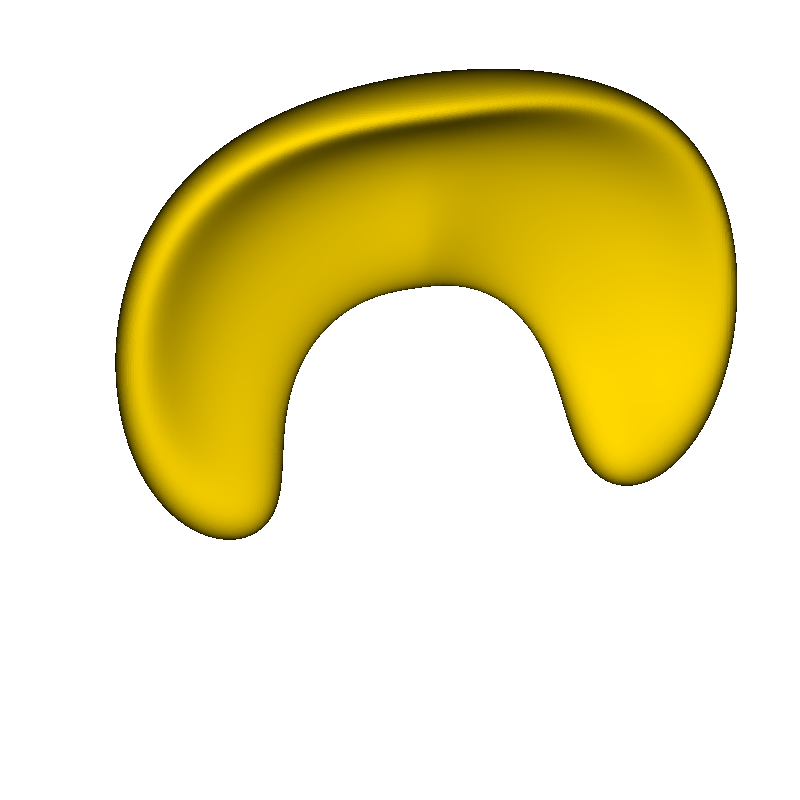
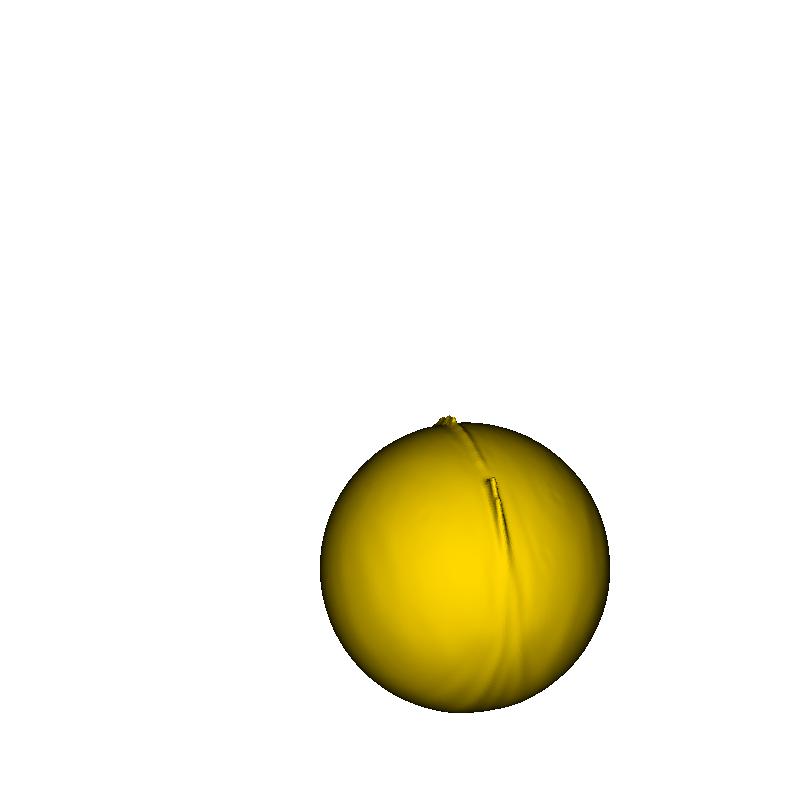
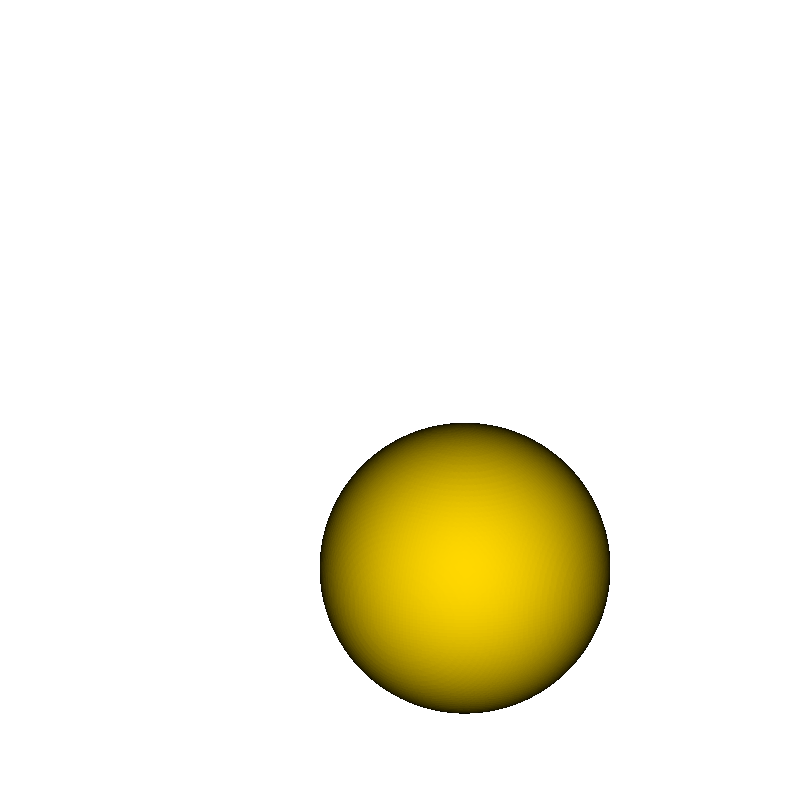
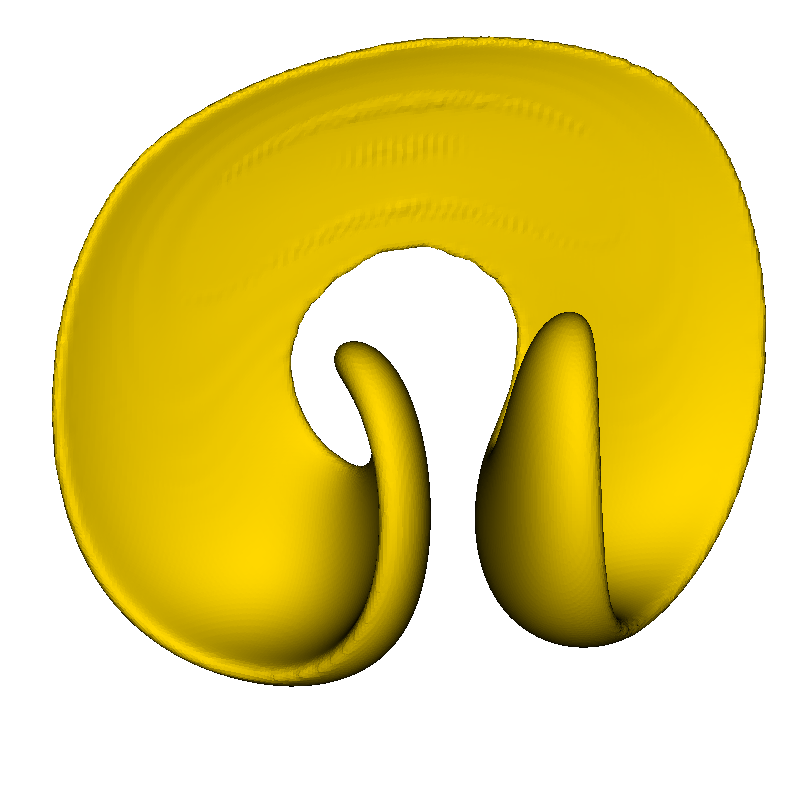
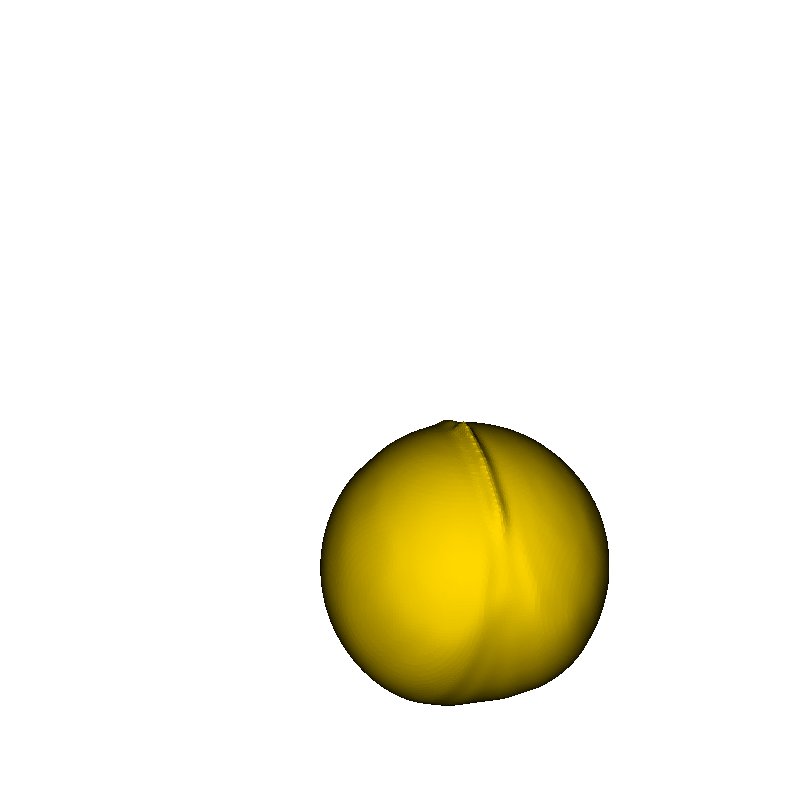
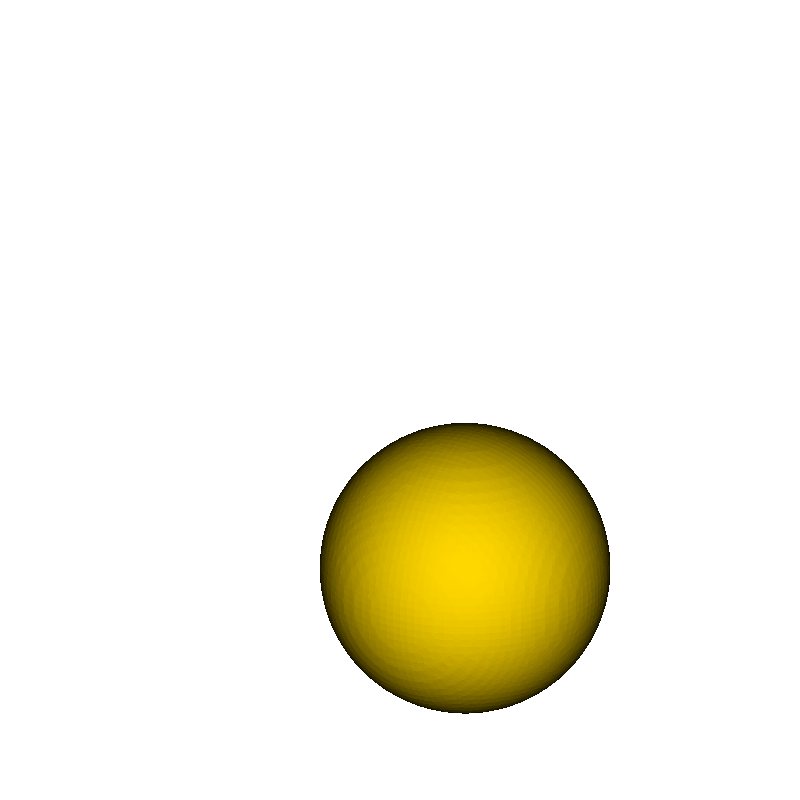
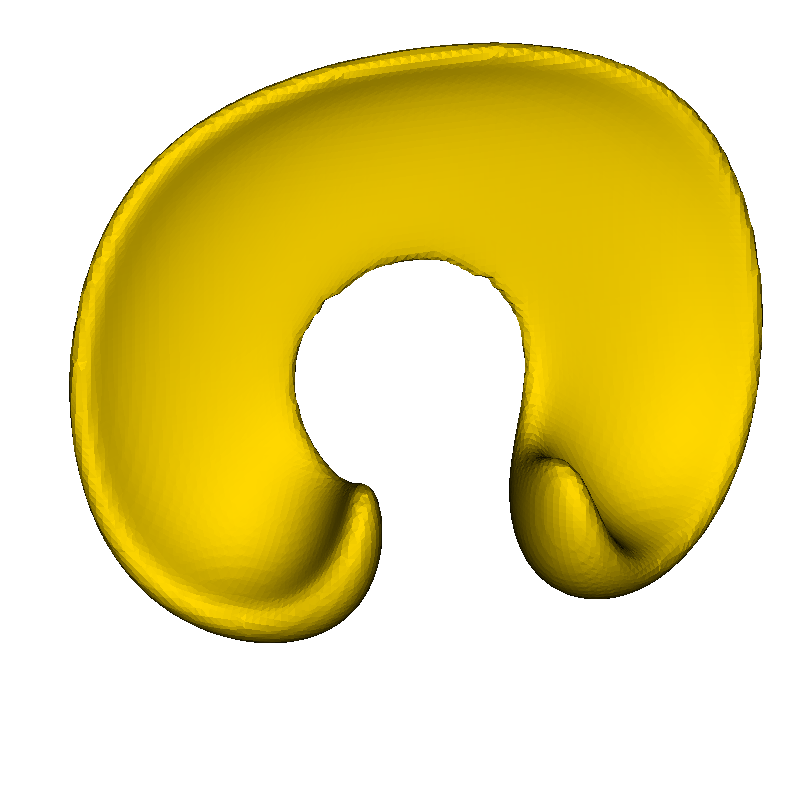
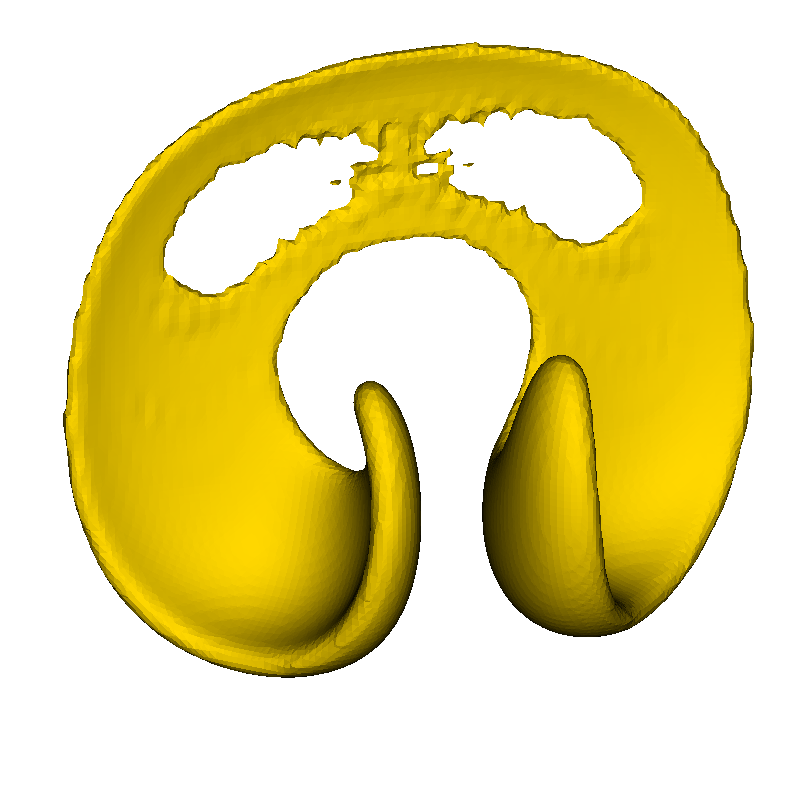
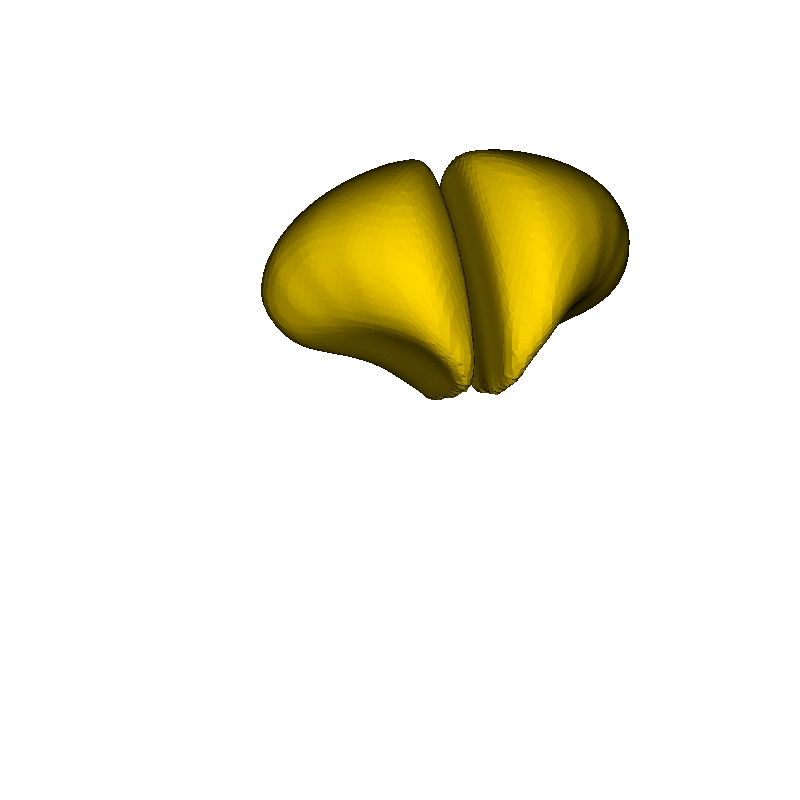
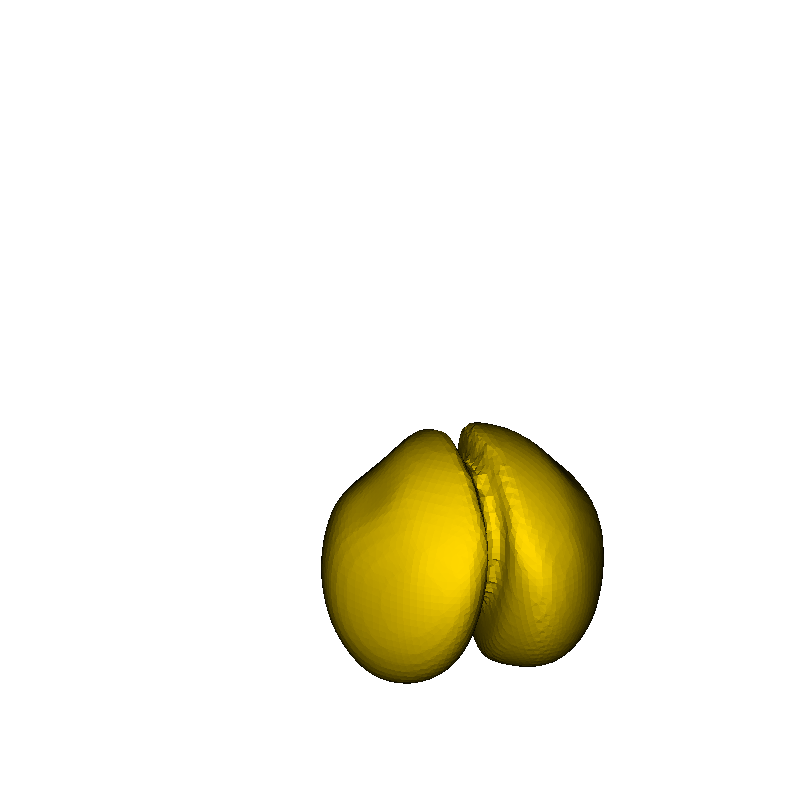
A.1 Enright Test

(a) Unit Domain

(b) \( T=0.0 \)

(c) \( T=0.3 \)


(d) \( T=0.6 \)

(e) \( T=0.9 \)

(f) \( T=1.2 \)


(g) \( T=1.5 \)

(h) \( T=1.8 \)

(i) \( T=2.1 \)


(j) \( T=2.4 \)

(k) \( T=2.7 \)

(l) \( T=3.0 \)

Figure A.1: Results for the Enright test for resolution \( 1024^3 \). The domain is shown in (a); (b)- (l) show the result from \( T=0.0 \) to \( T=3.0 \) with a stepsize \( 0.3 \). The same illustration for resolution \( 512^3 \), \( 256^3 \), and \( 128^3 \) is provided in Figures A.2A.3, and A.4.

(a) Unit Domain

(b) \( T=0.0 \)

(c) \( T=0.3 \)


(d) \( T=0.6 \)

(e) \( T=0.9 \)

(f) \( T=1.2 \)


(g) \( T=1.5 \)

(h) \( T=1.8 \)

(i) \( T=2.1 \)


(j) \( T=2.4 \)

(k) \( T=2.7 \)

(l) \( T=3.0 \)

Figure A.2: Results for the Enright test for resolution \( 512^3 \).

(a) Unit Domain

(b) \( T=0.0 \)

(c) \( T=0.3 \)


(d) \( T=0.6 \)

(e) \( T=0.9 \)

(f) \( T=1.2 \)


(g) \( T=1.5 \)

(h) \( T=1.8 \)

(i) \( T=2.1 \)


(j) \( T=2.4 \)

(k) \( T=2.7 \)

(l) \( T=3.0 \)

Figure A.3: Results for the Enright test for resolution \( 256^3 \).

(a) Unit Domain

(b) \( T=0.0 \)

(c) \( T=0.3 \)


(d) \( T=0.6 \)

(e) \( T=0.9 \)

(f) \( T=1.2 \)


(g) \( T=1.5 \)

(h) \( T=1.8 \)

(i) \( T=2.1 \)


(j) \( T=2.4 \)

(k) \( T=2.7 \)

(l) \( T=3.0 \)

Figure A.4: Results for the Enright test for resolution \( 128^3 \).

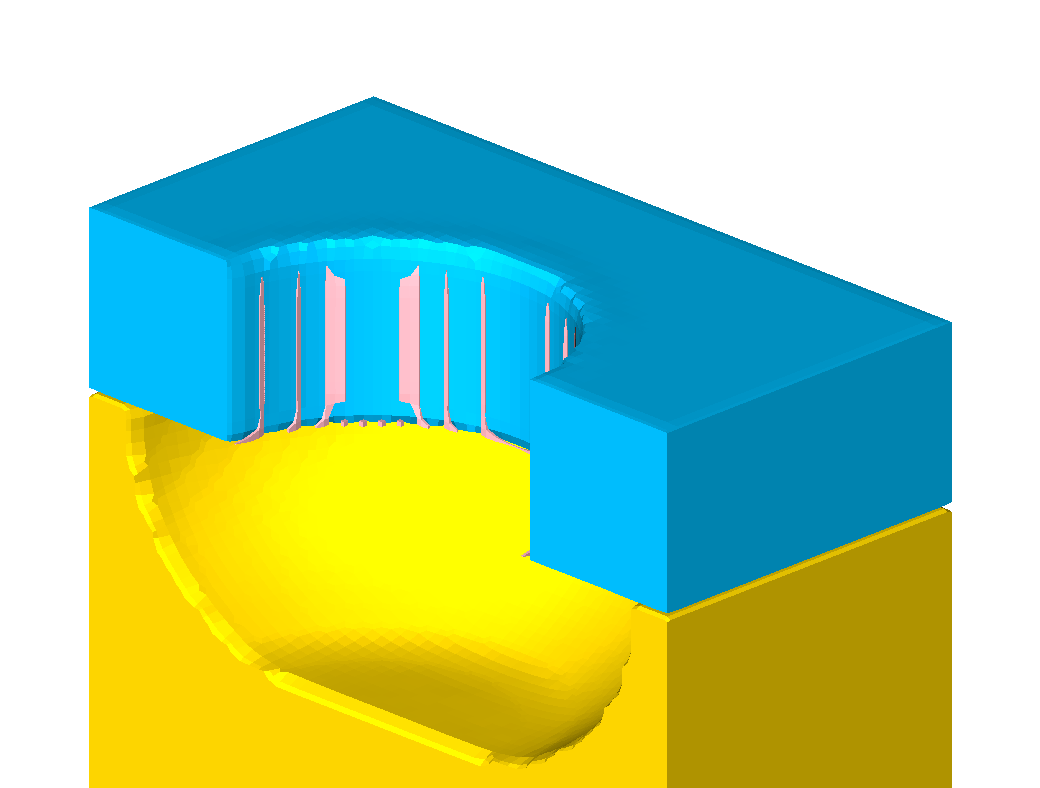
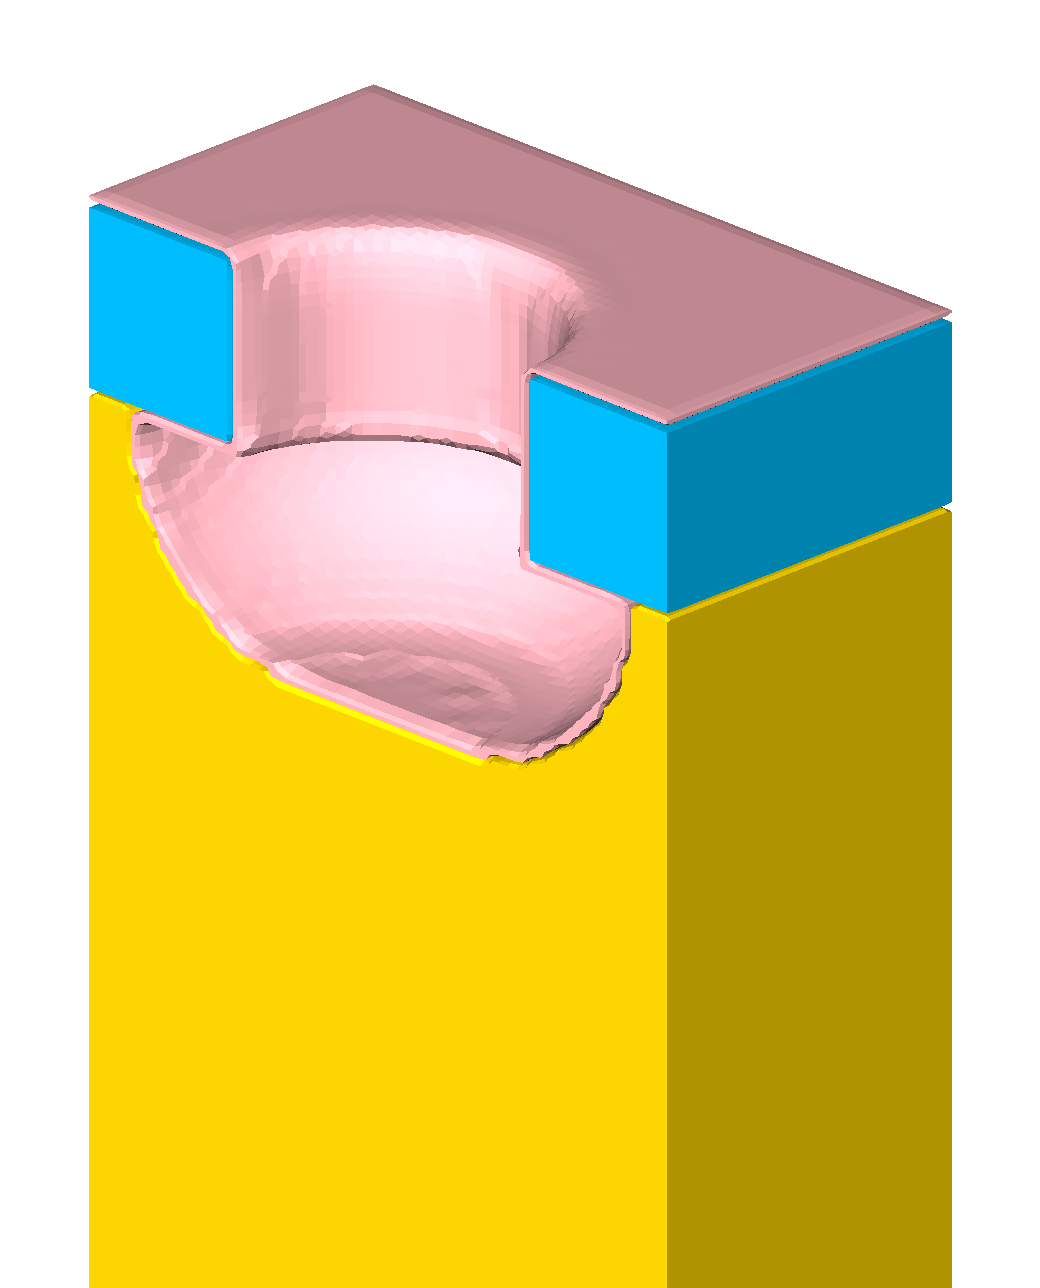
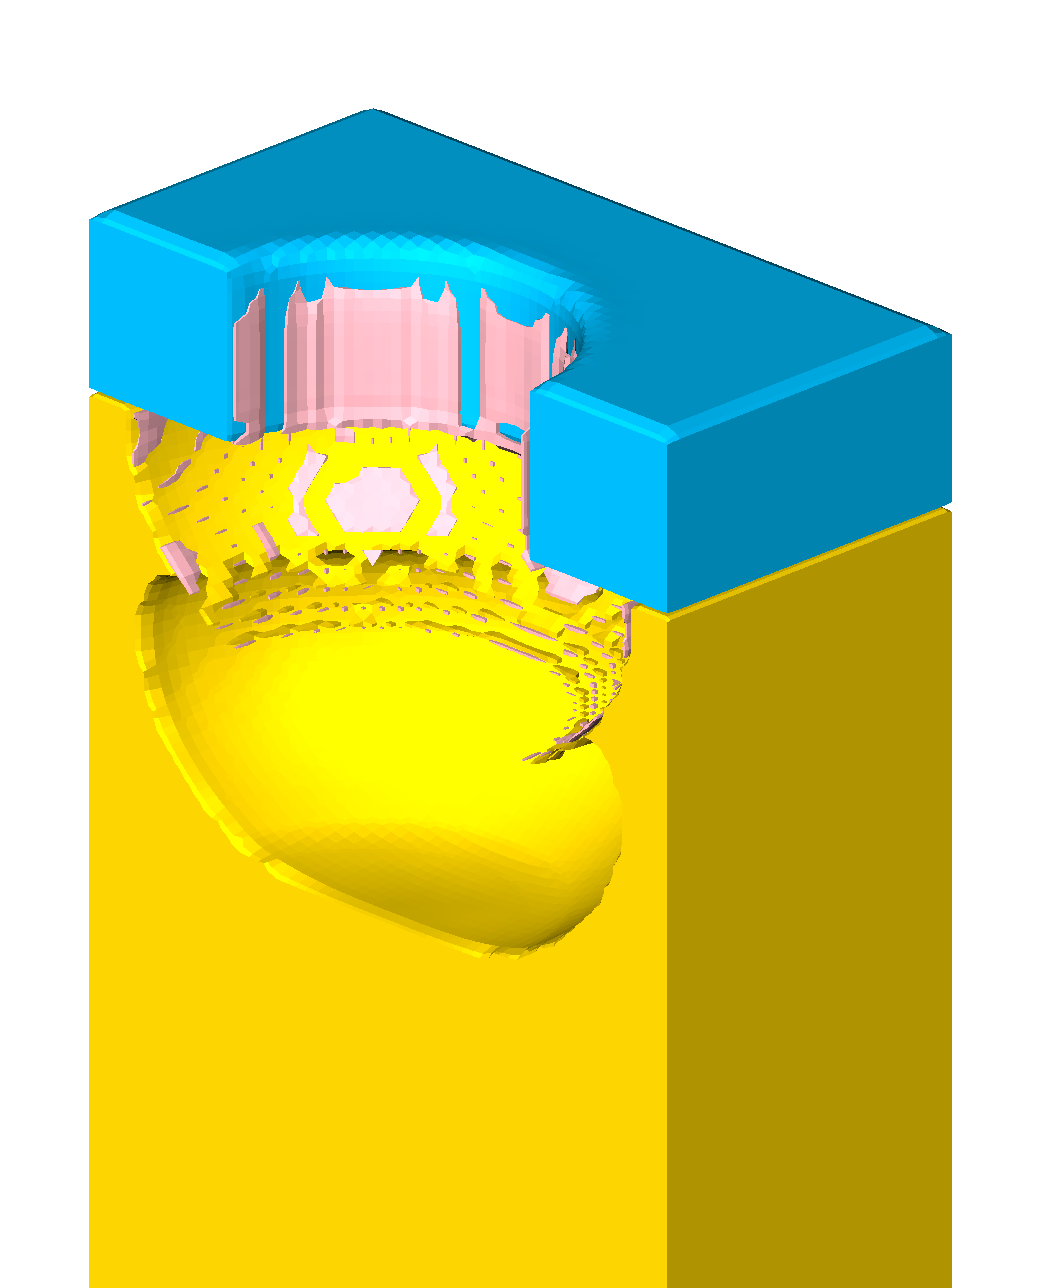
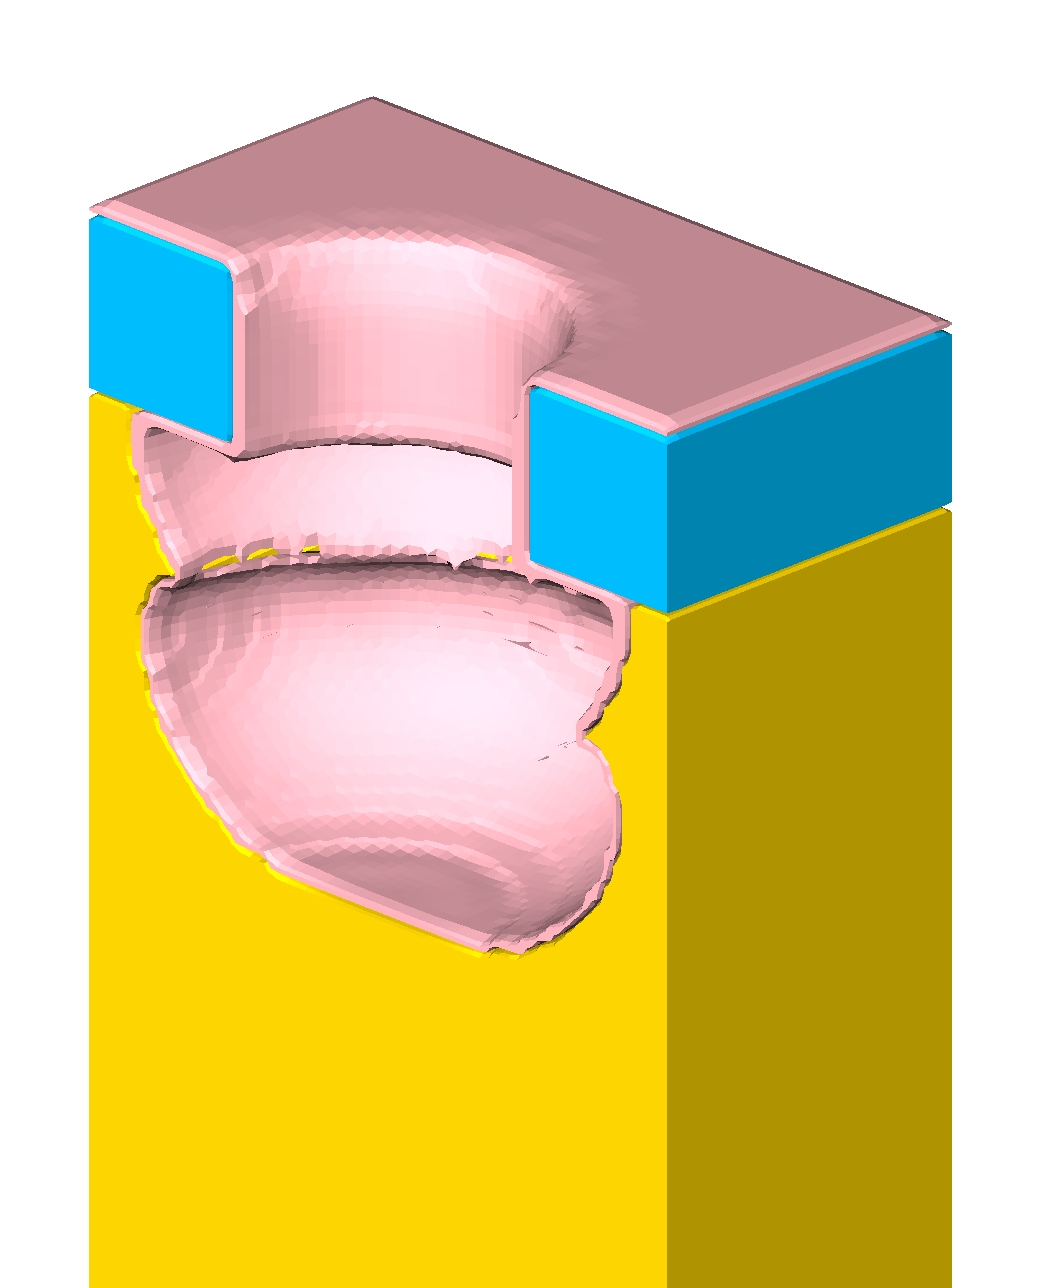
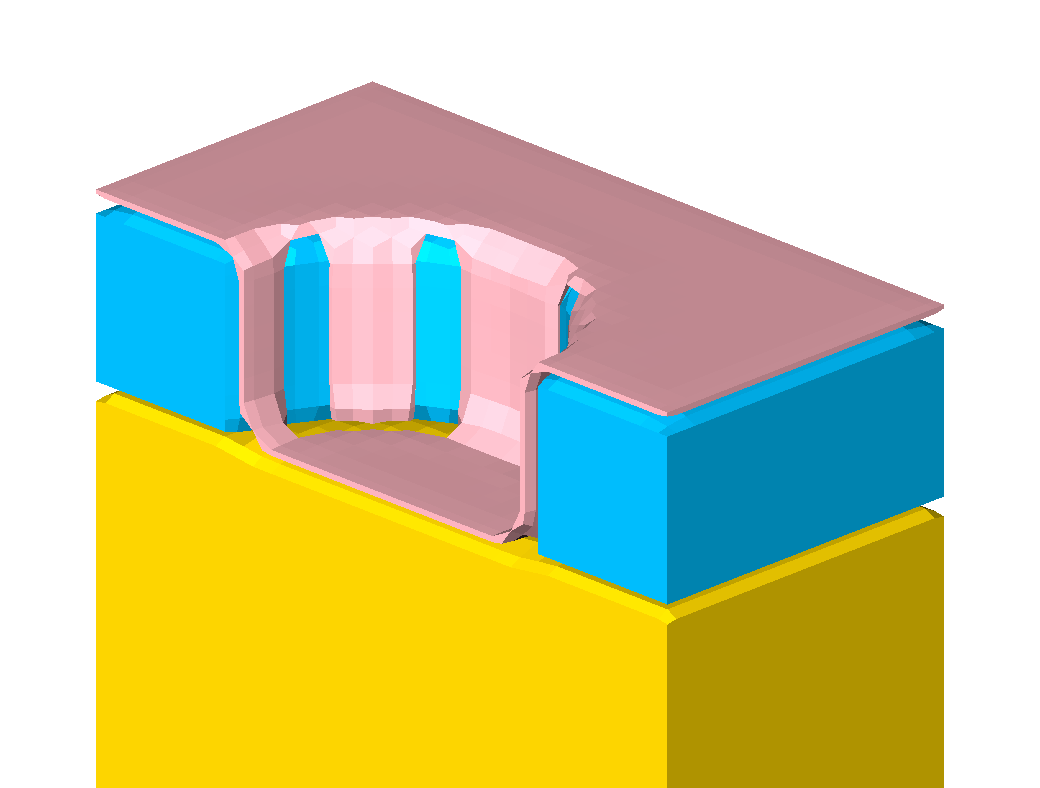
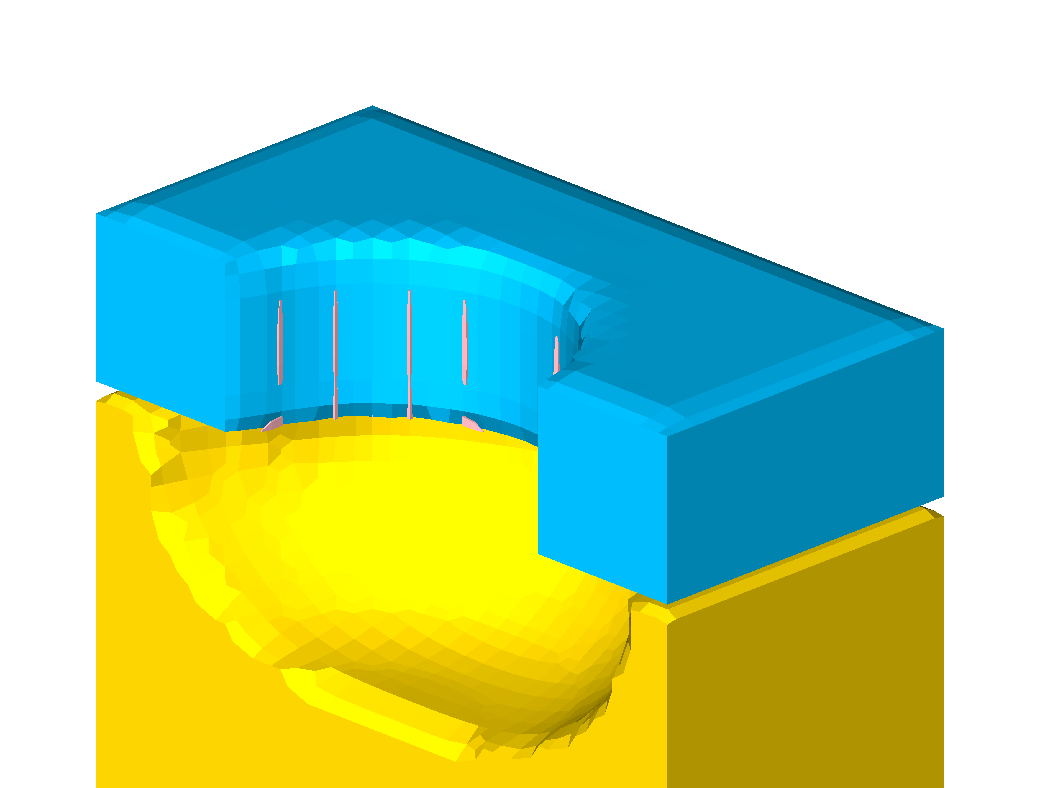
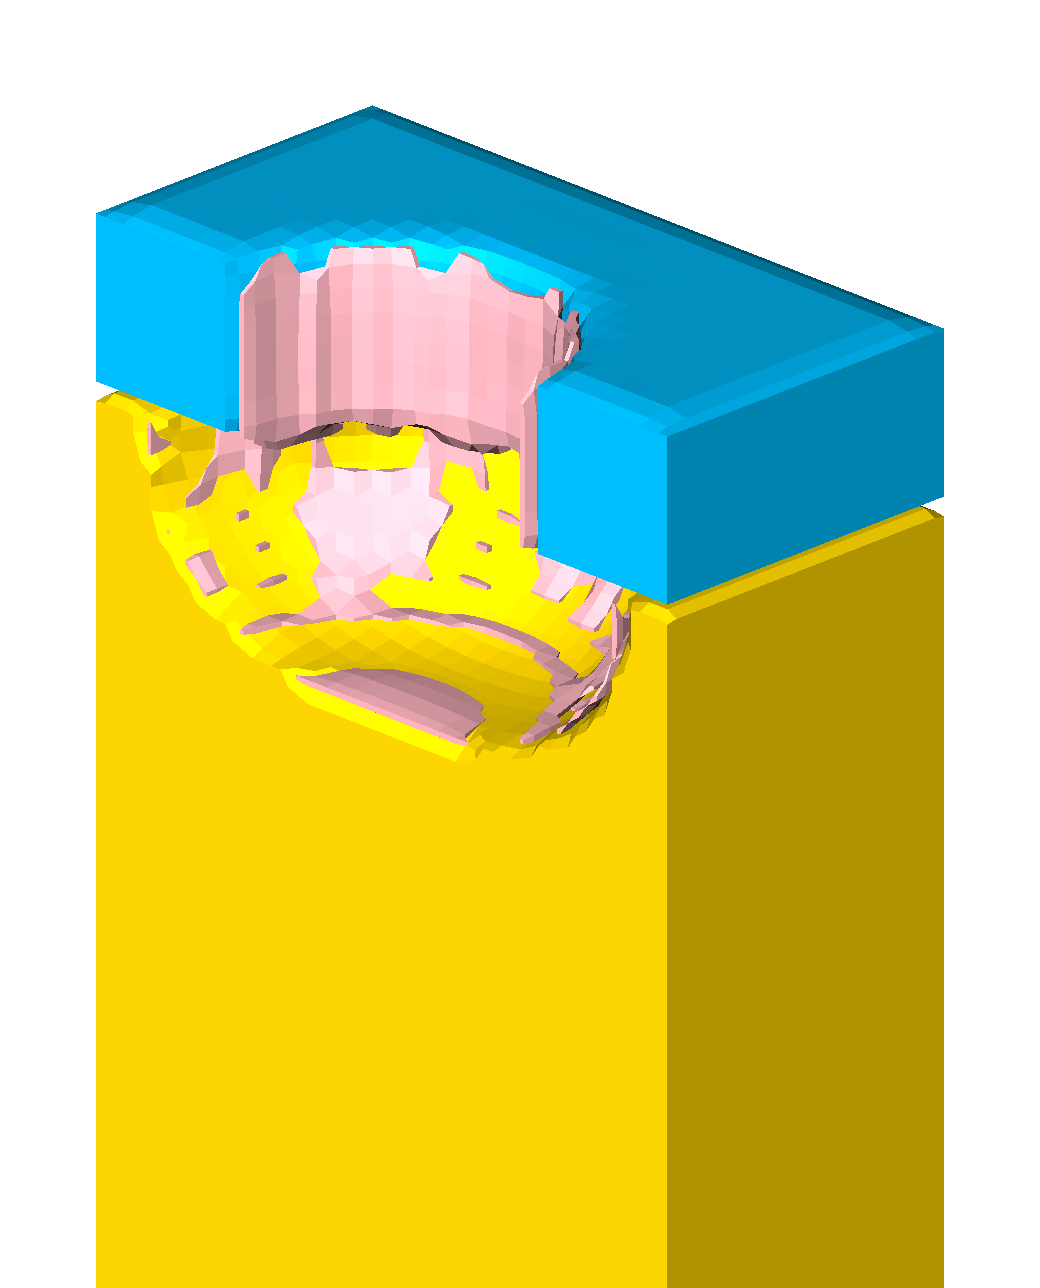
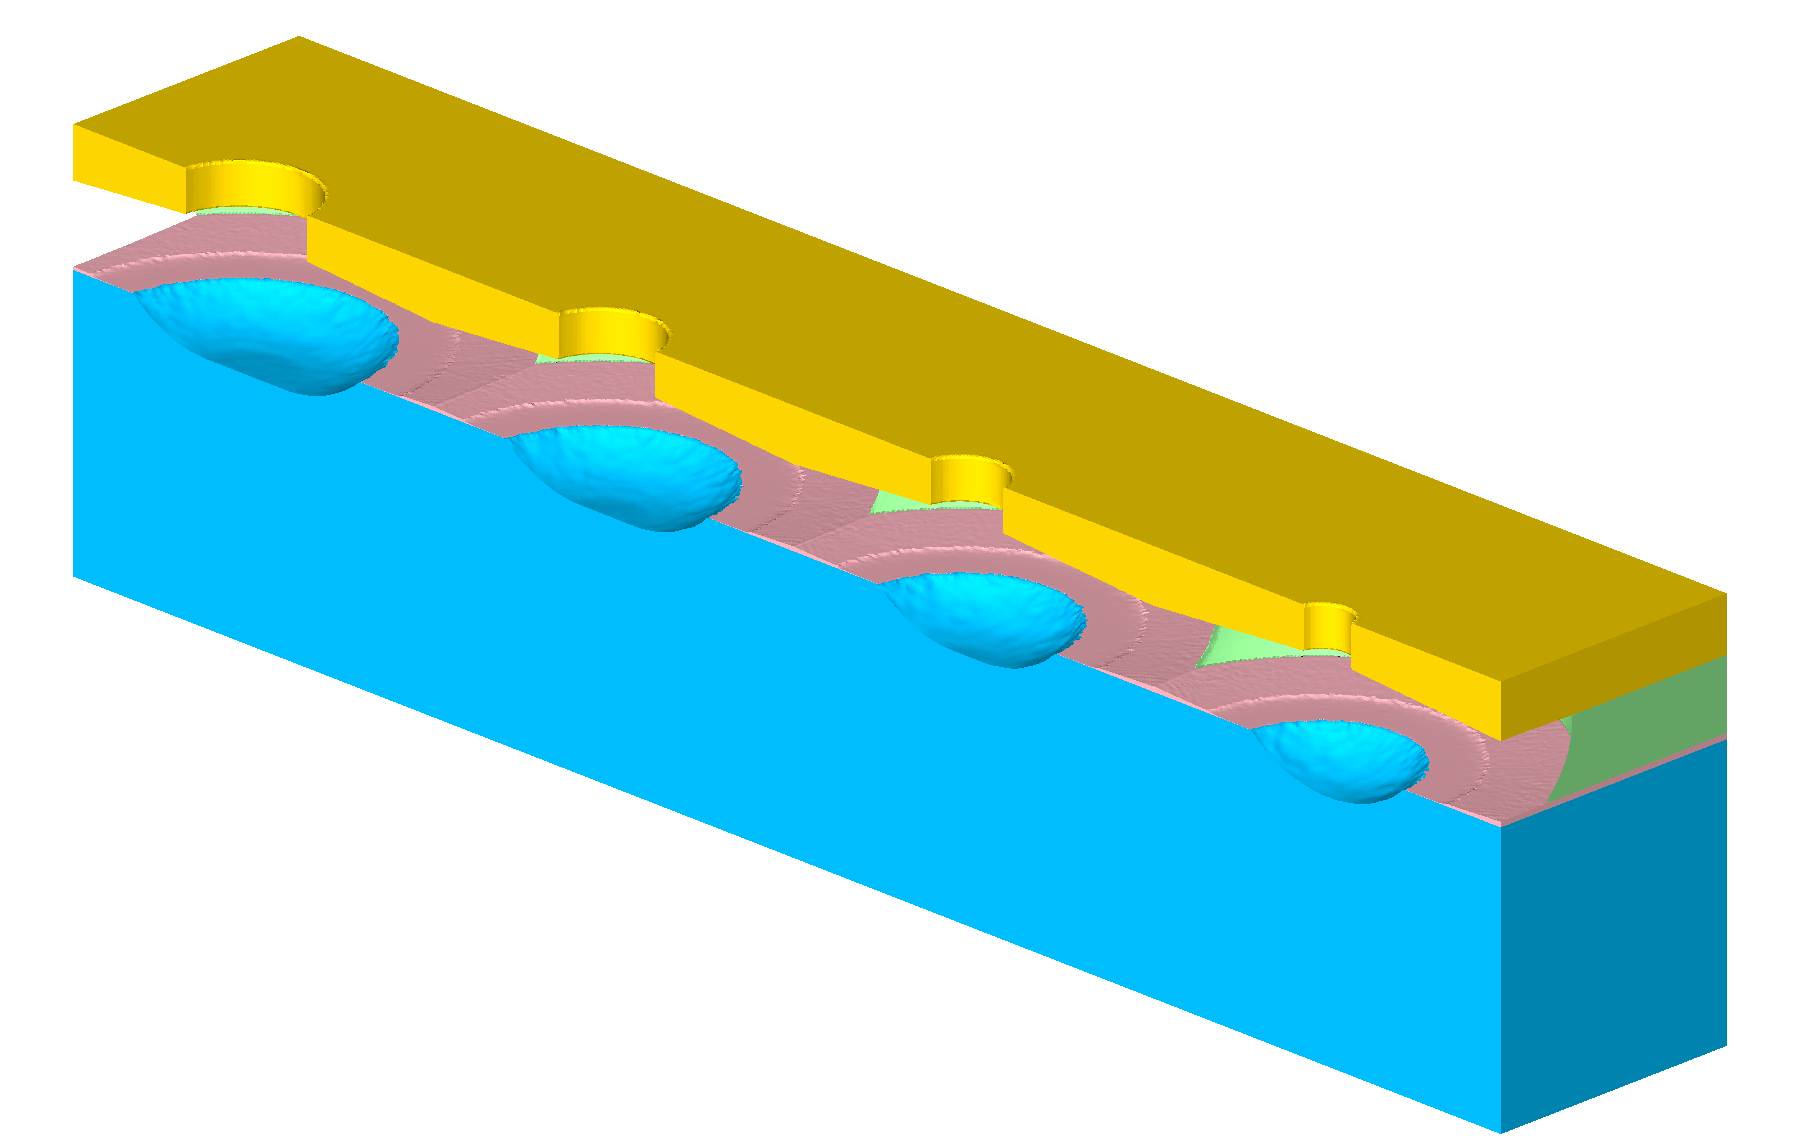
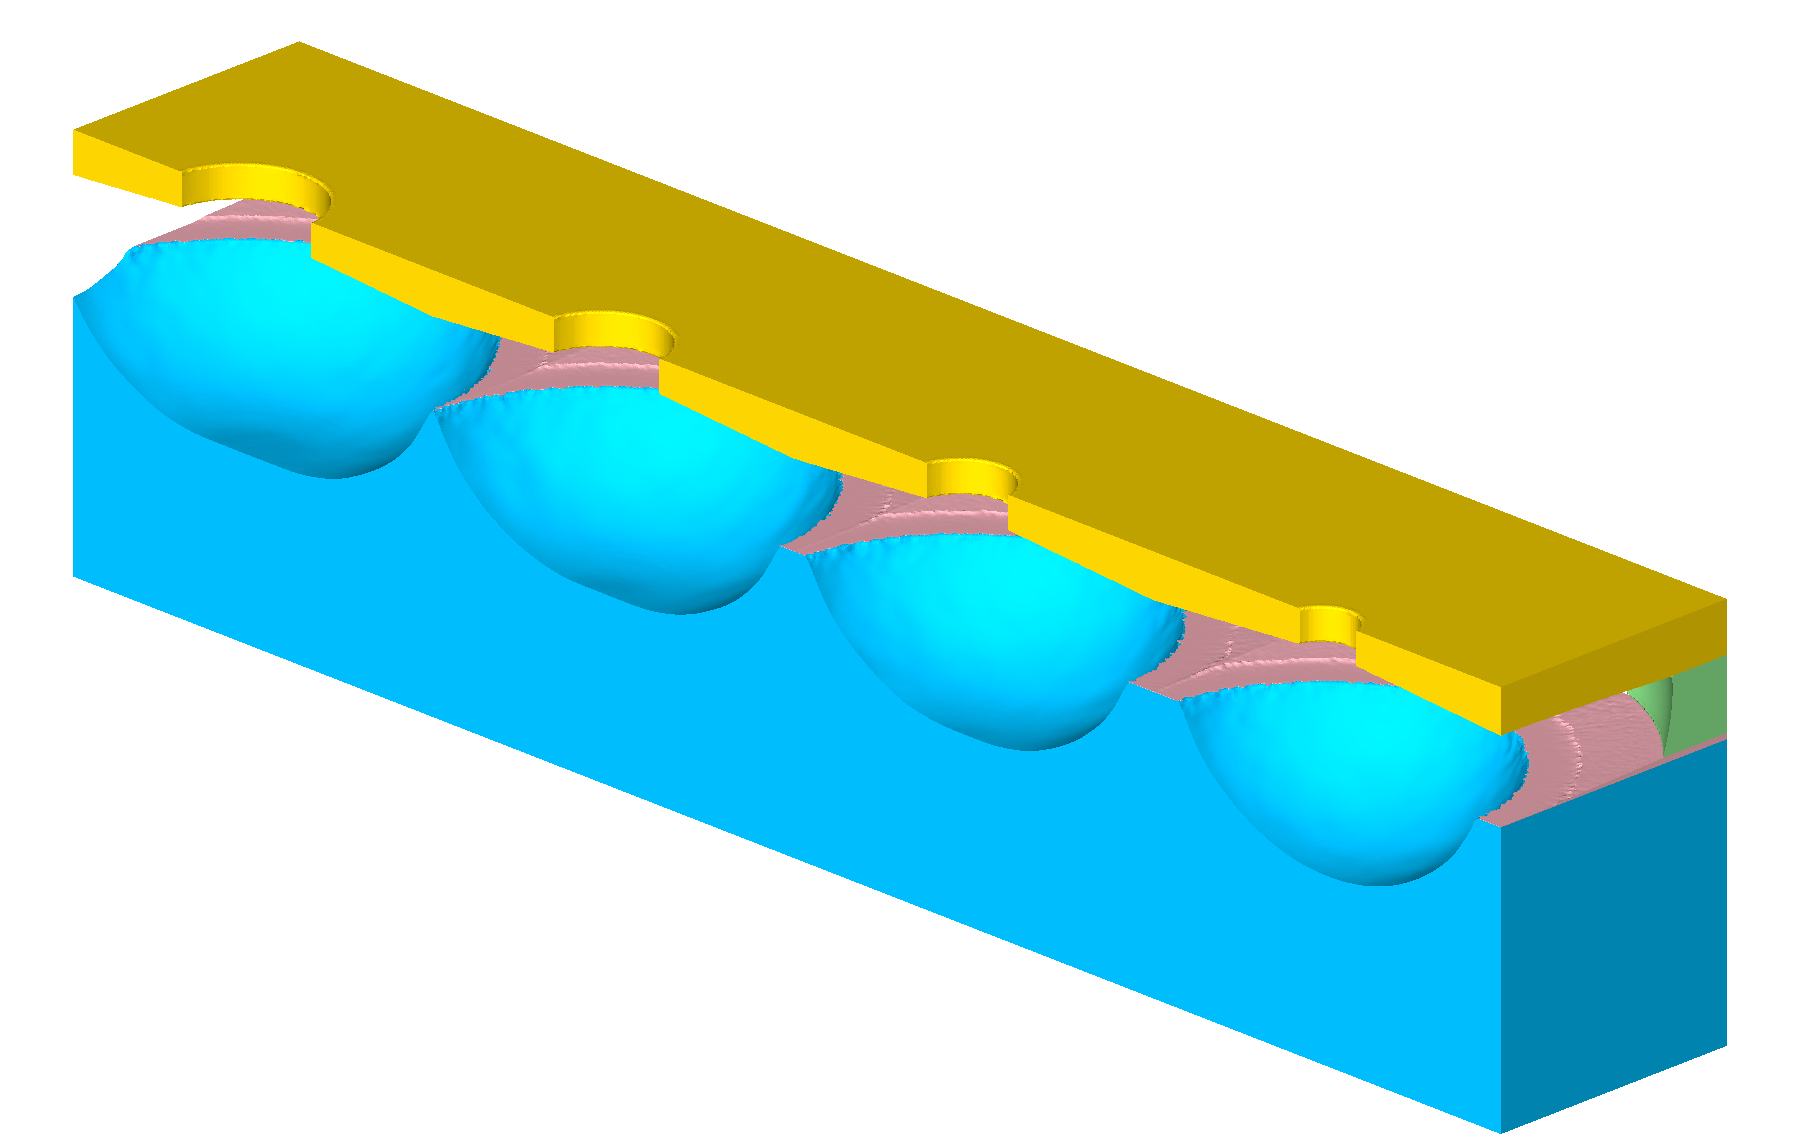
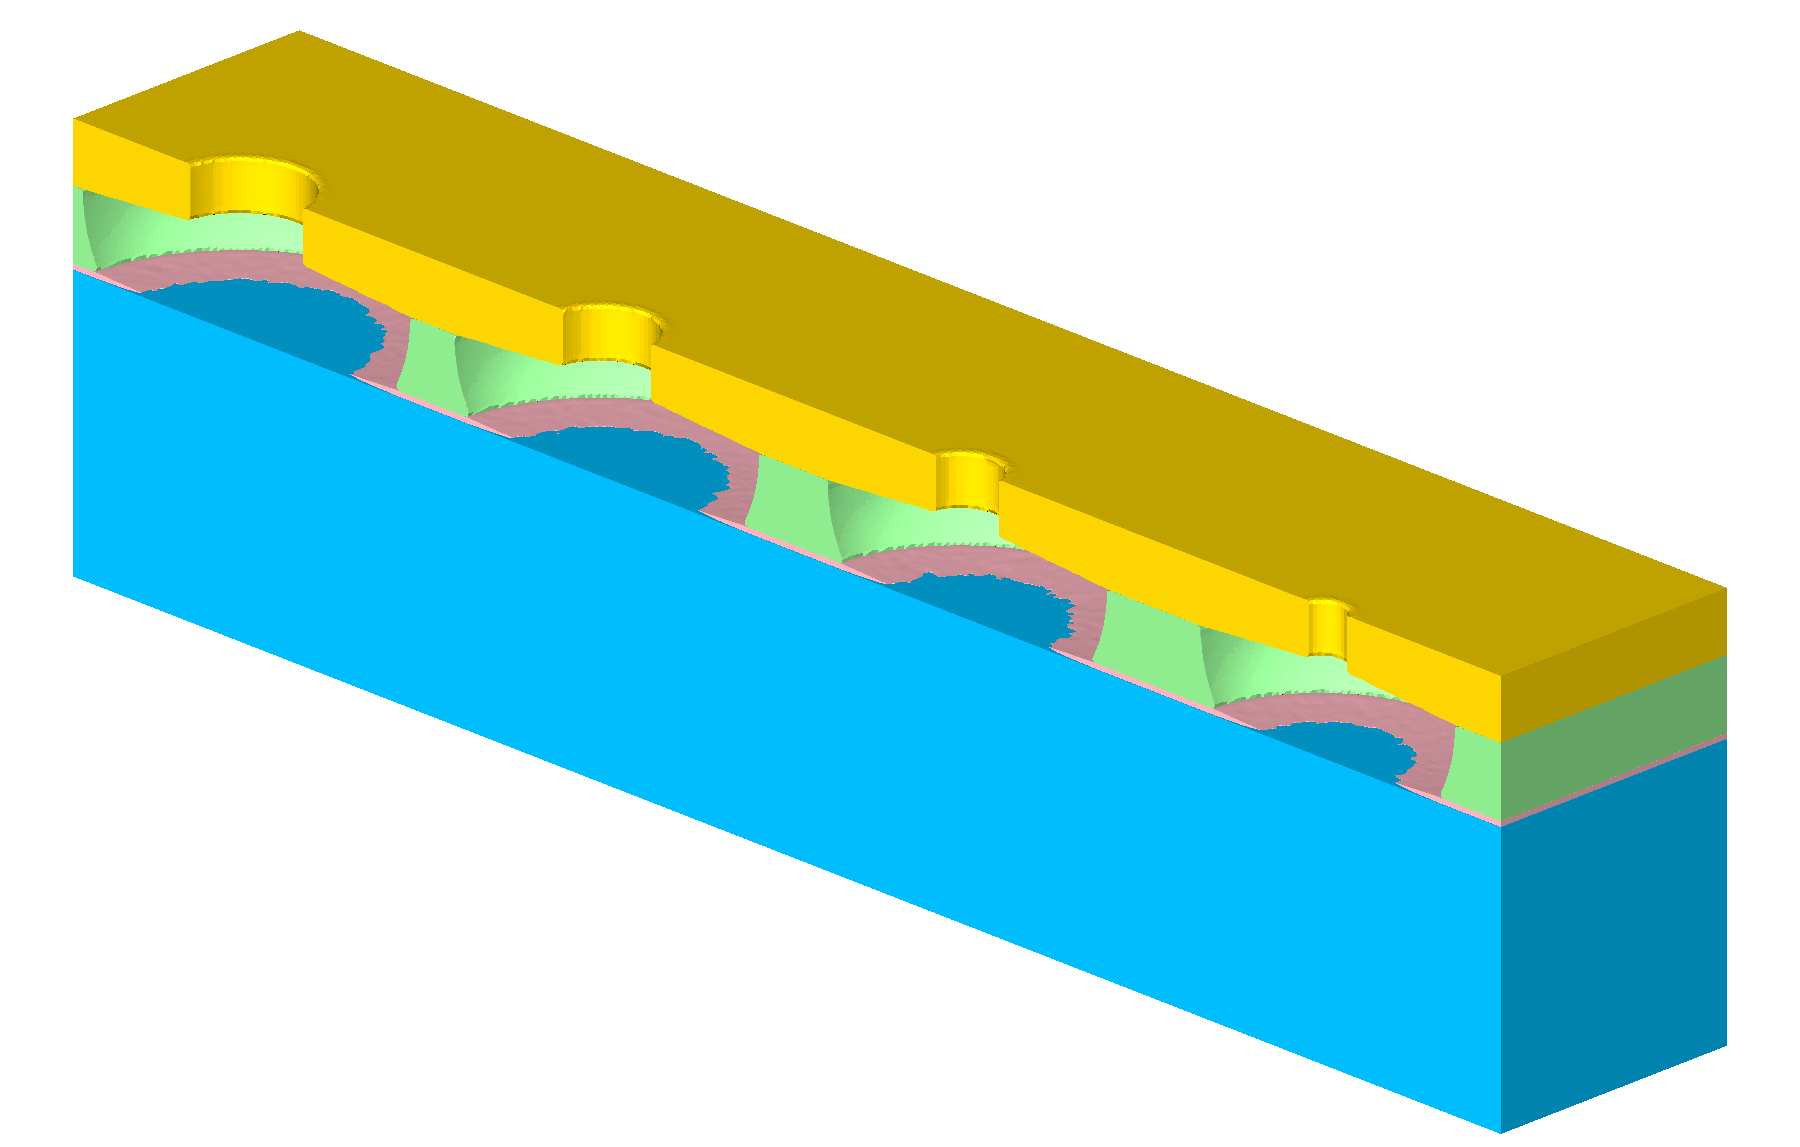
A.2 Material Dependent Isotropic Etching


(a) \( T=0.25 \)


(b) \( T=0.5 \)


(c) \( T=0.75 \)


(d) \( T=1.0 \)

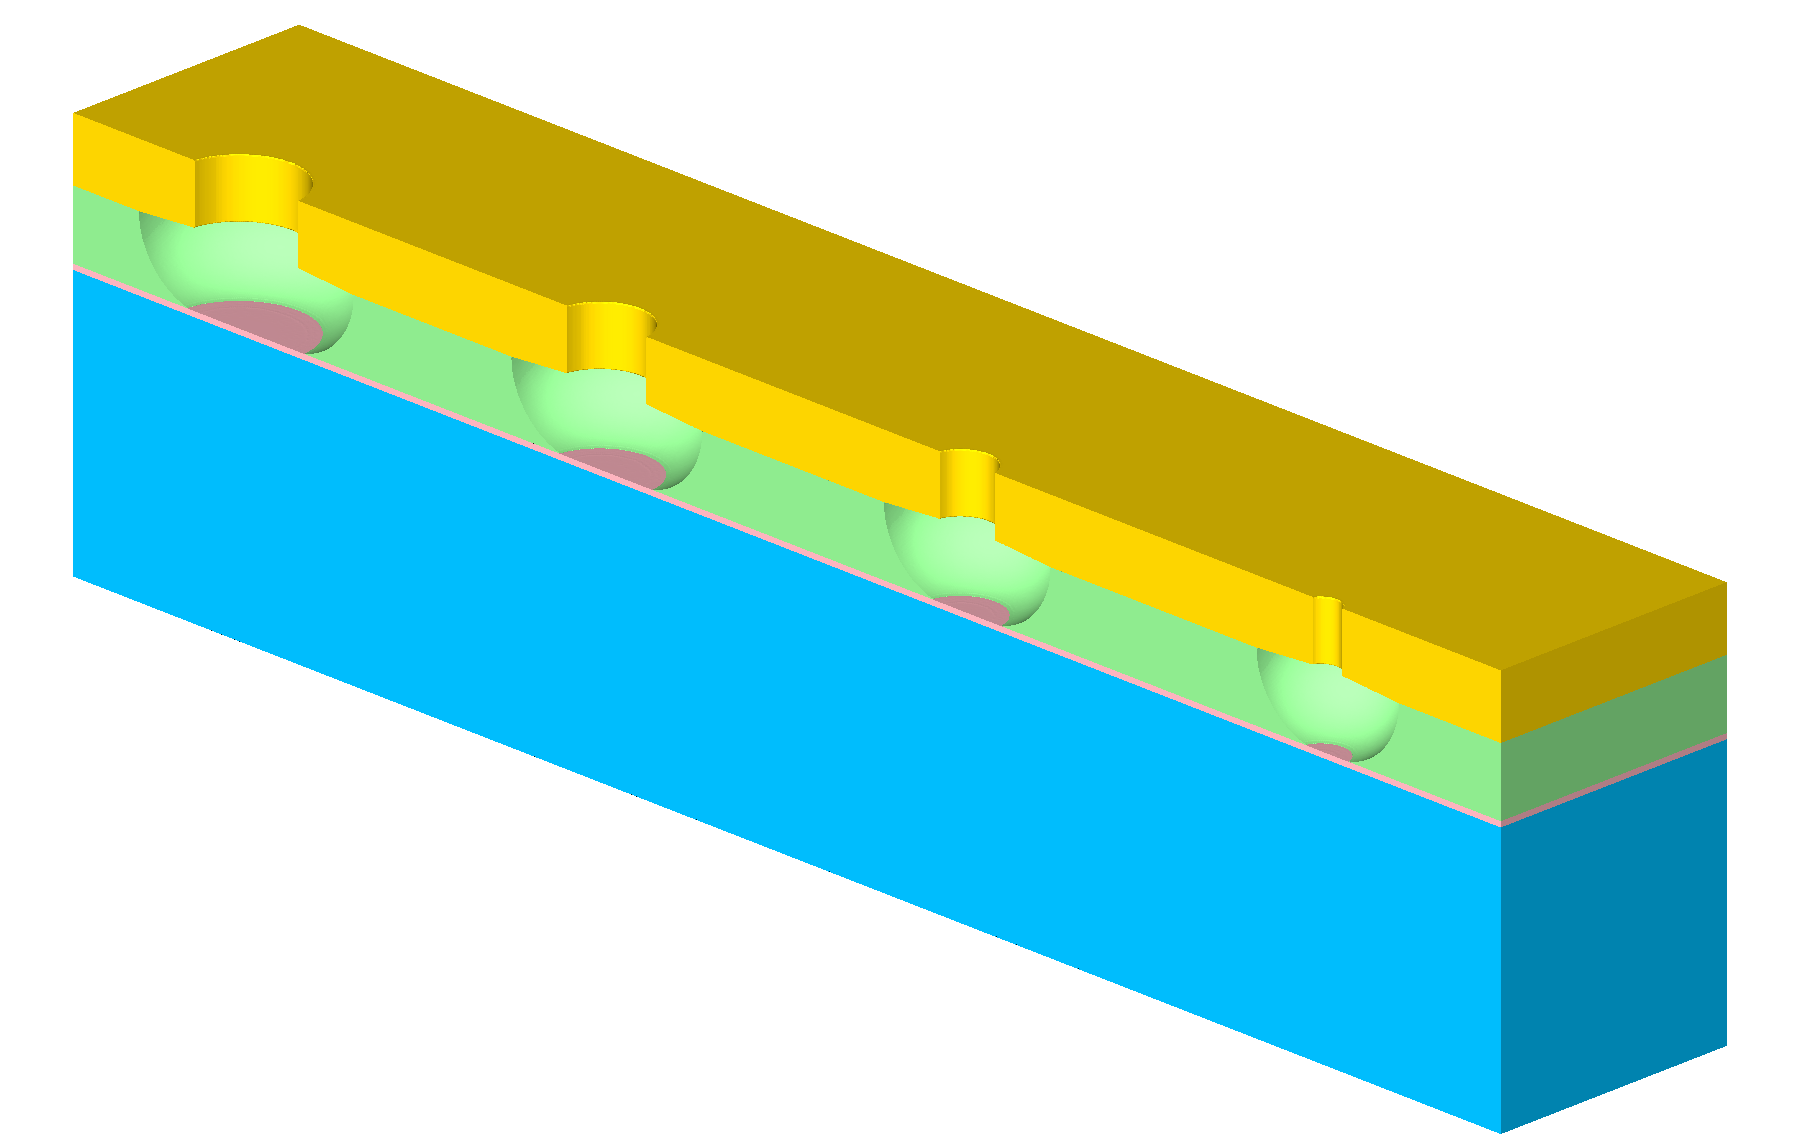
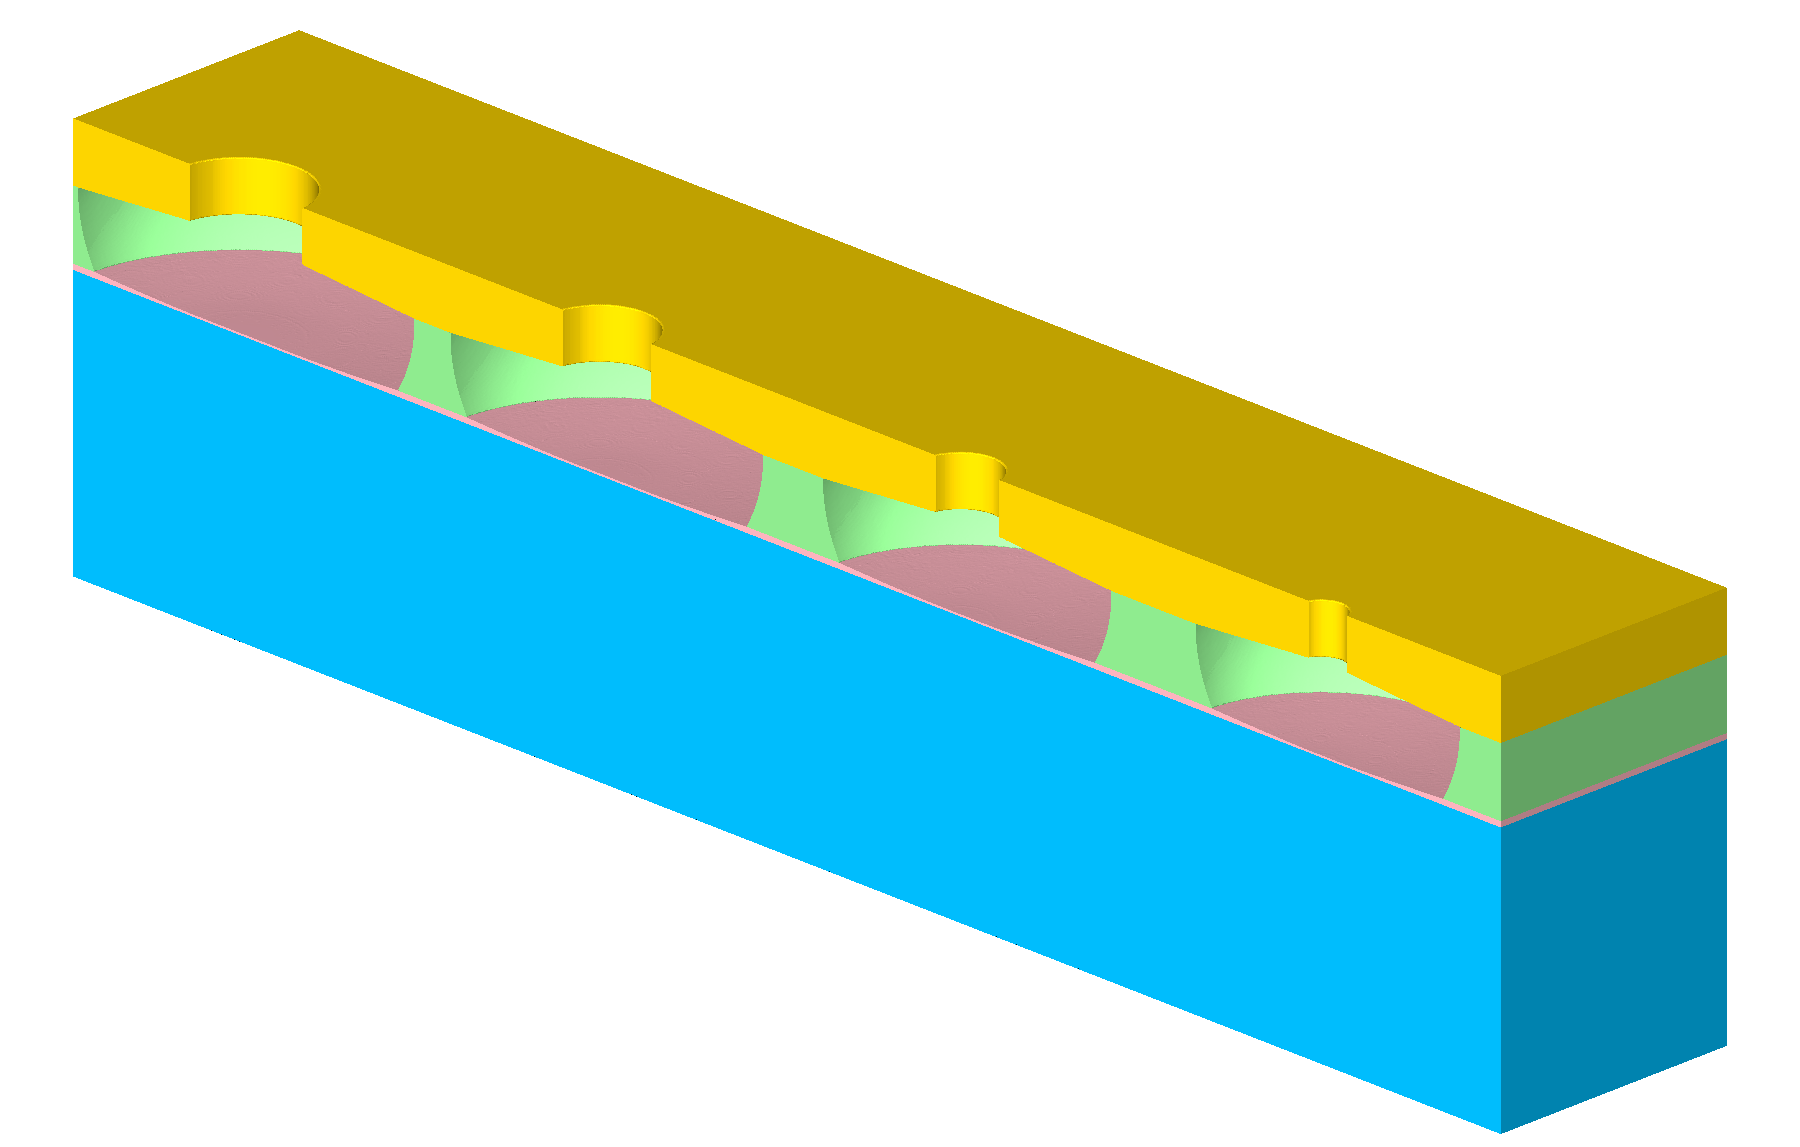
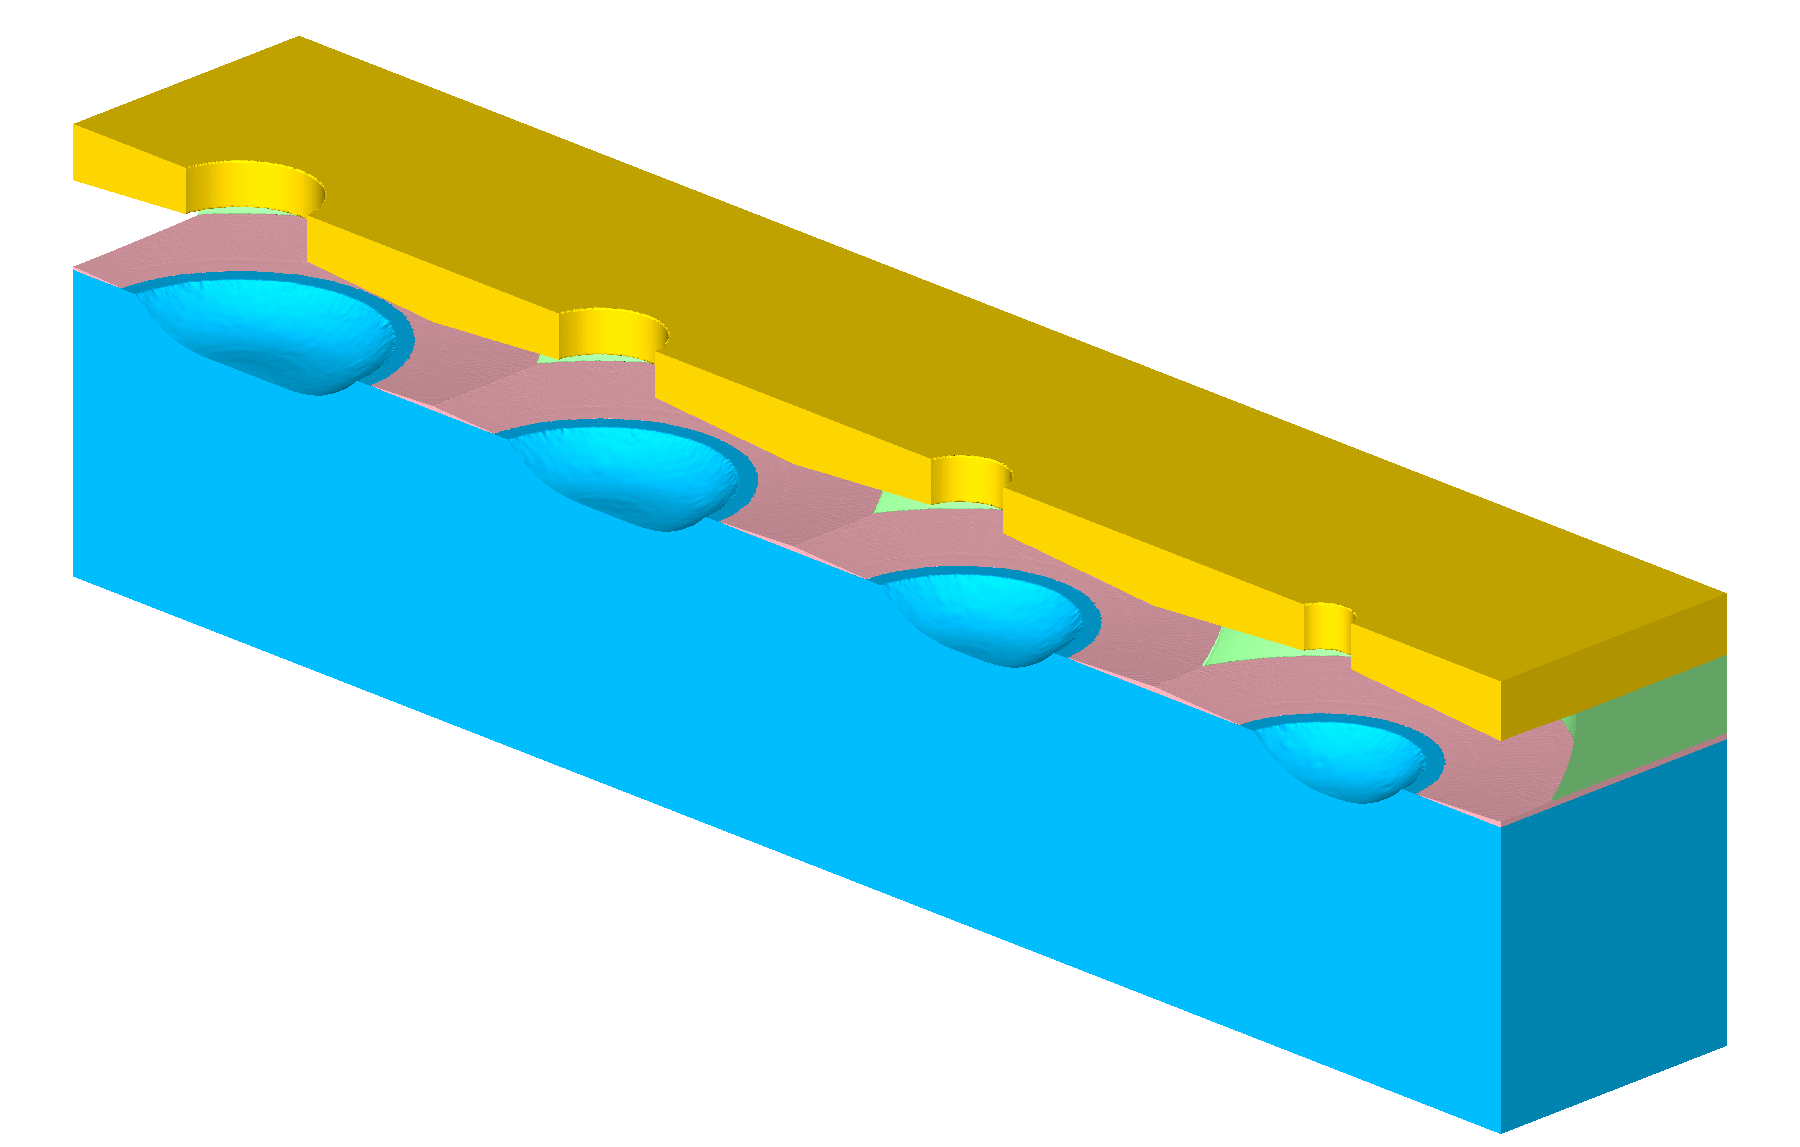
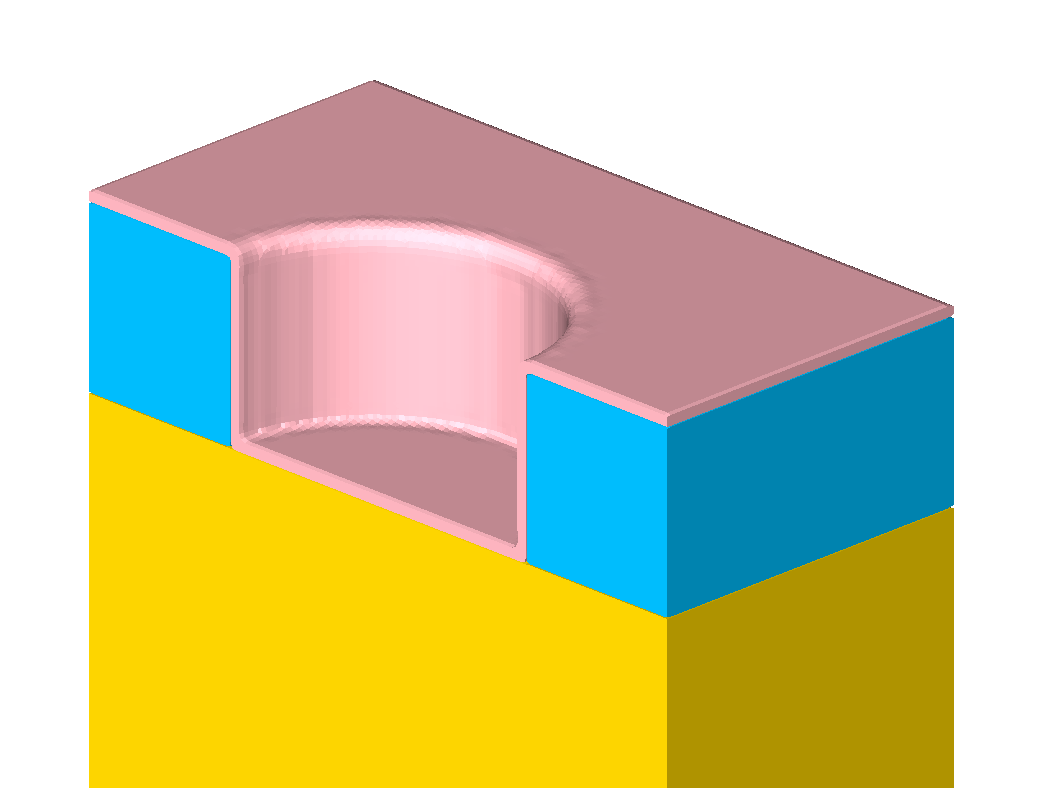
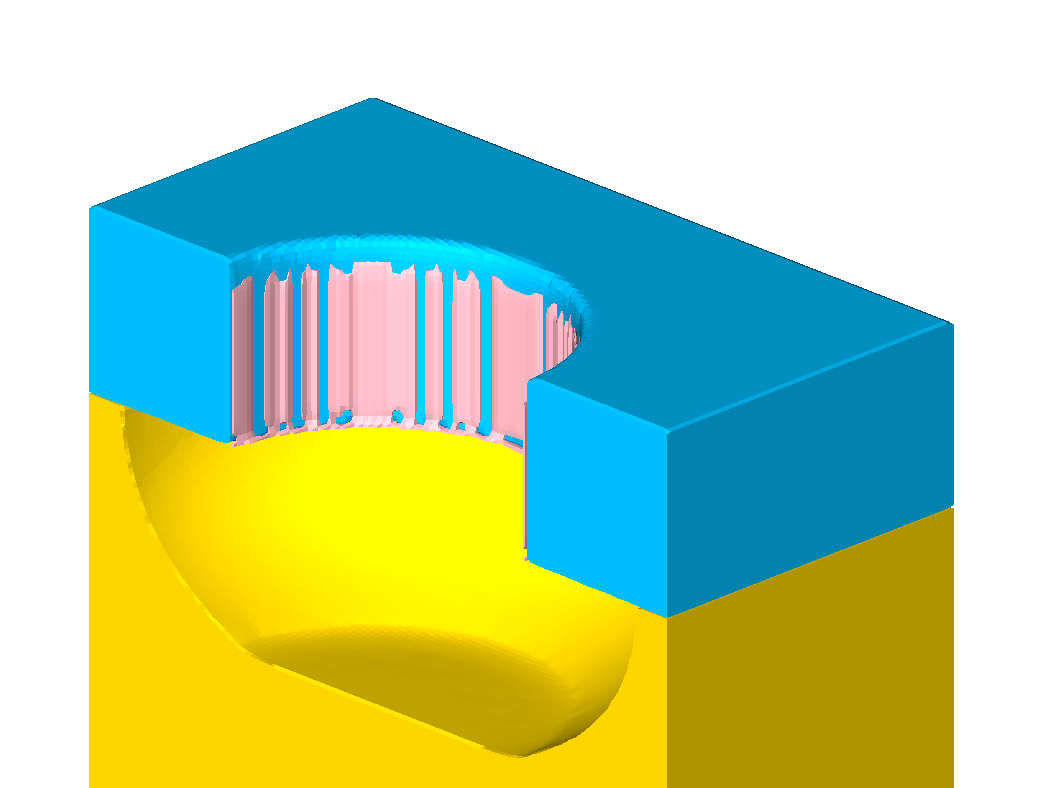
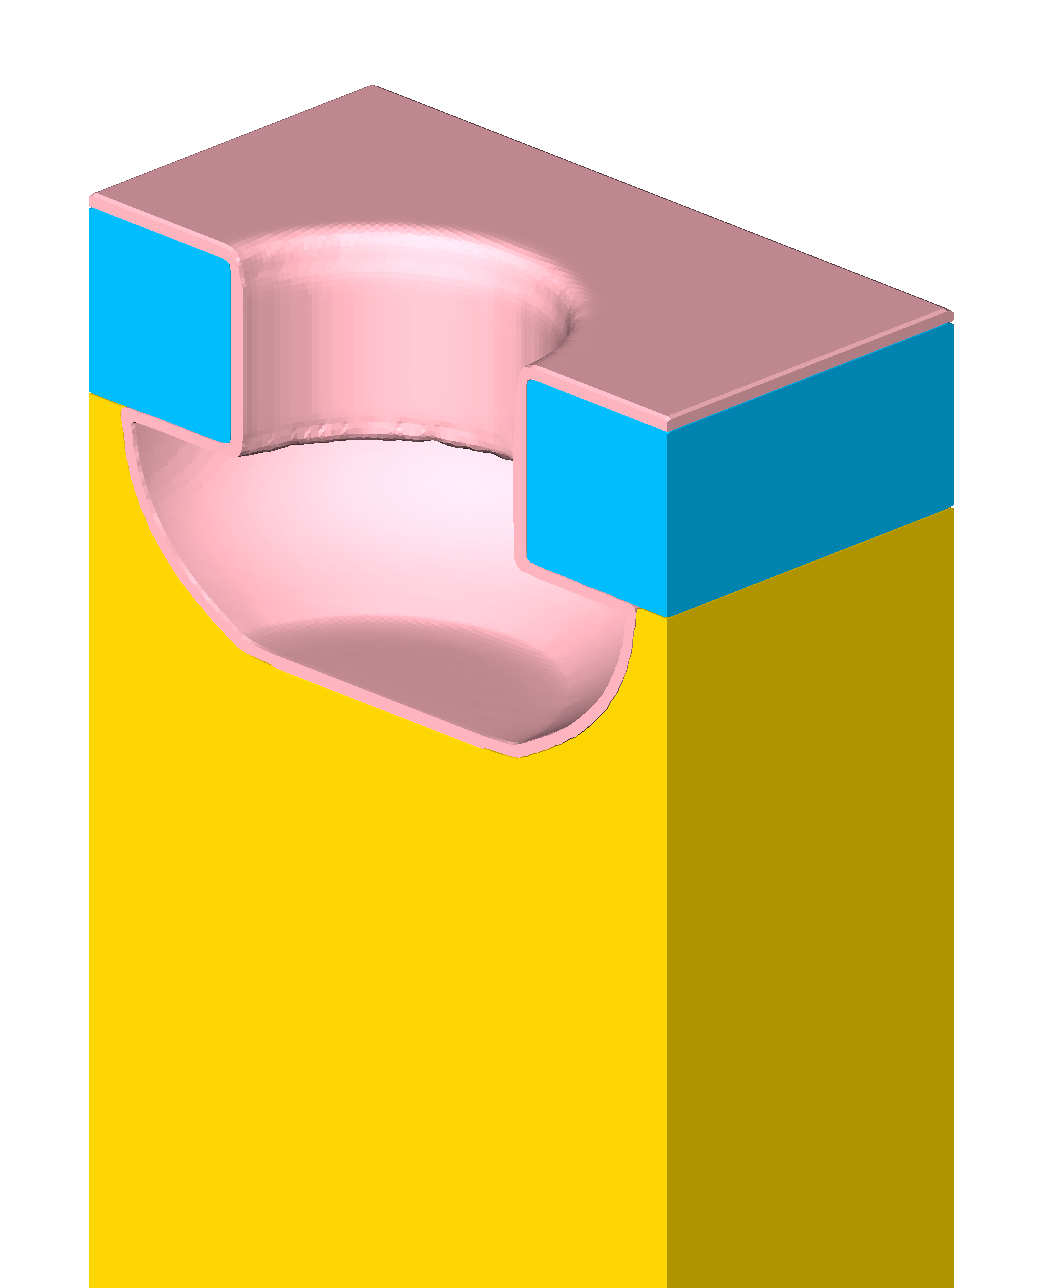
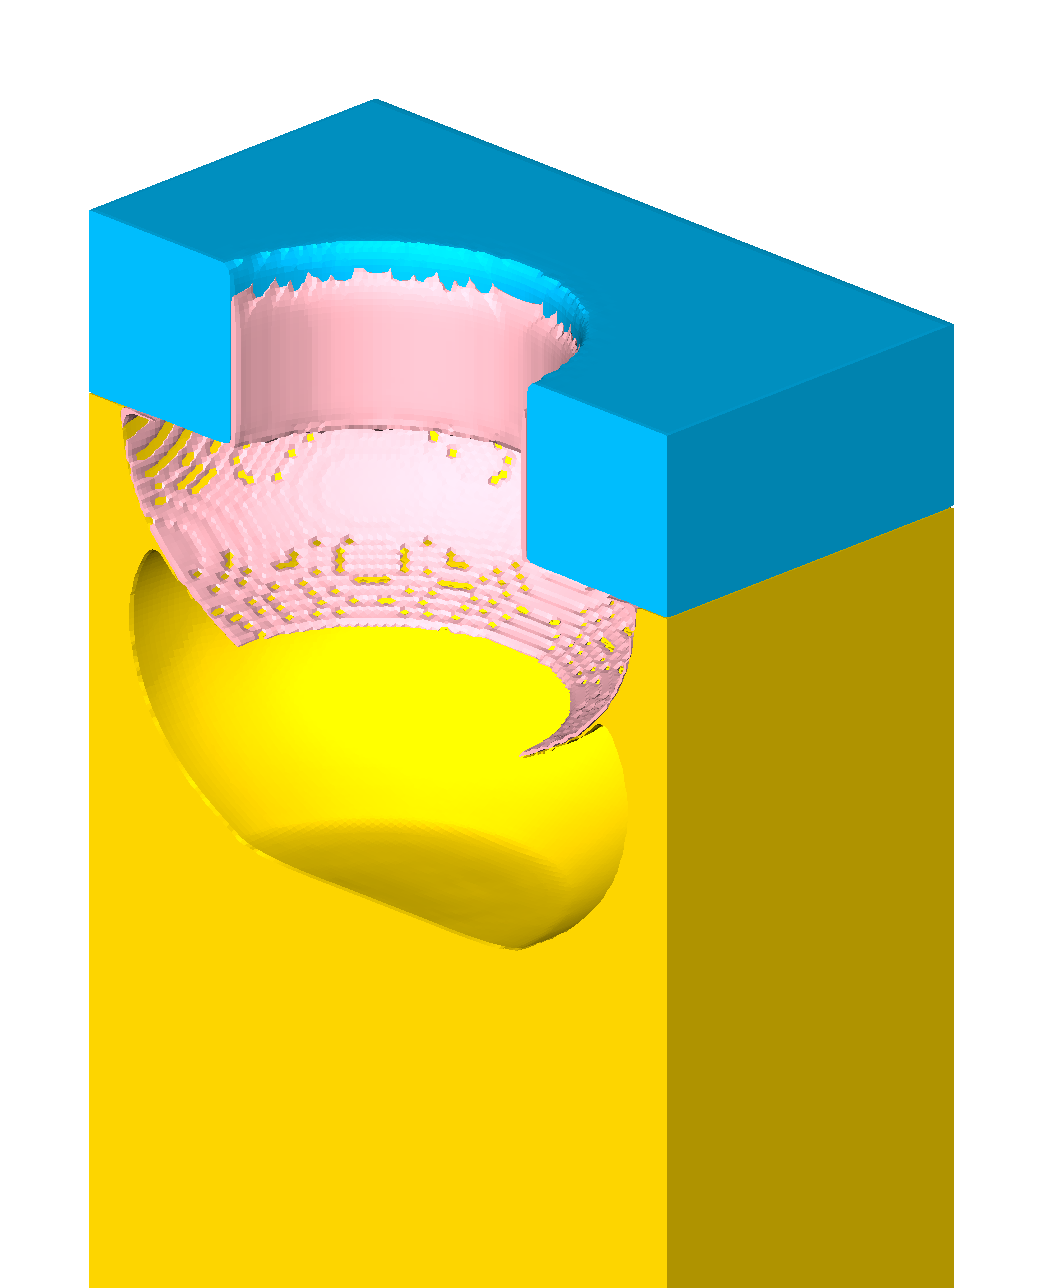
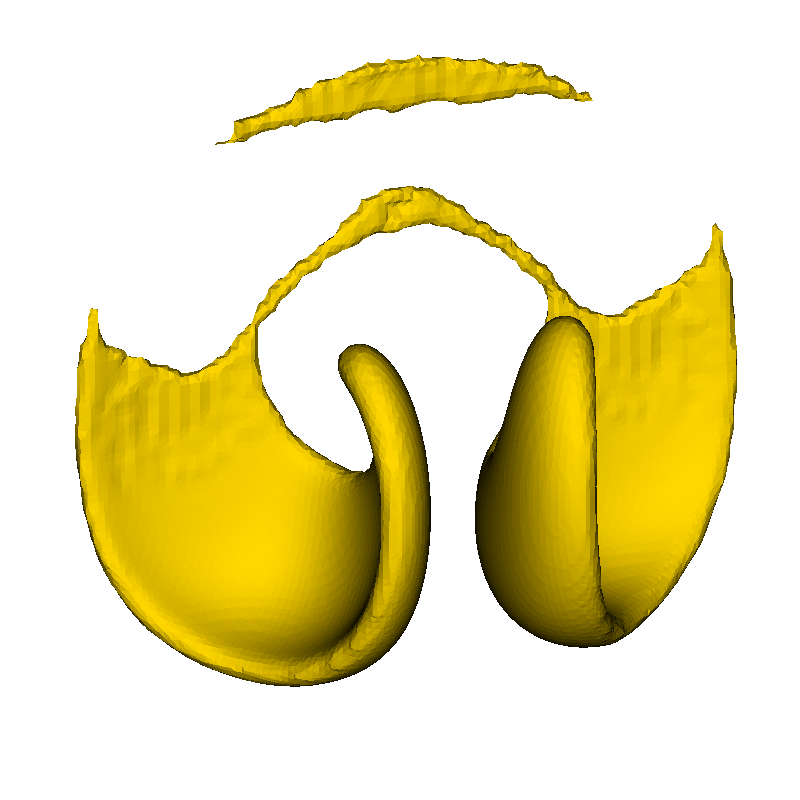
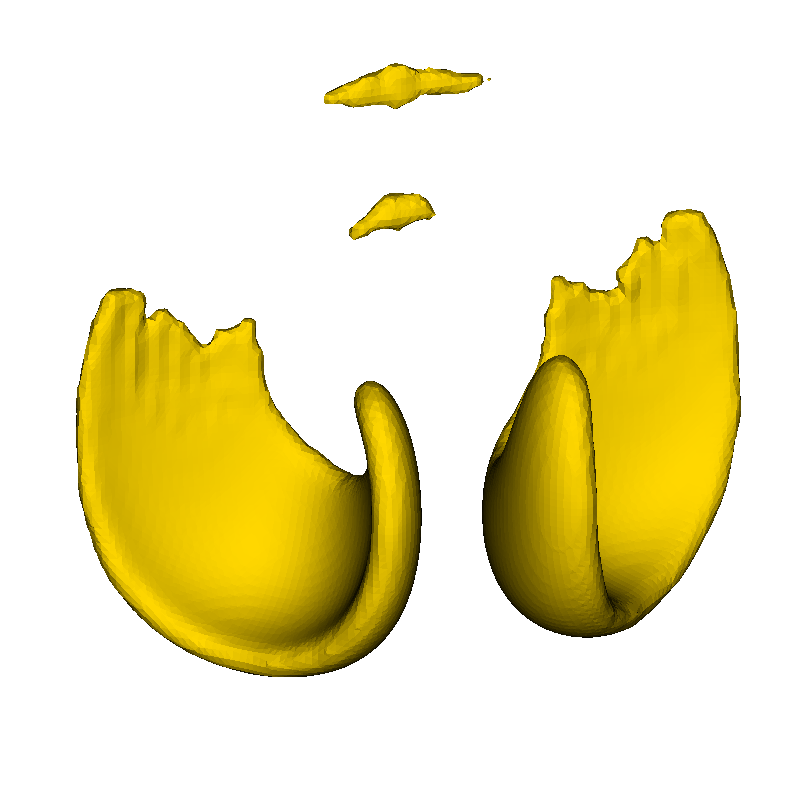
Figure A.5: Extracted material regions for resolution \( 1/256 \) at \( T=0.25,0.5,0.75 \), and \( 1.0 \). Regions thinner than one grid cell potentially vanish during the Boolean operations between the level-sets, which is visible in (c) and (d) near the edge of the crater in the blue material. The same results for
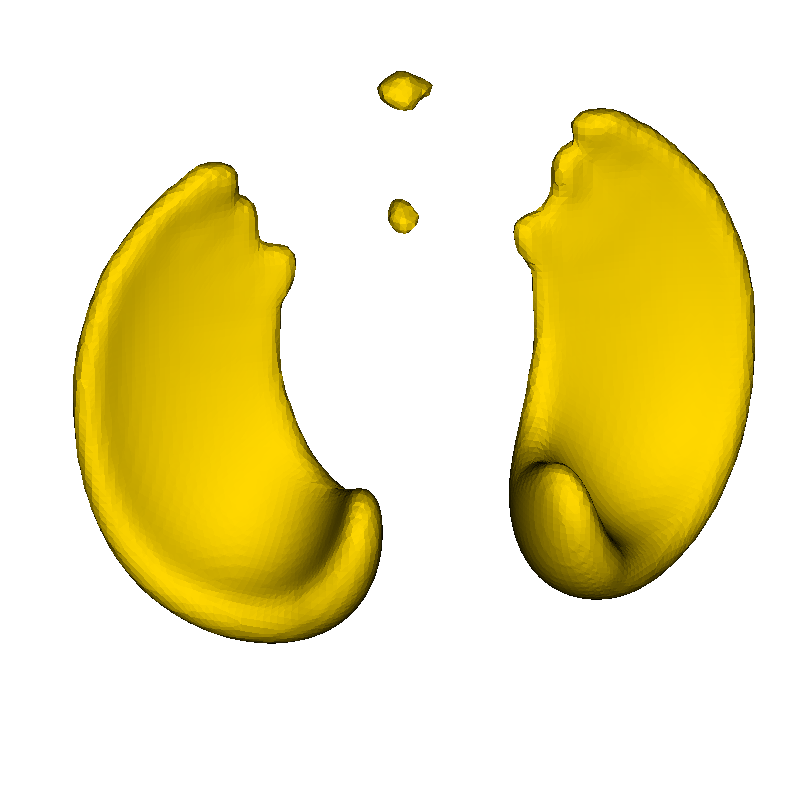
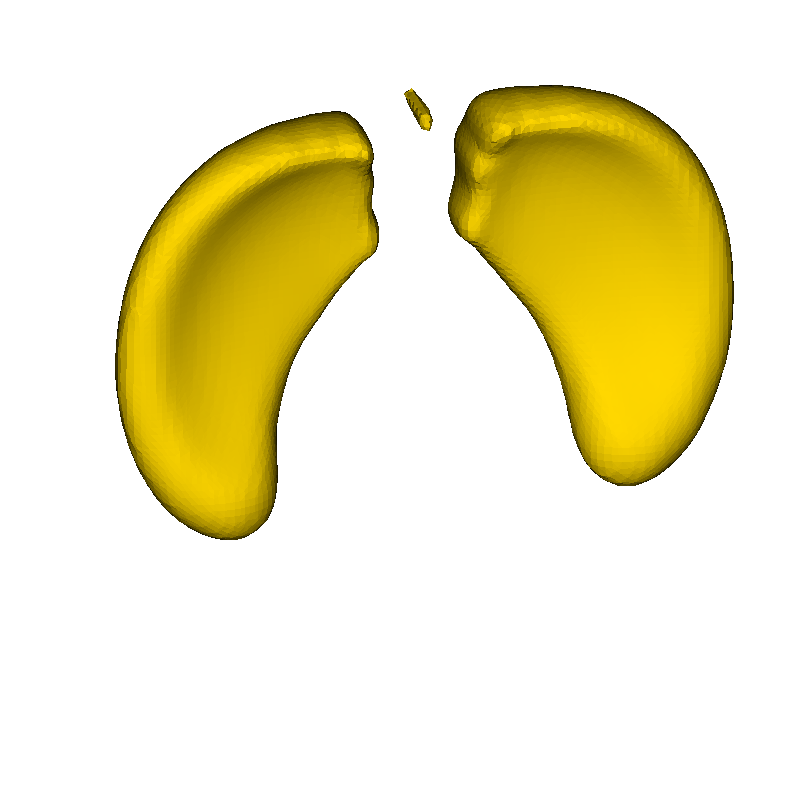
 resolutions \( 1/128 \) and \( 1/64 \) are provided in Figures A.6 and A.7.


(a) \( T=0.25 \)


(b) \( T=0.5 \)


(c) \( T=0.75 \)


(d) \( T=1.0 \)

Figure A.6: Extracted material regions at \( T=0.25,0.5,0.75 \), and \( 1.0 \) for resolution \( 1/128 \).


(a) \( T=0.25 \)


(b) \( T=0.5 \)


(c) \( T=0.75 \)


(d) \( T=1.0 \)

Figure A.7: Extracted material regions at \( T=0.25,0.5,0.75 \), and \( 1.0 \) for resolution \( 1/64 \).

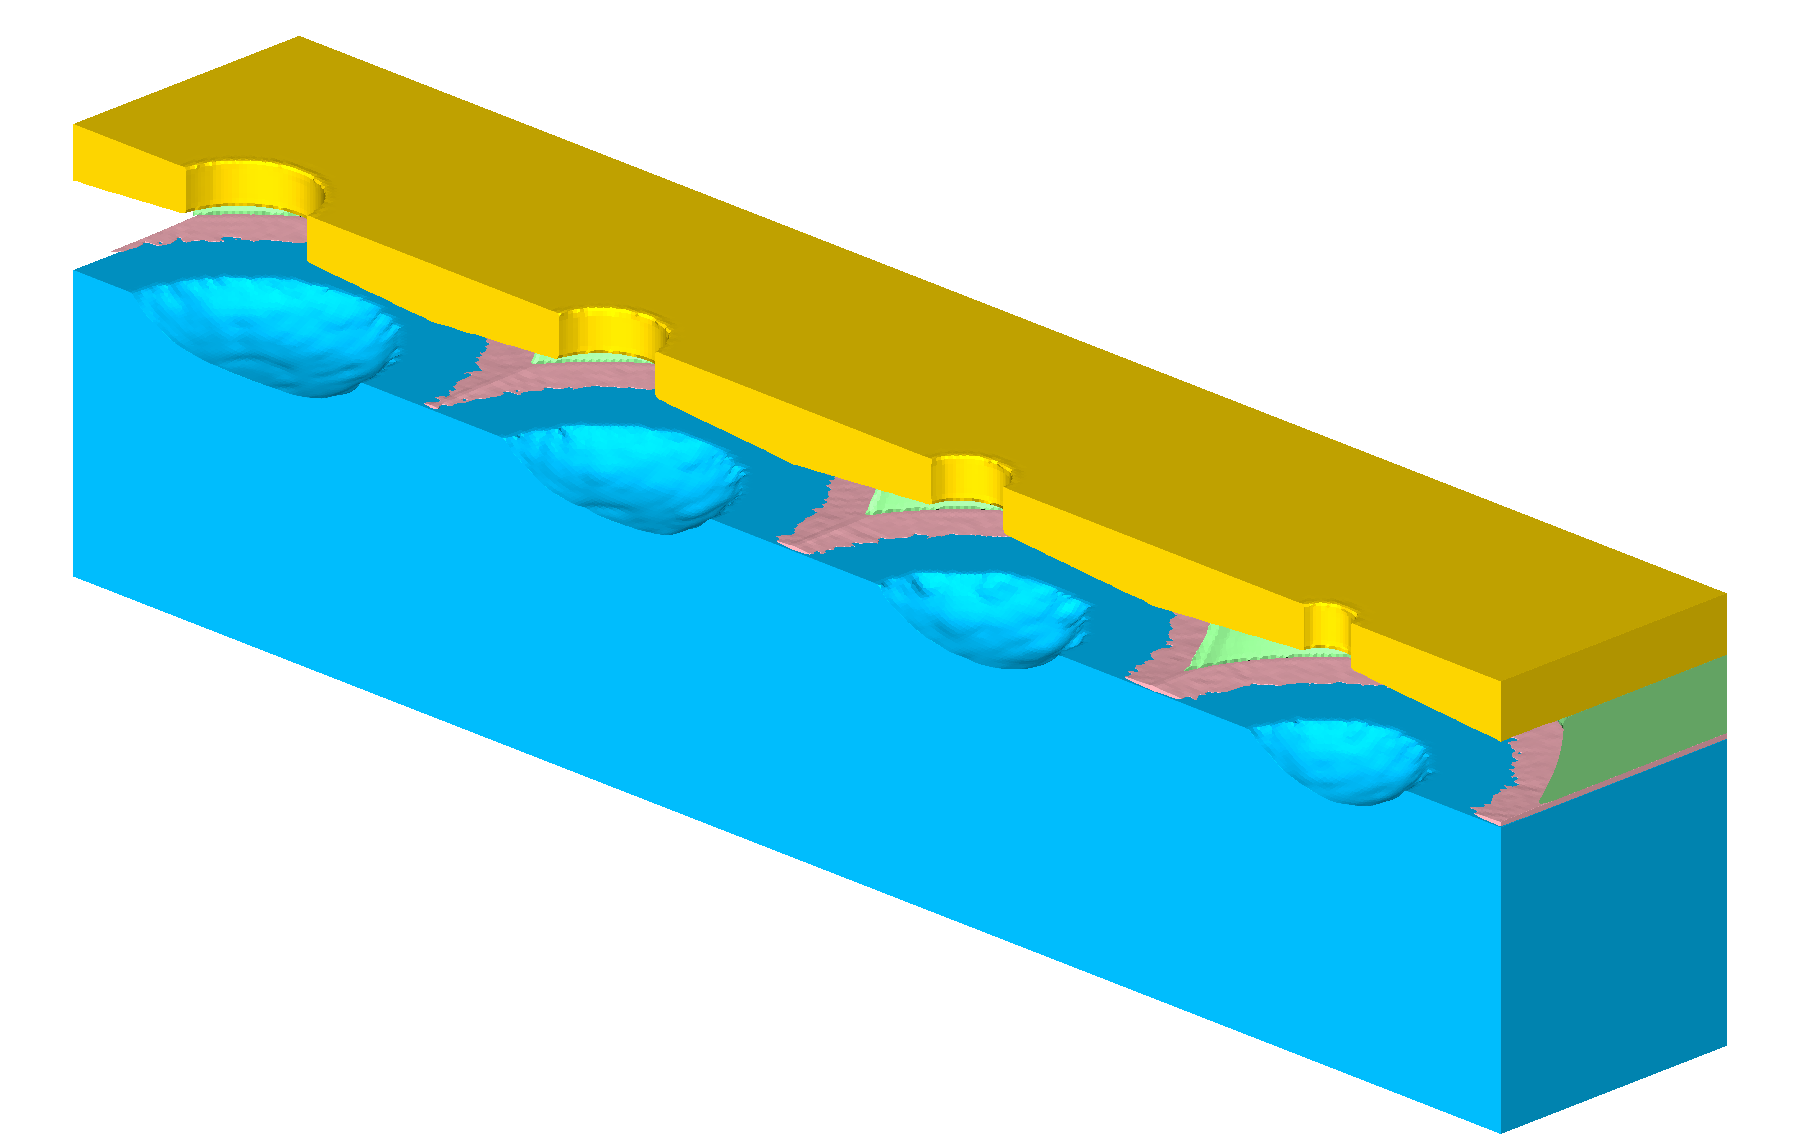
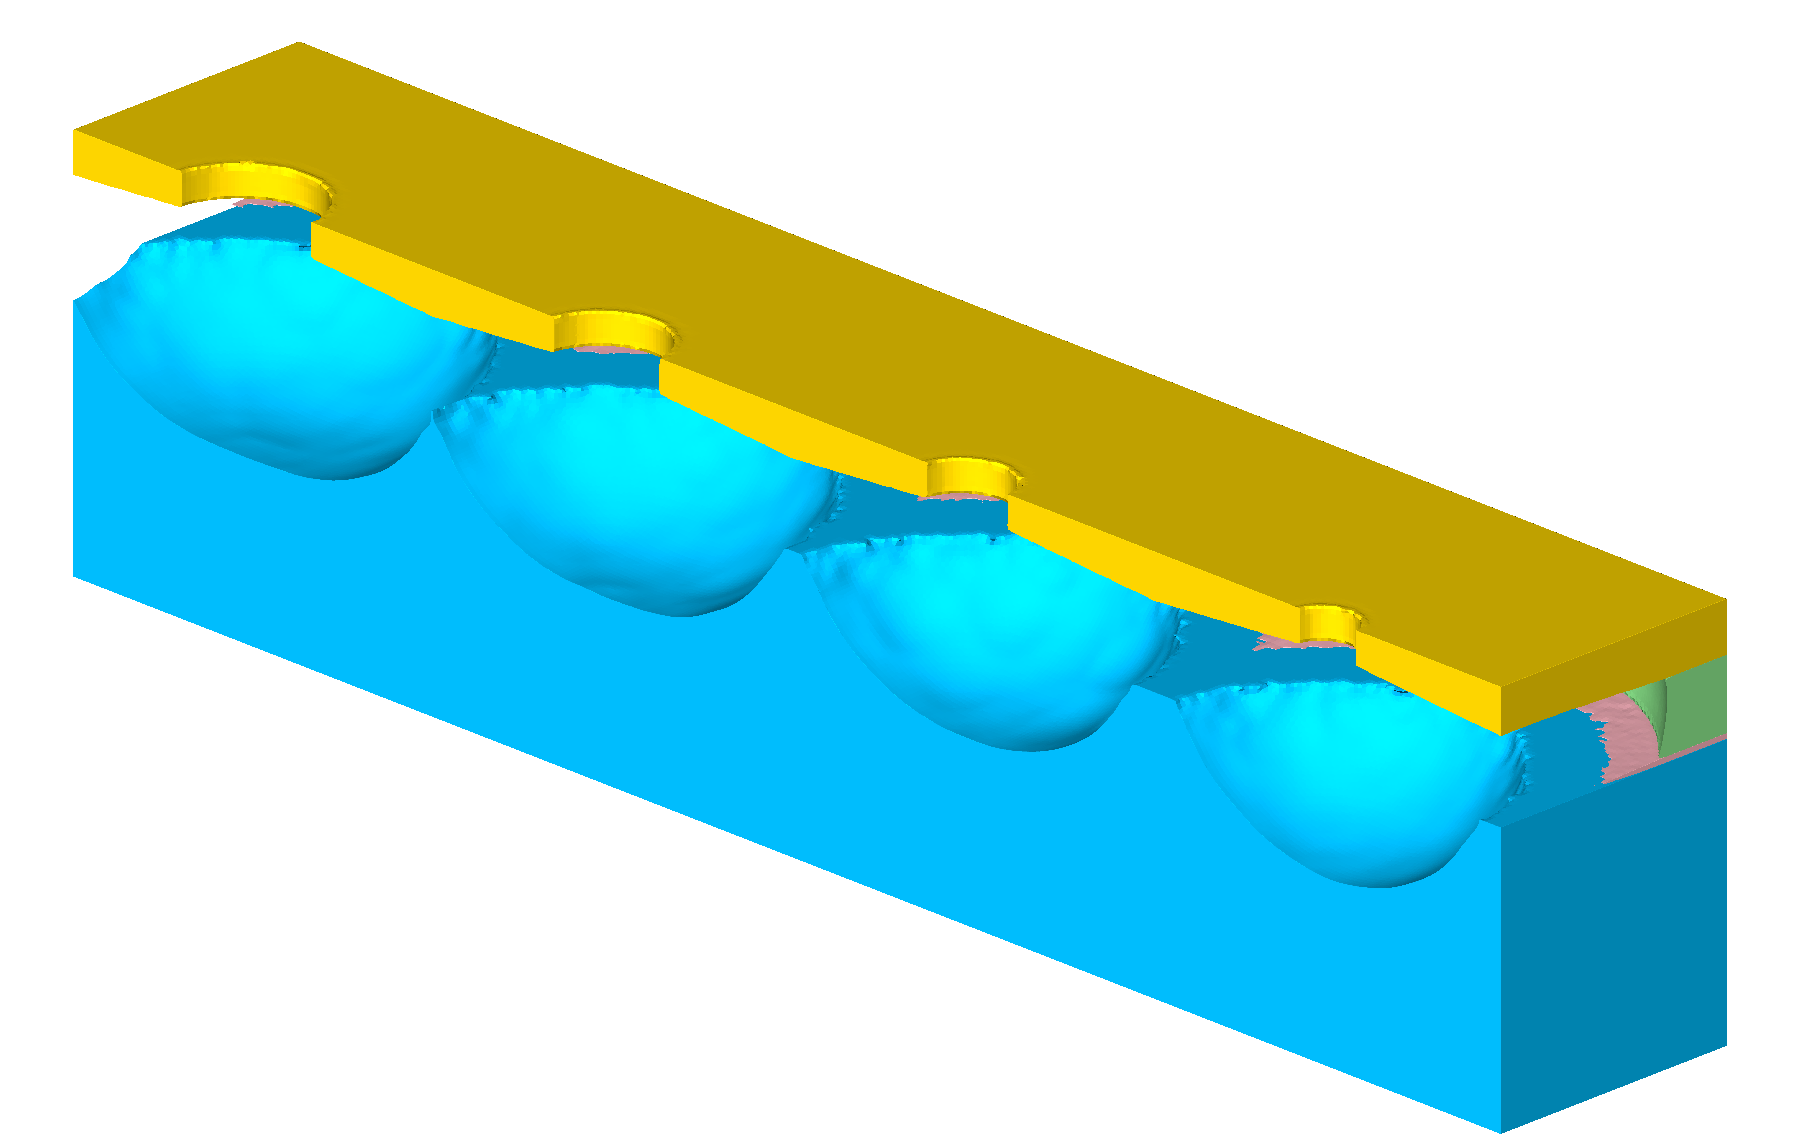
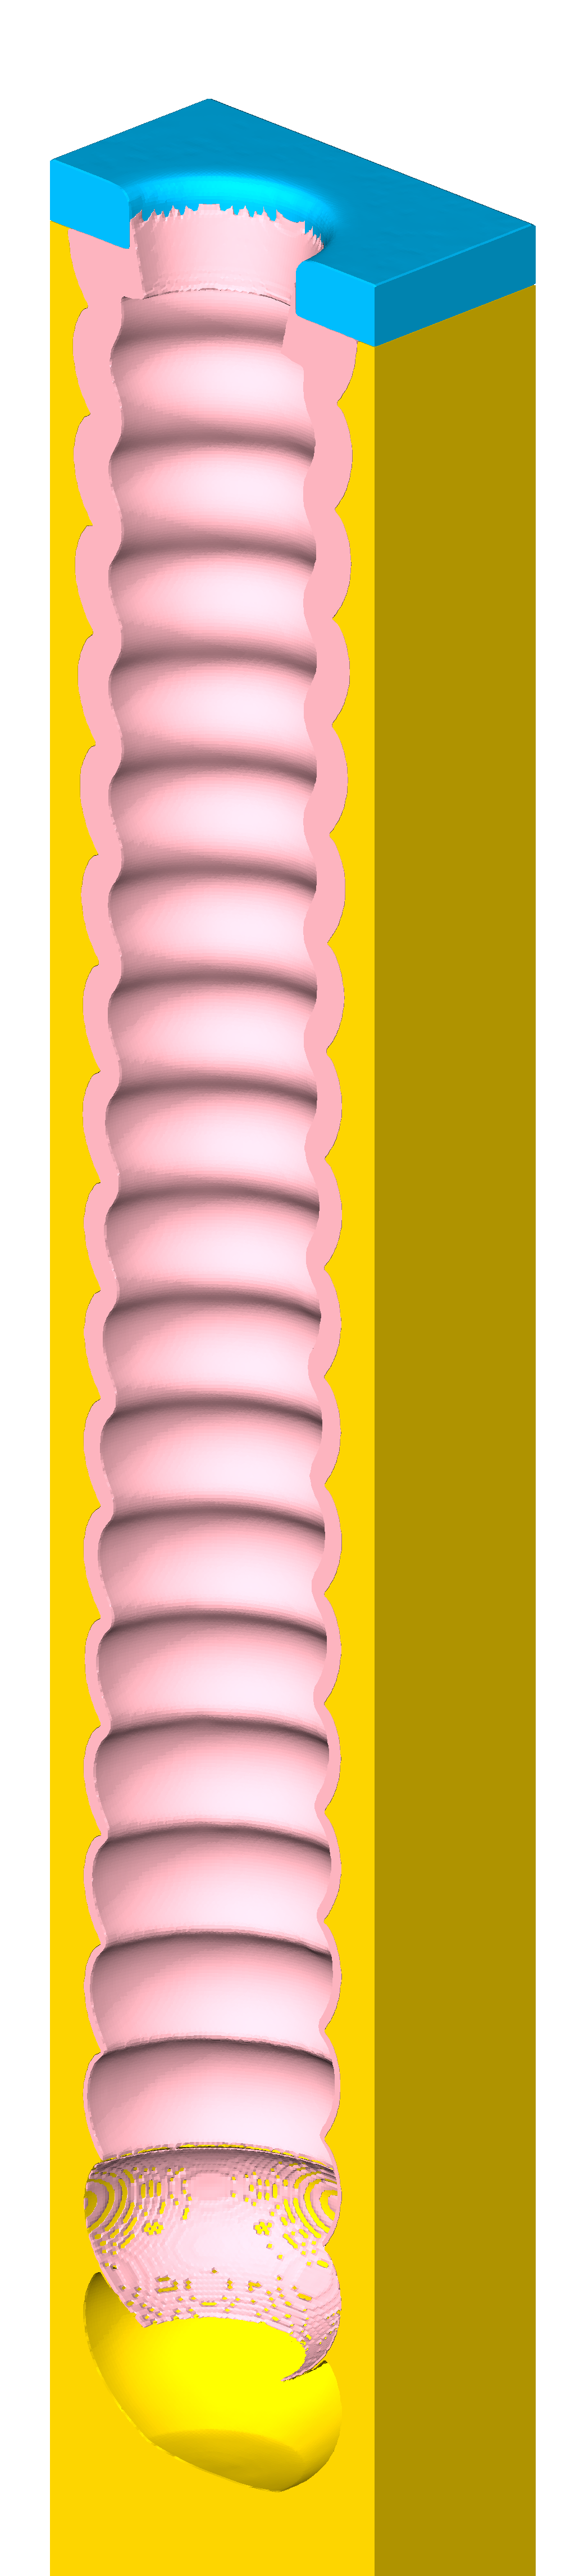
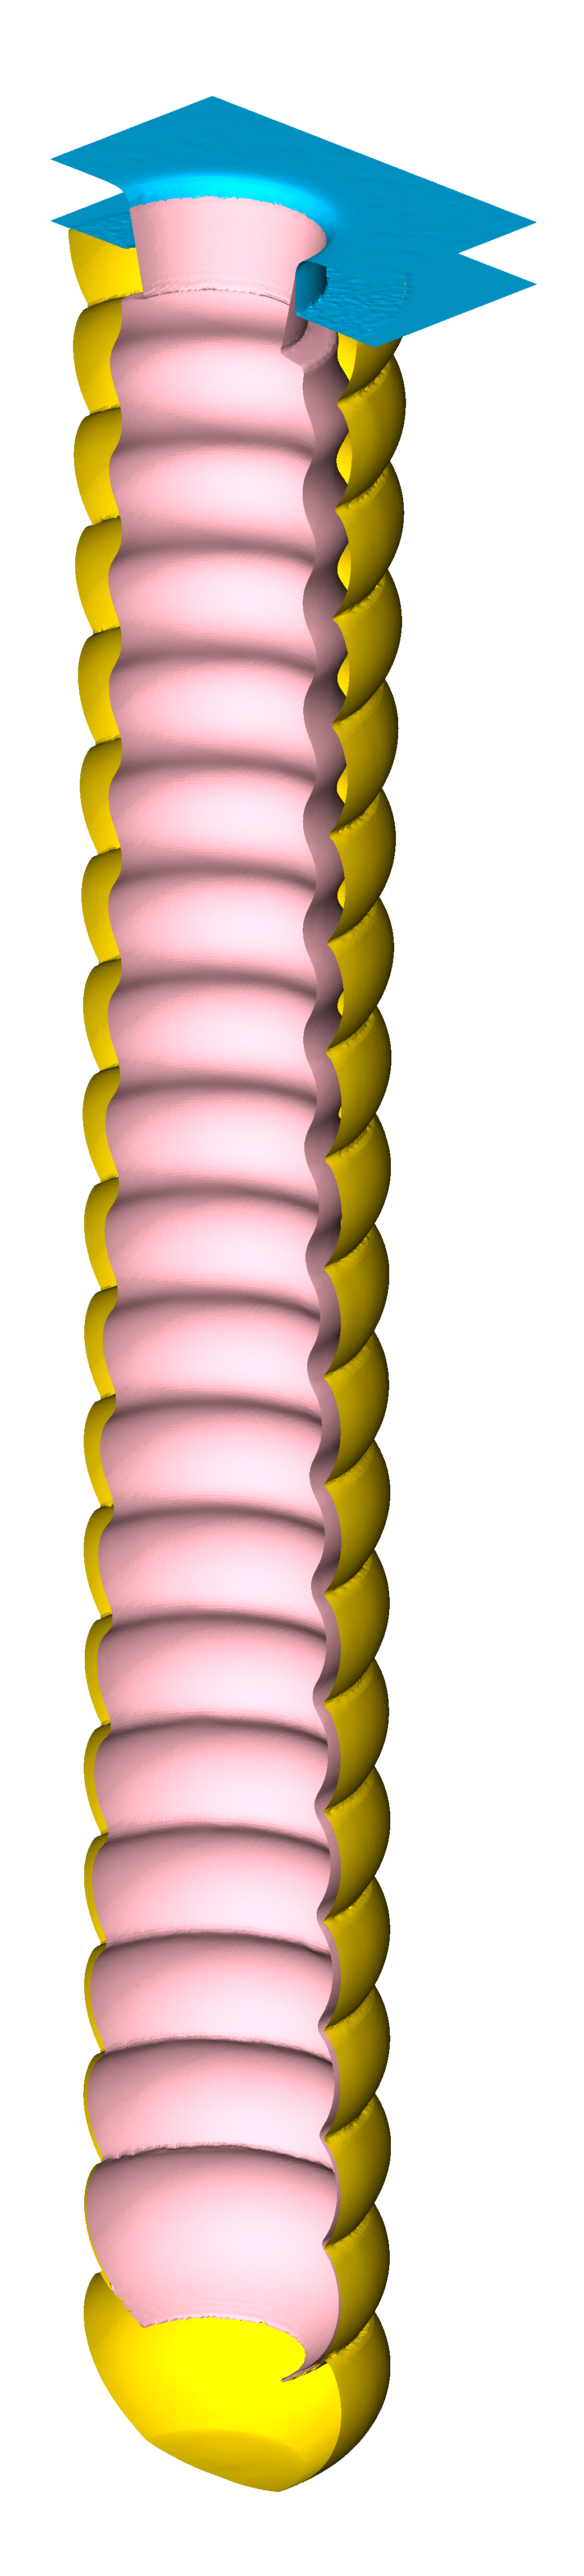
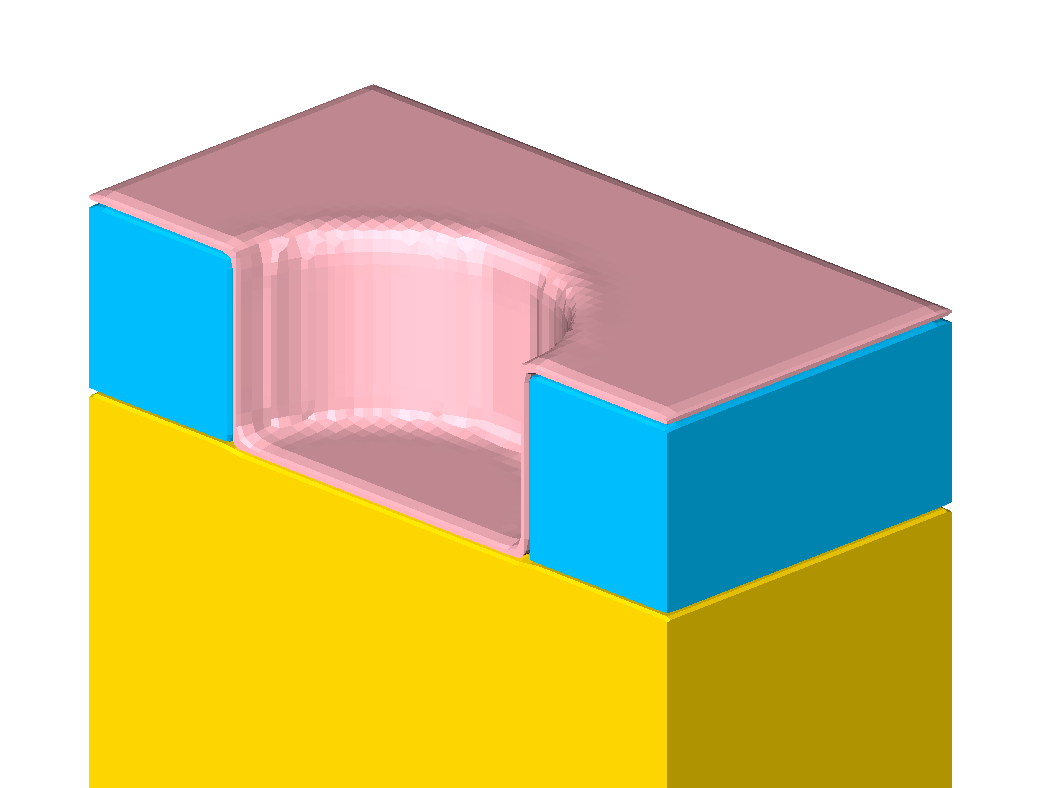
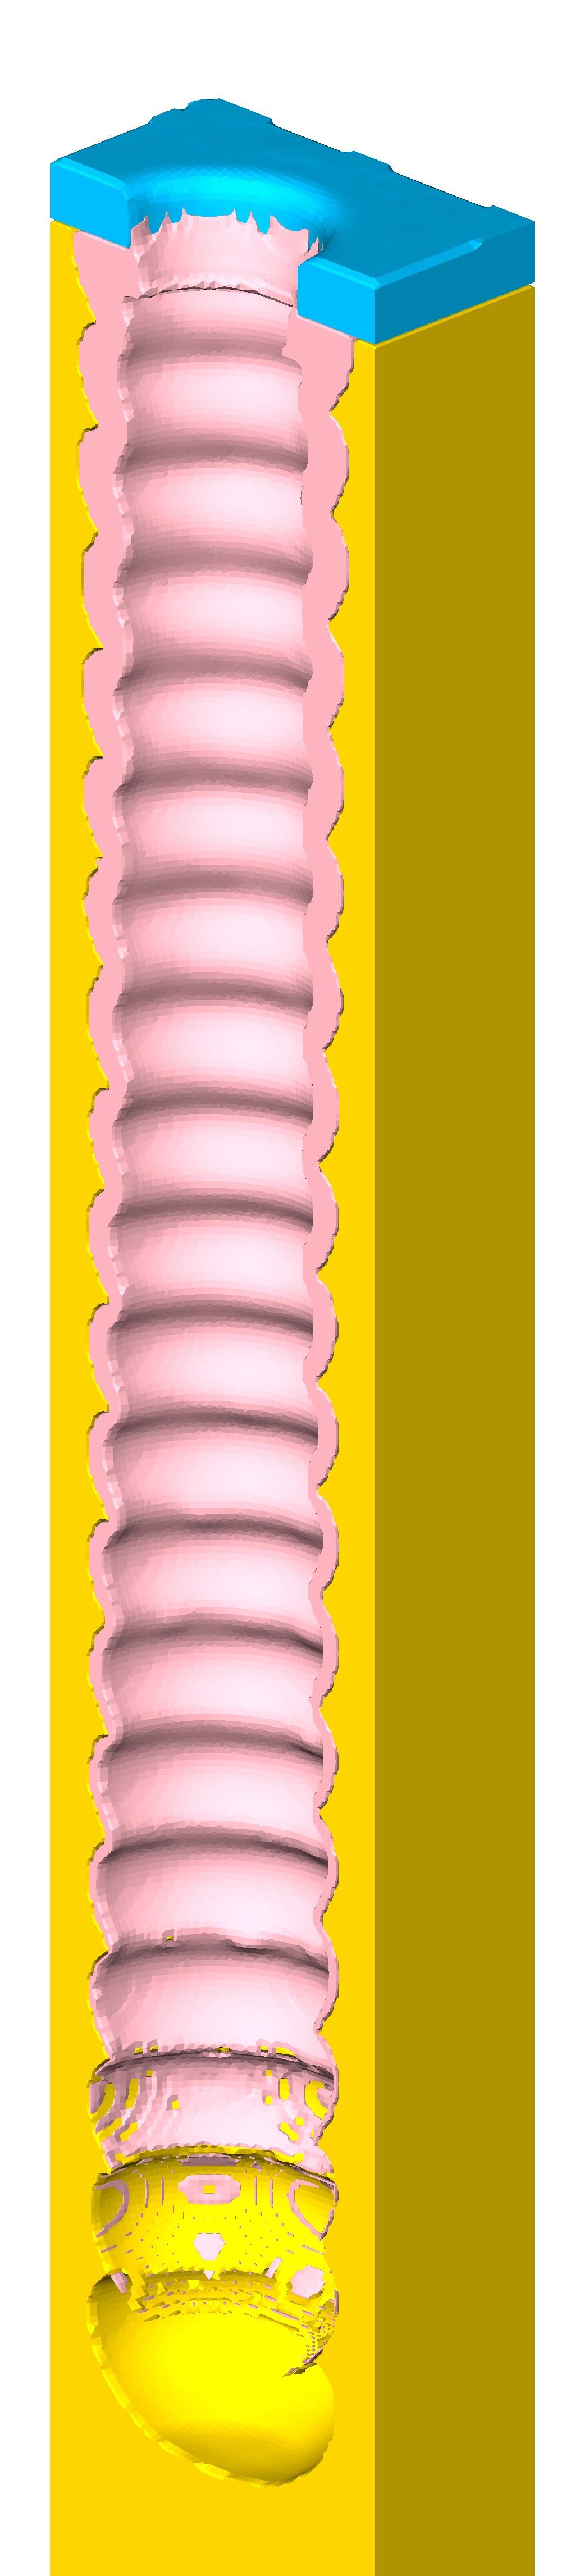
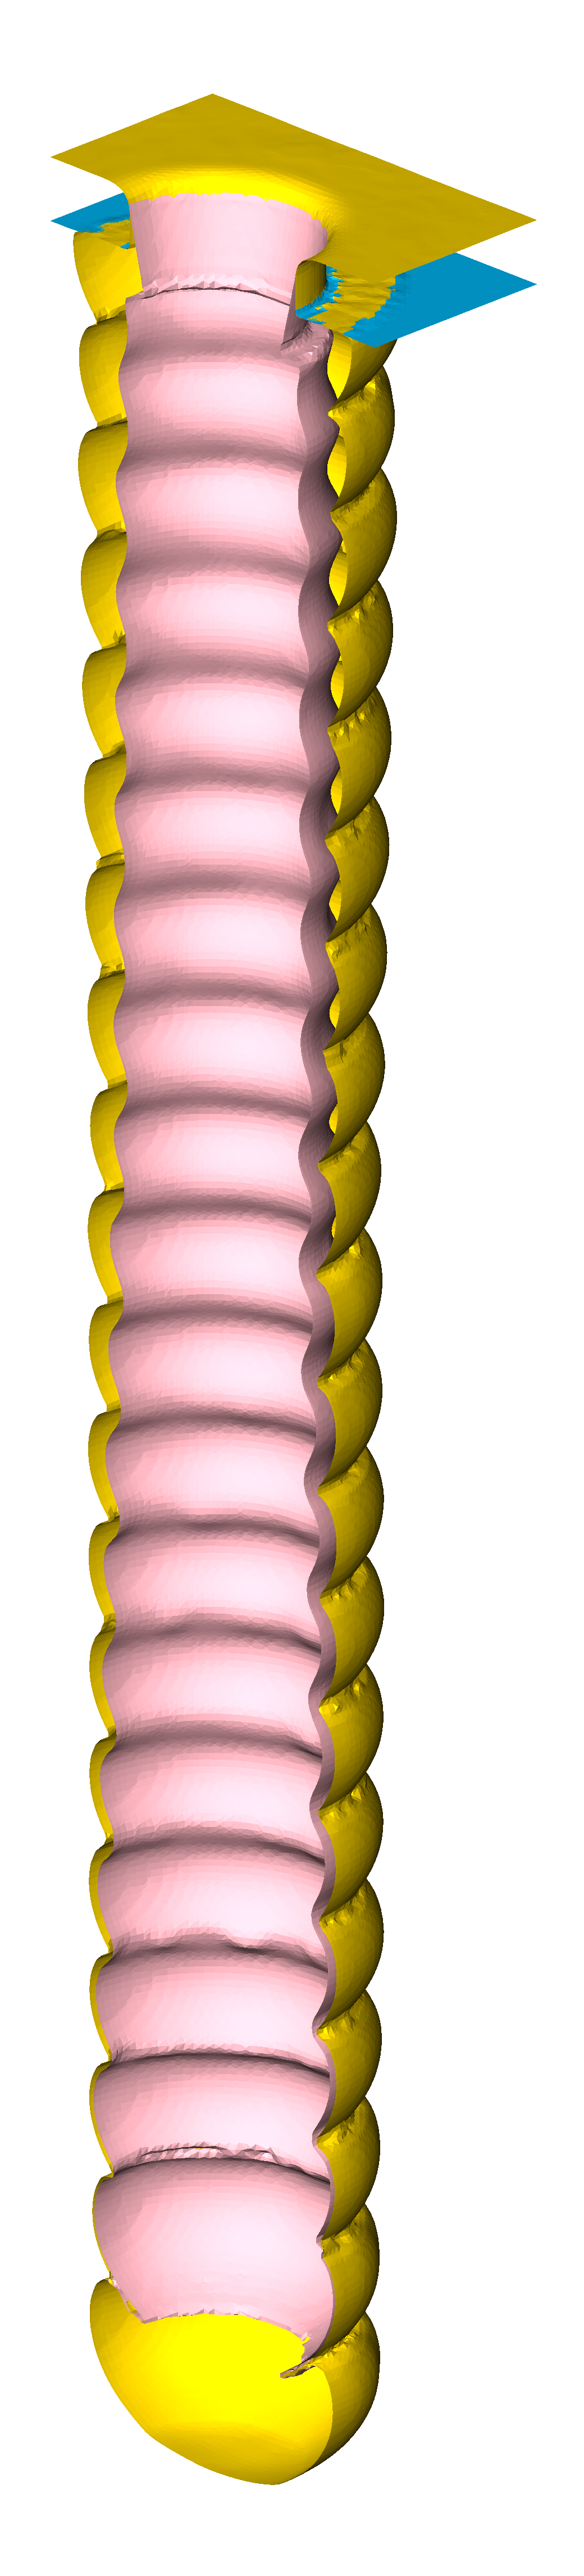
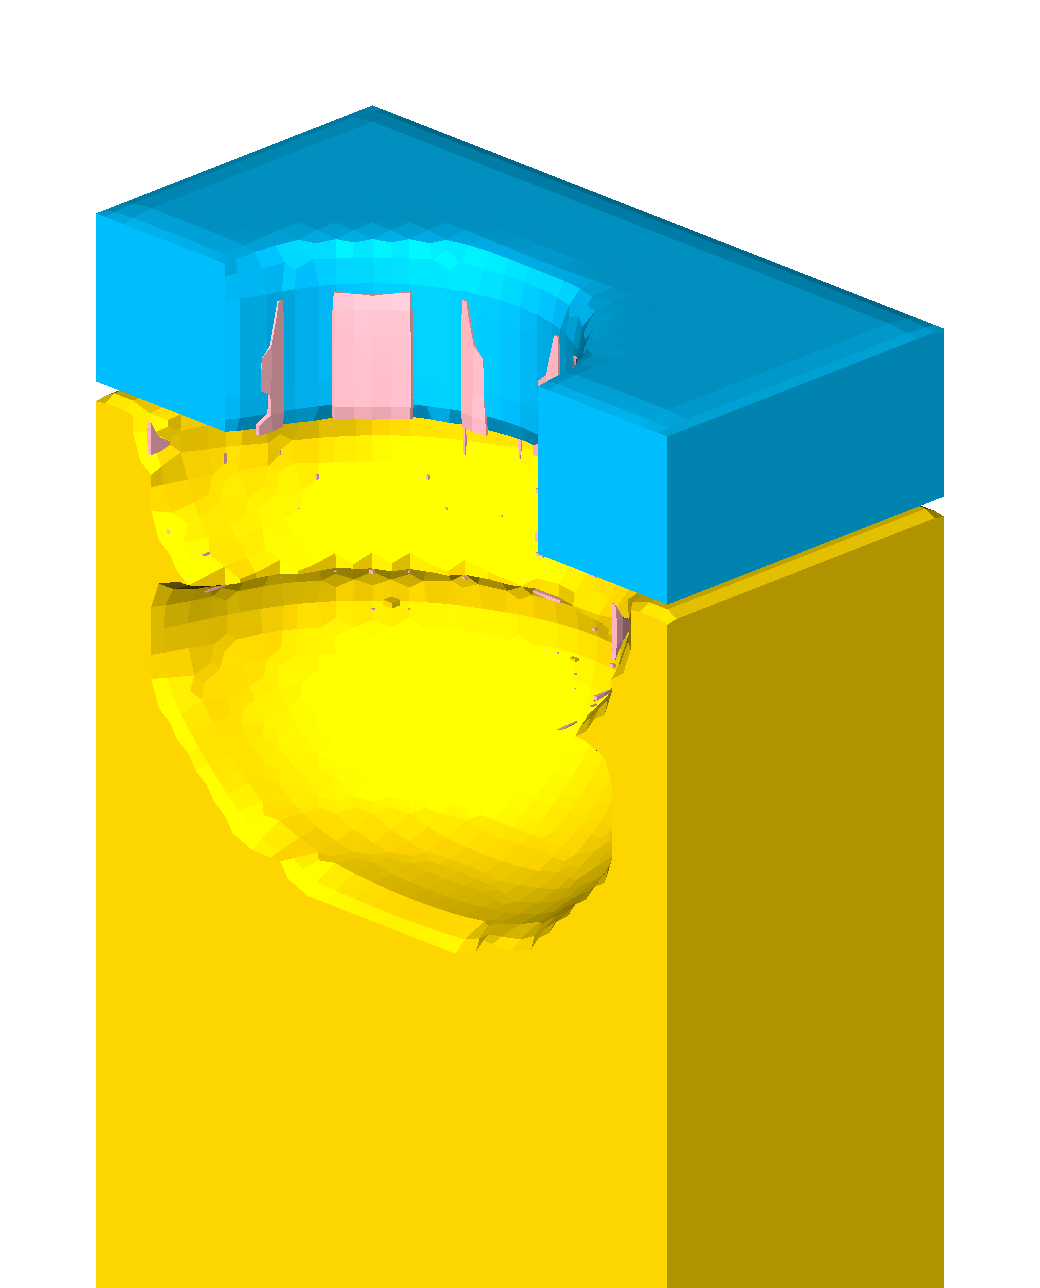
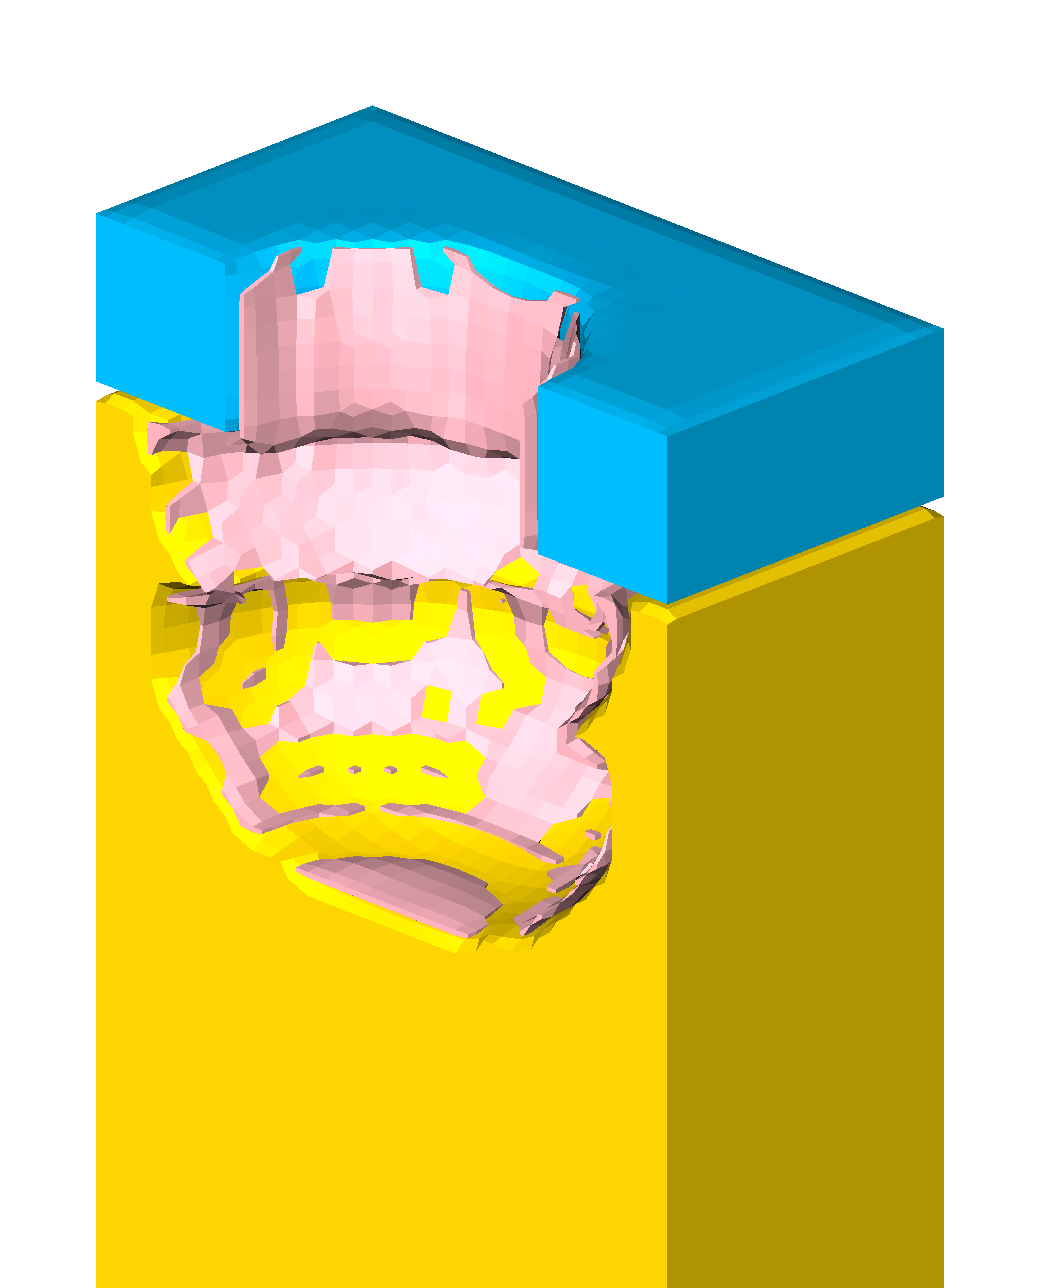
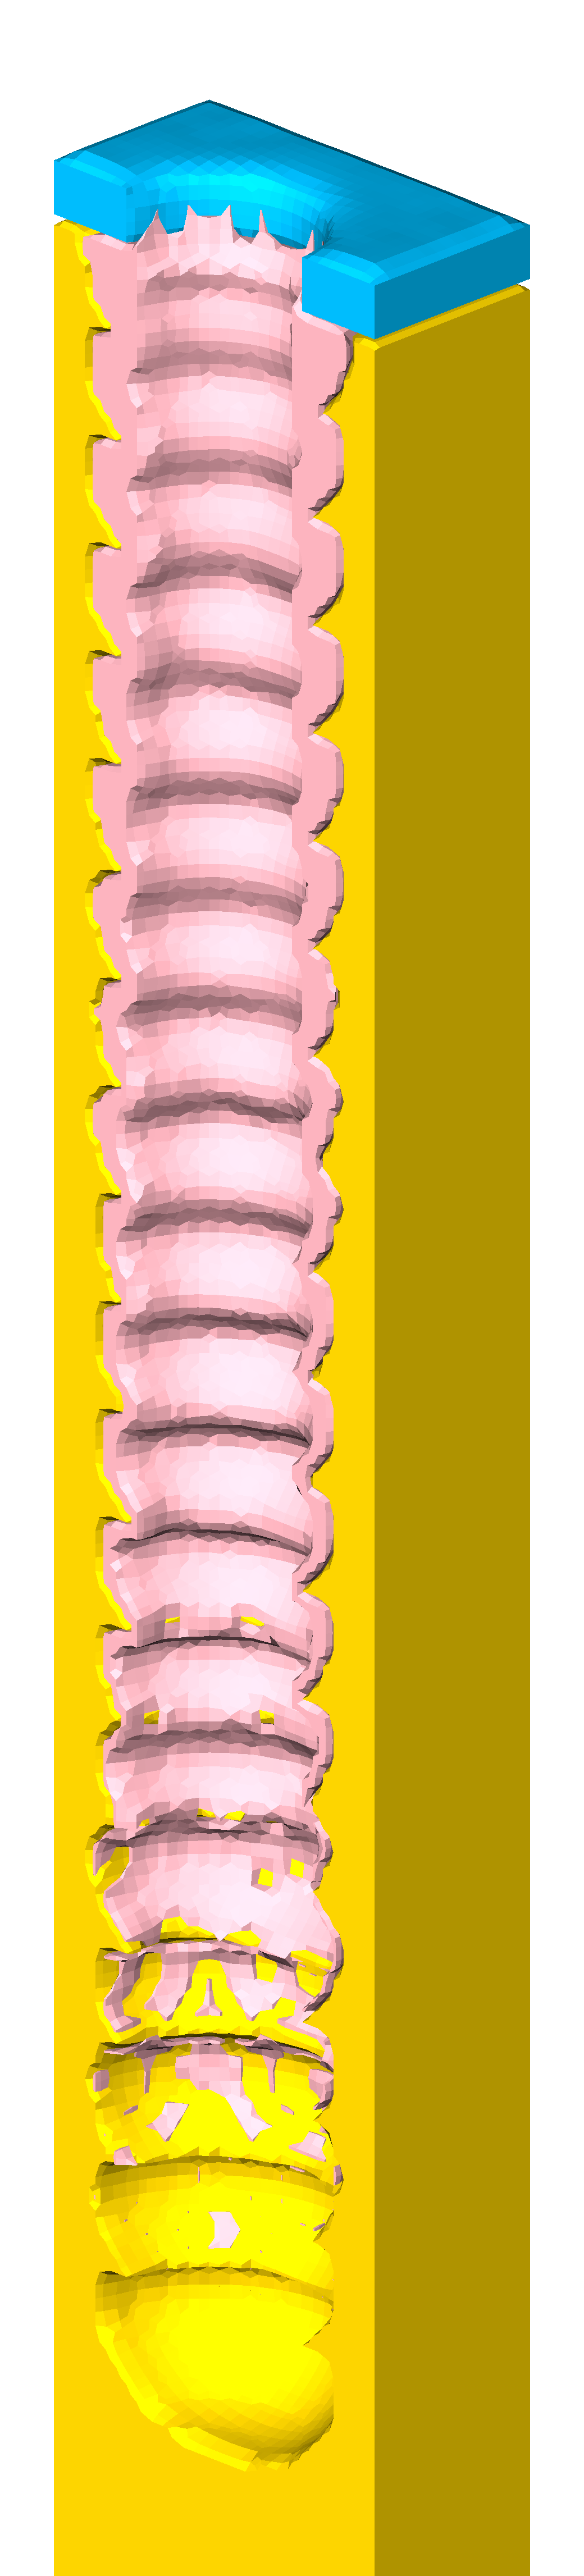
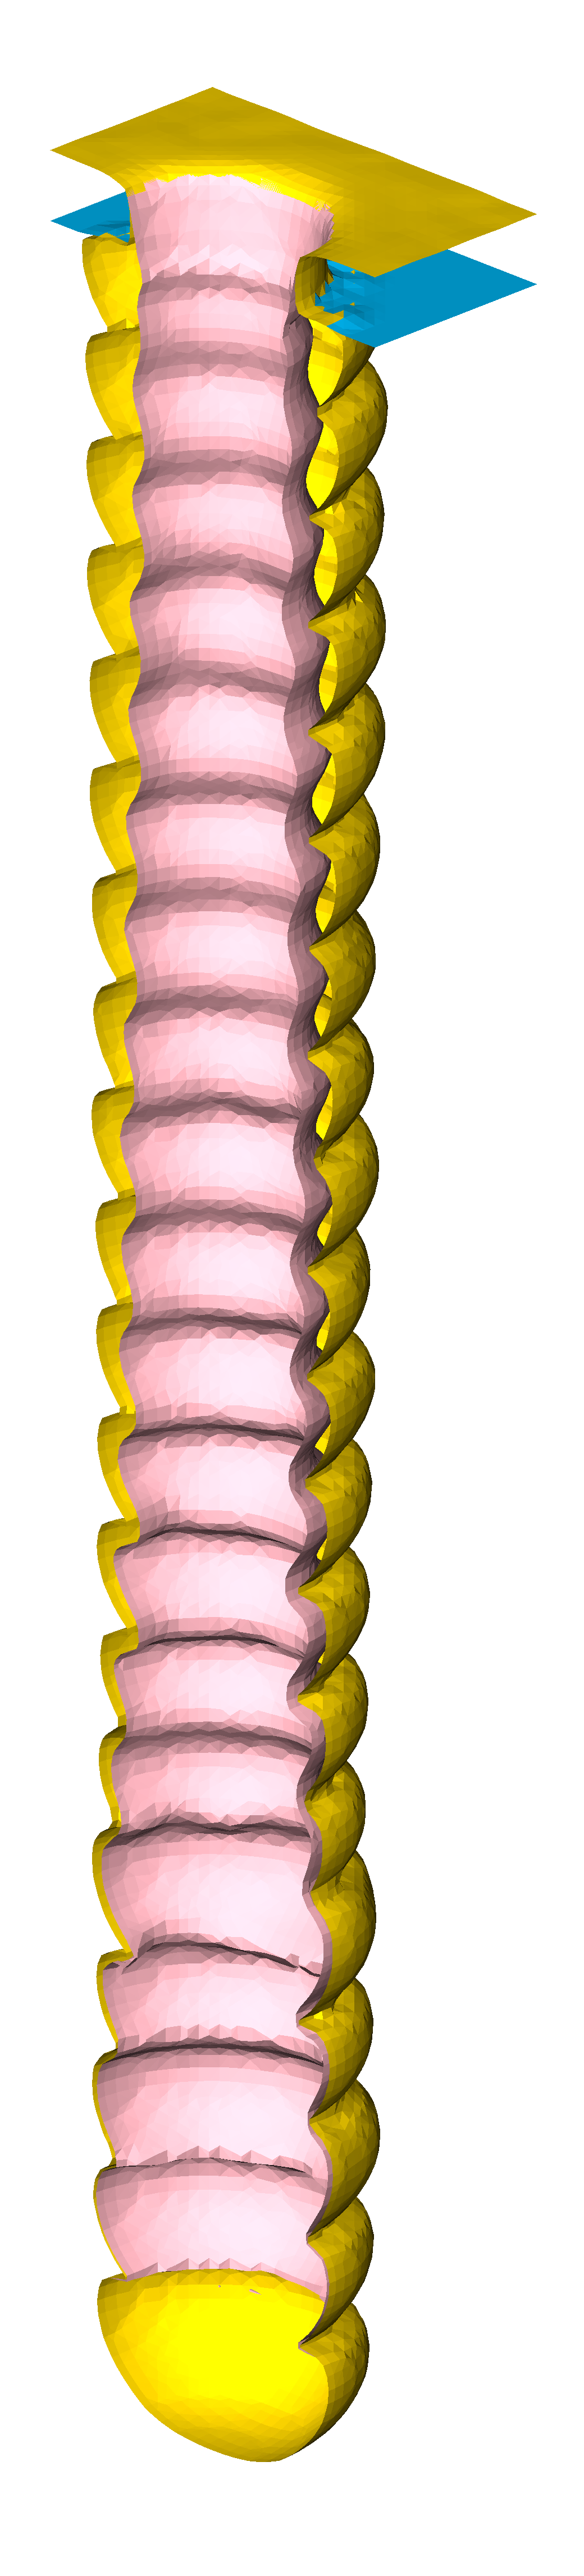
A.3 Simple Bosch Process

(a) \( T=5 \)


(b) \( T=17 \)


(c) \( T=22 \)


(d) \( T=34 \)


(e) \( T=39 \)


(f) \( T=340 \), regions

(g) \( T=340 \), layers

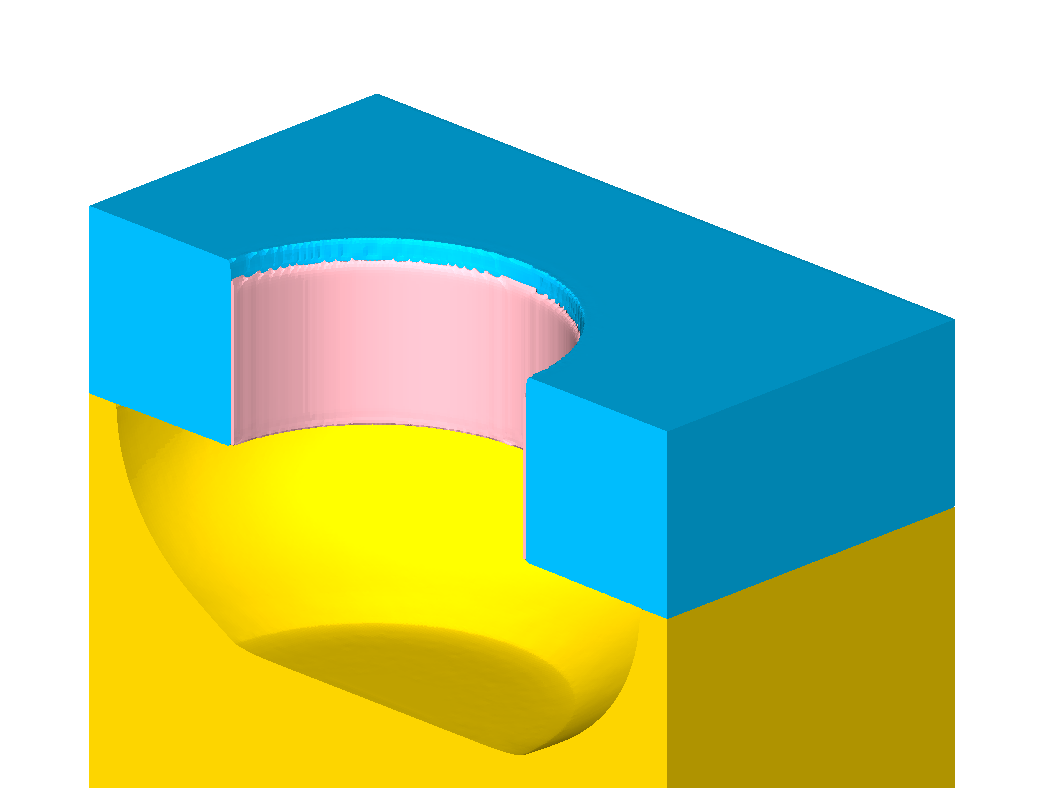
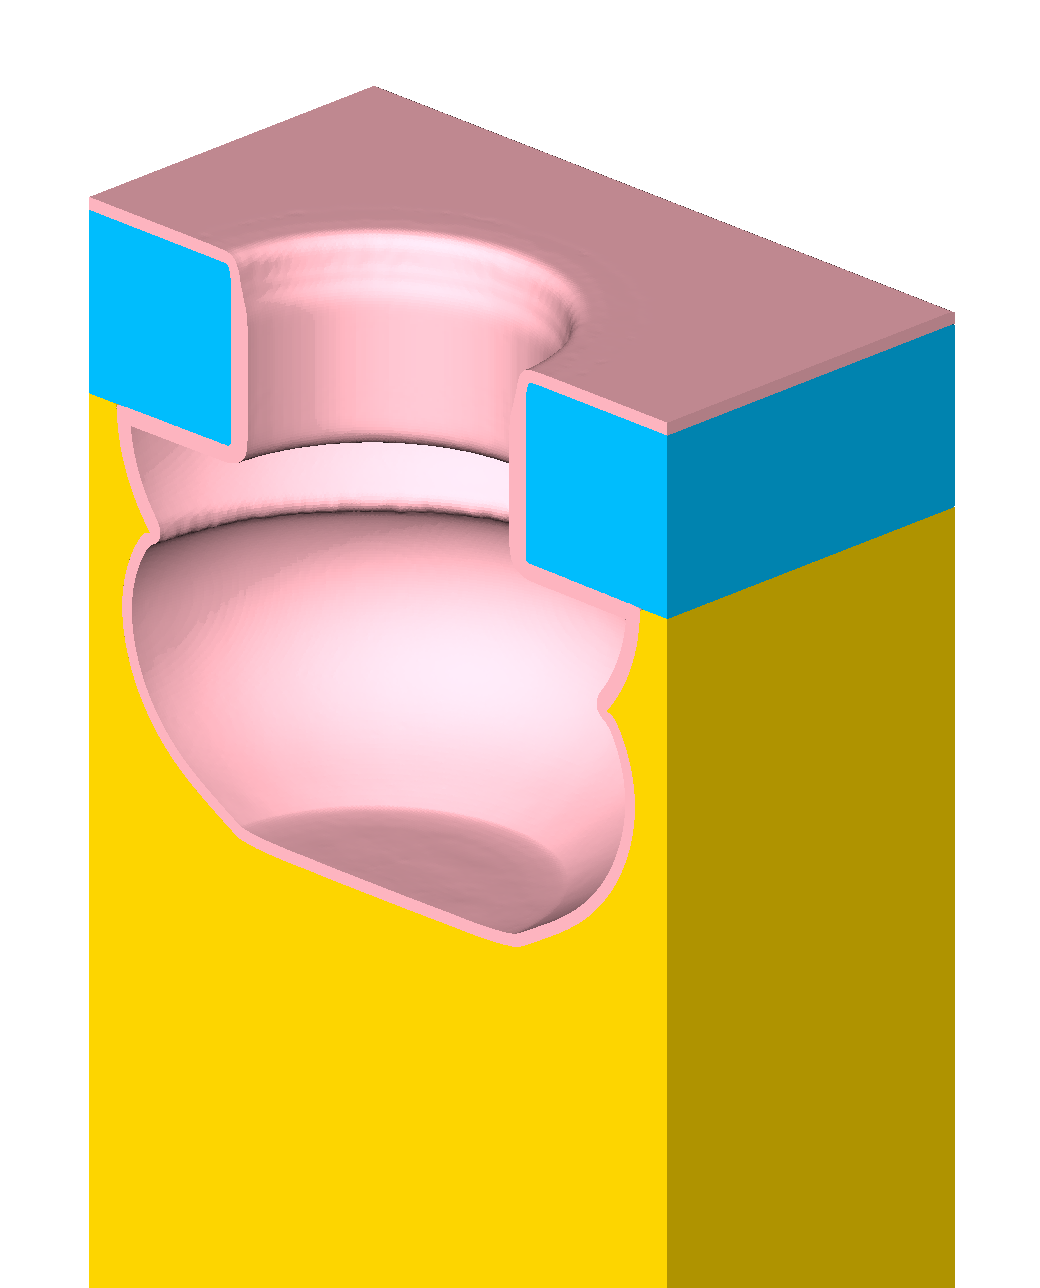
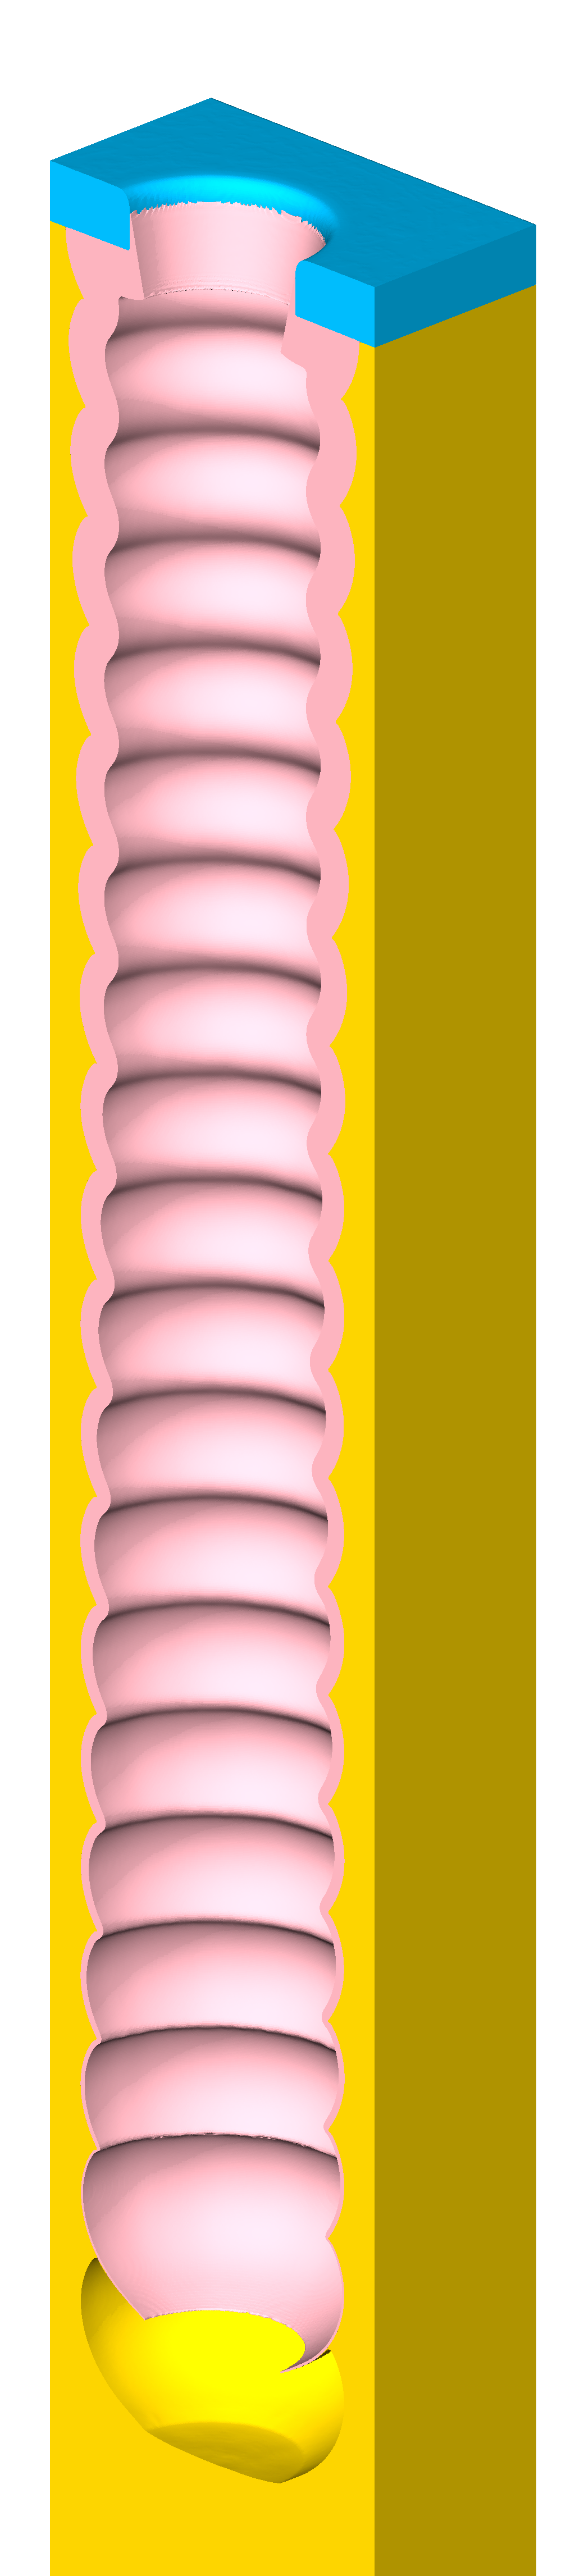
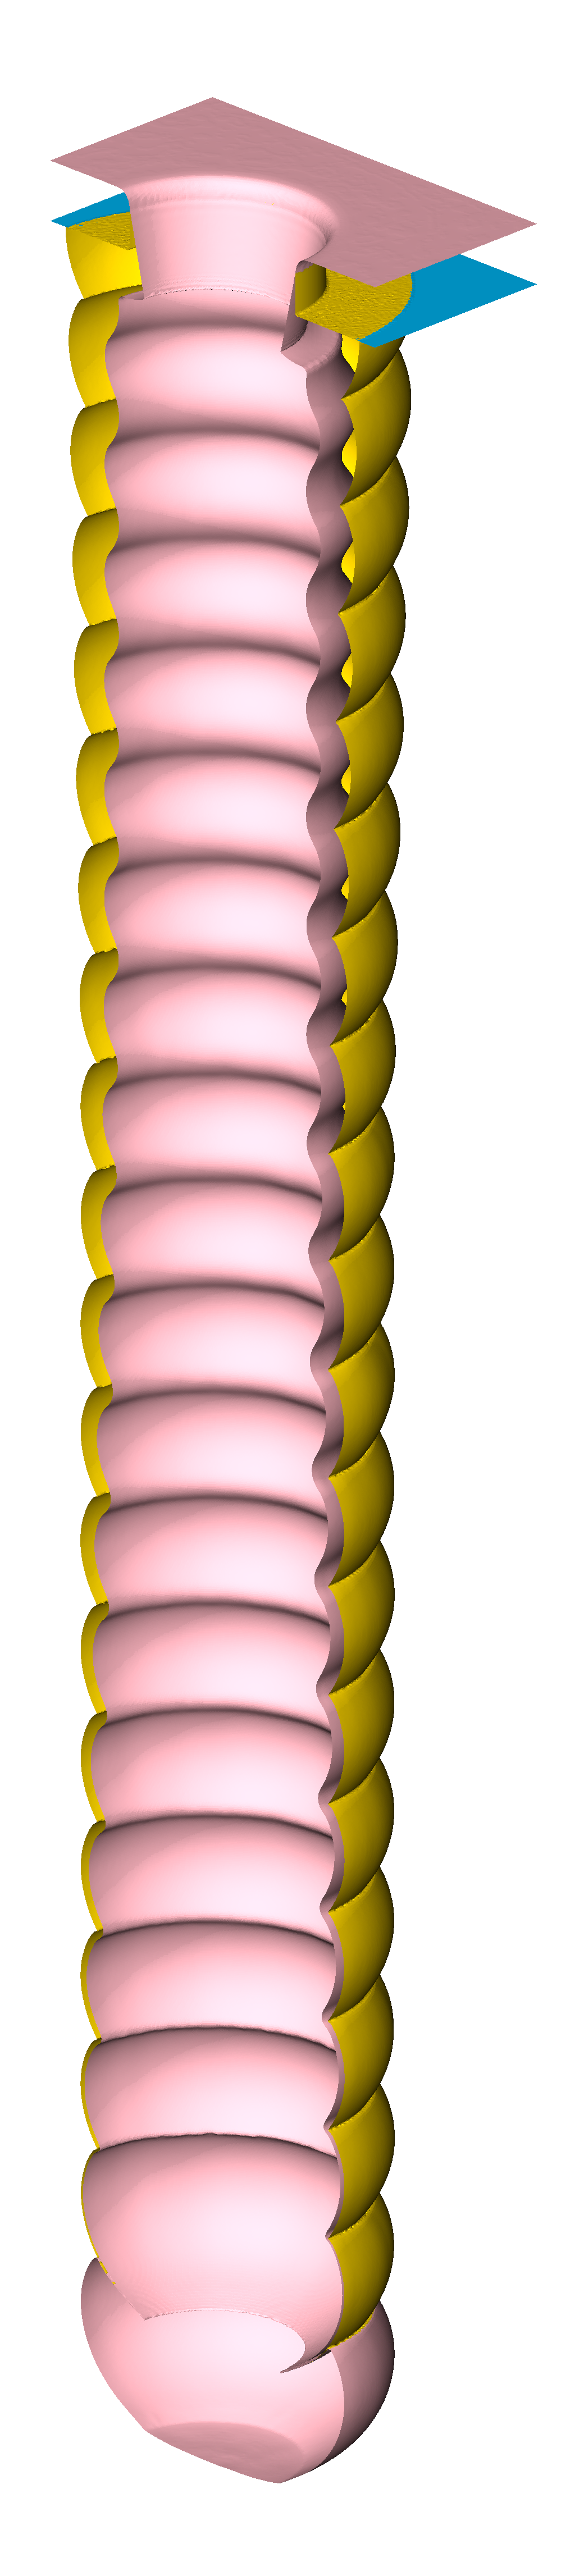
Figure A.8: Material regions of the simple Bosch process test case for resolution \( 1/256 \). (a)-(e): Material regions after each of the first 5 processing steps, i.e., alternating deposition and etching steps. (f): Final material regions after 20 cycles. (g): Final material layers after 20 cycles. The same results for lower resolutions \( 1/128 \), \( 1/64 \), and \( 1/32 \) are provided in Figures A.9- A.11.

(a) \( T=5 \)


(b) \( T=17 \)


(c) \( T=22 \)


(d) \( T=34 \)


(e) \( T=39 \)


(f) \( T=340 \), regions

(g) \( T=340 \), layers

Figure A.9: Material regions of the simple Bosch process test case for resolution \( 1/128 \).

(a) \( T=5 \)


(b) \( T=17 \)


(c) \( T=22 \)


(d) \( T=34 \)


(e) \( T=39 \)


(f) \( T=340 \), regions

(g) \( T=340 \), layers

Figure A.10: Material regions of the simple Bosch process test case for resolution \( 1/64 \).

(a) \( T=5 \)


(b) \( T=17 \)


(c) \( T=22 \)


(d) \( T=34 \)


(e) \( T=39 \)


(f) \( T=340 \), regions

(g) \( T=340 \), layers

Figure A.11: Material regions of the simple Bosch process test case for resolution \( 1/32 \).