« PreviousUpNext »Contents
Previous: 5.2 Interface Vacancy Pile-Up Top: 5 Results and Discussion Next: 5.4 Electromigration Induced Stress at the Interfaces of Open TSVs
5.3 The Three Phases of the Electromigration Induced Vacancy Accumulation
The time development of the maximum vacancy concentration for the test structure introduced in Figure 5.5 is shown in Figure 5.14. As can be readily seen, the development of the maximum vacancy concentration can be
divided into three phases [75]. In the first phase extending from the beginning of the simulation till approximately one second the vacancies show a linear dependence in time. The curvature is introduced due to the logarithmic scale
of the time axis. In this period the flux is only driven by the EM induced driving force. This phase is followed by the second phase with a constant maximum vacancy concentration. In this phase the EM induced flow is compensated
by the flows due to concentration and stress gradients on the one hand side and on the other hand side by the generation and annihilation modeled with the Rosenberg-Ohring term. Generation/annihilation leads to an increase in
stress (build-up) in the structure. After approximately  the maximum vacancy concentration rises rapidly. This is the
beginning of the third phase.
the maximum vacancy concentration rises rapidly. This is the
beginning of the third phase.
Figure 5.15 shows the development of the stress in the structure. In the first phase of the vacancy pile-up the stress increases linearly in time as the inelastic strain is only sustained by the shift of vacancies in the structure. After a short time the concentration of vacancies has reached a certain threshold value and the back flow due to the other flux phenomena reduces the stress growth rate leading to a sub-linear stress development. In the third phase the stress level has obtained a value where cracking or void nucleation is expected and, therefore, these phenomena have to be taken into account. This is the point, where a soft failure has to be expected.
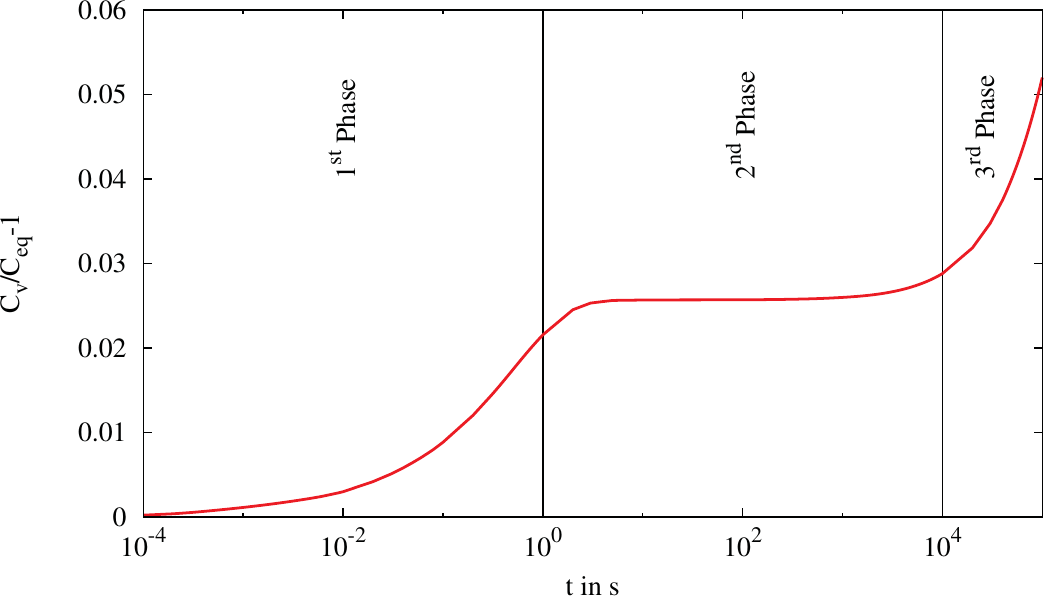
Figure 5.14.: The maximum concentration of vacancies piled up at the interface.
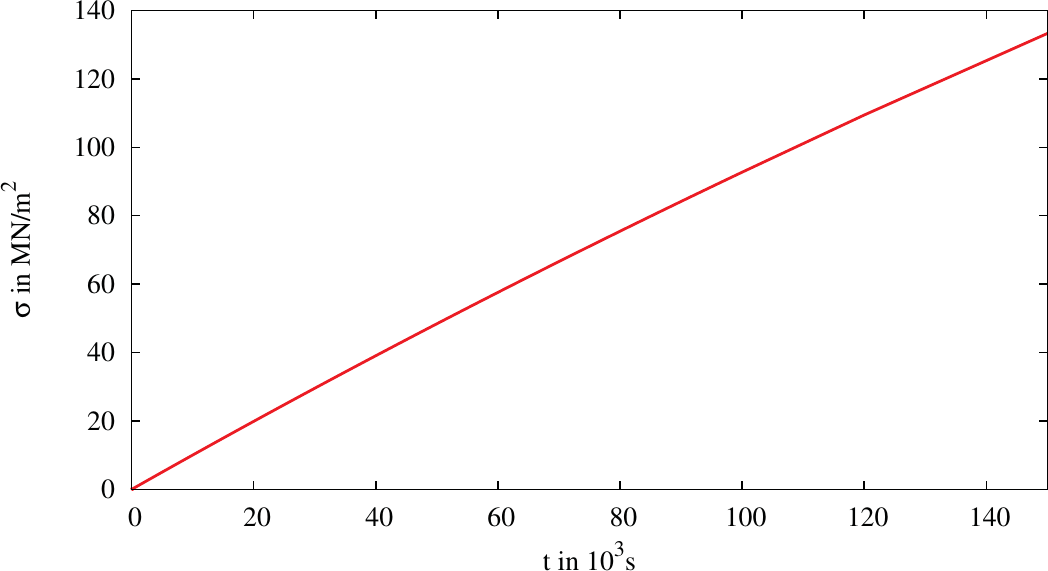
Figure 5.15.: Maximum Von Mises stress build-up at the interface.
Previous: 5.2 Interface Vacancy Pile-Up Top: 5 Results and Discussion Next: 5.4 Electromigration Induced Stress at the Interfaces of Open TSVs