2.4 Growth Rates
Particularly important for the thermal oxidation of SiC is the dependence of the oxidation growth rates on the crystal orientation [84, 85, 67], which has significant consequences for non-planar device structures. For instance, the orientation dependence has a very high impact on the trench design of U-MOSFETs [86], where the oxide is located on all crystallographic faces [19]. In this case the oxide growth thicknesses will vary depending on the particular face, requiring advanced high-accuracy multi-dimensional modeling to correctly predict the oxide formation of the overall device. It is thus essential to carefully distinguish between the different crystal orientations of SiC. The highest difference in the growth rates of oxidation is between the top, i.e., \((0001)\) Si-face, and the bottom, i.e., \((000\bar {1})\) C-face [84, 85, 67]. The oxidation of SiC varies also with other common crystallographic faces, e.g., \((1\bar {1}00)\) m- and \((11\bar {2}0)\) a-face [87, 88].
Recently, several experimental investigations of SiC oxidation of different crystallographic faces have been performed [89, 70, 63, 58, 90], but some of the published time-dependent oxide thicknesses are inconsistent. Certain measurements from different publications vary up to a factor of three for the same material and oxidation environment. Available experimental and theoretical data has been thus collected and evaluated [72] to provide a full picture of the oxidation parameters and enable further progress in modeling and simulation of SiC-based devices.
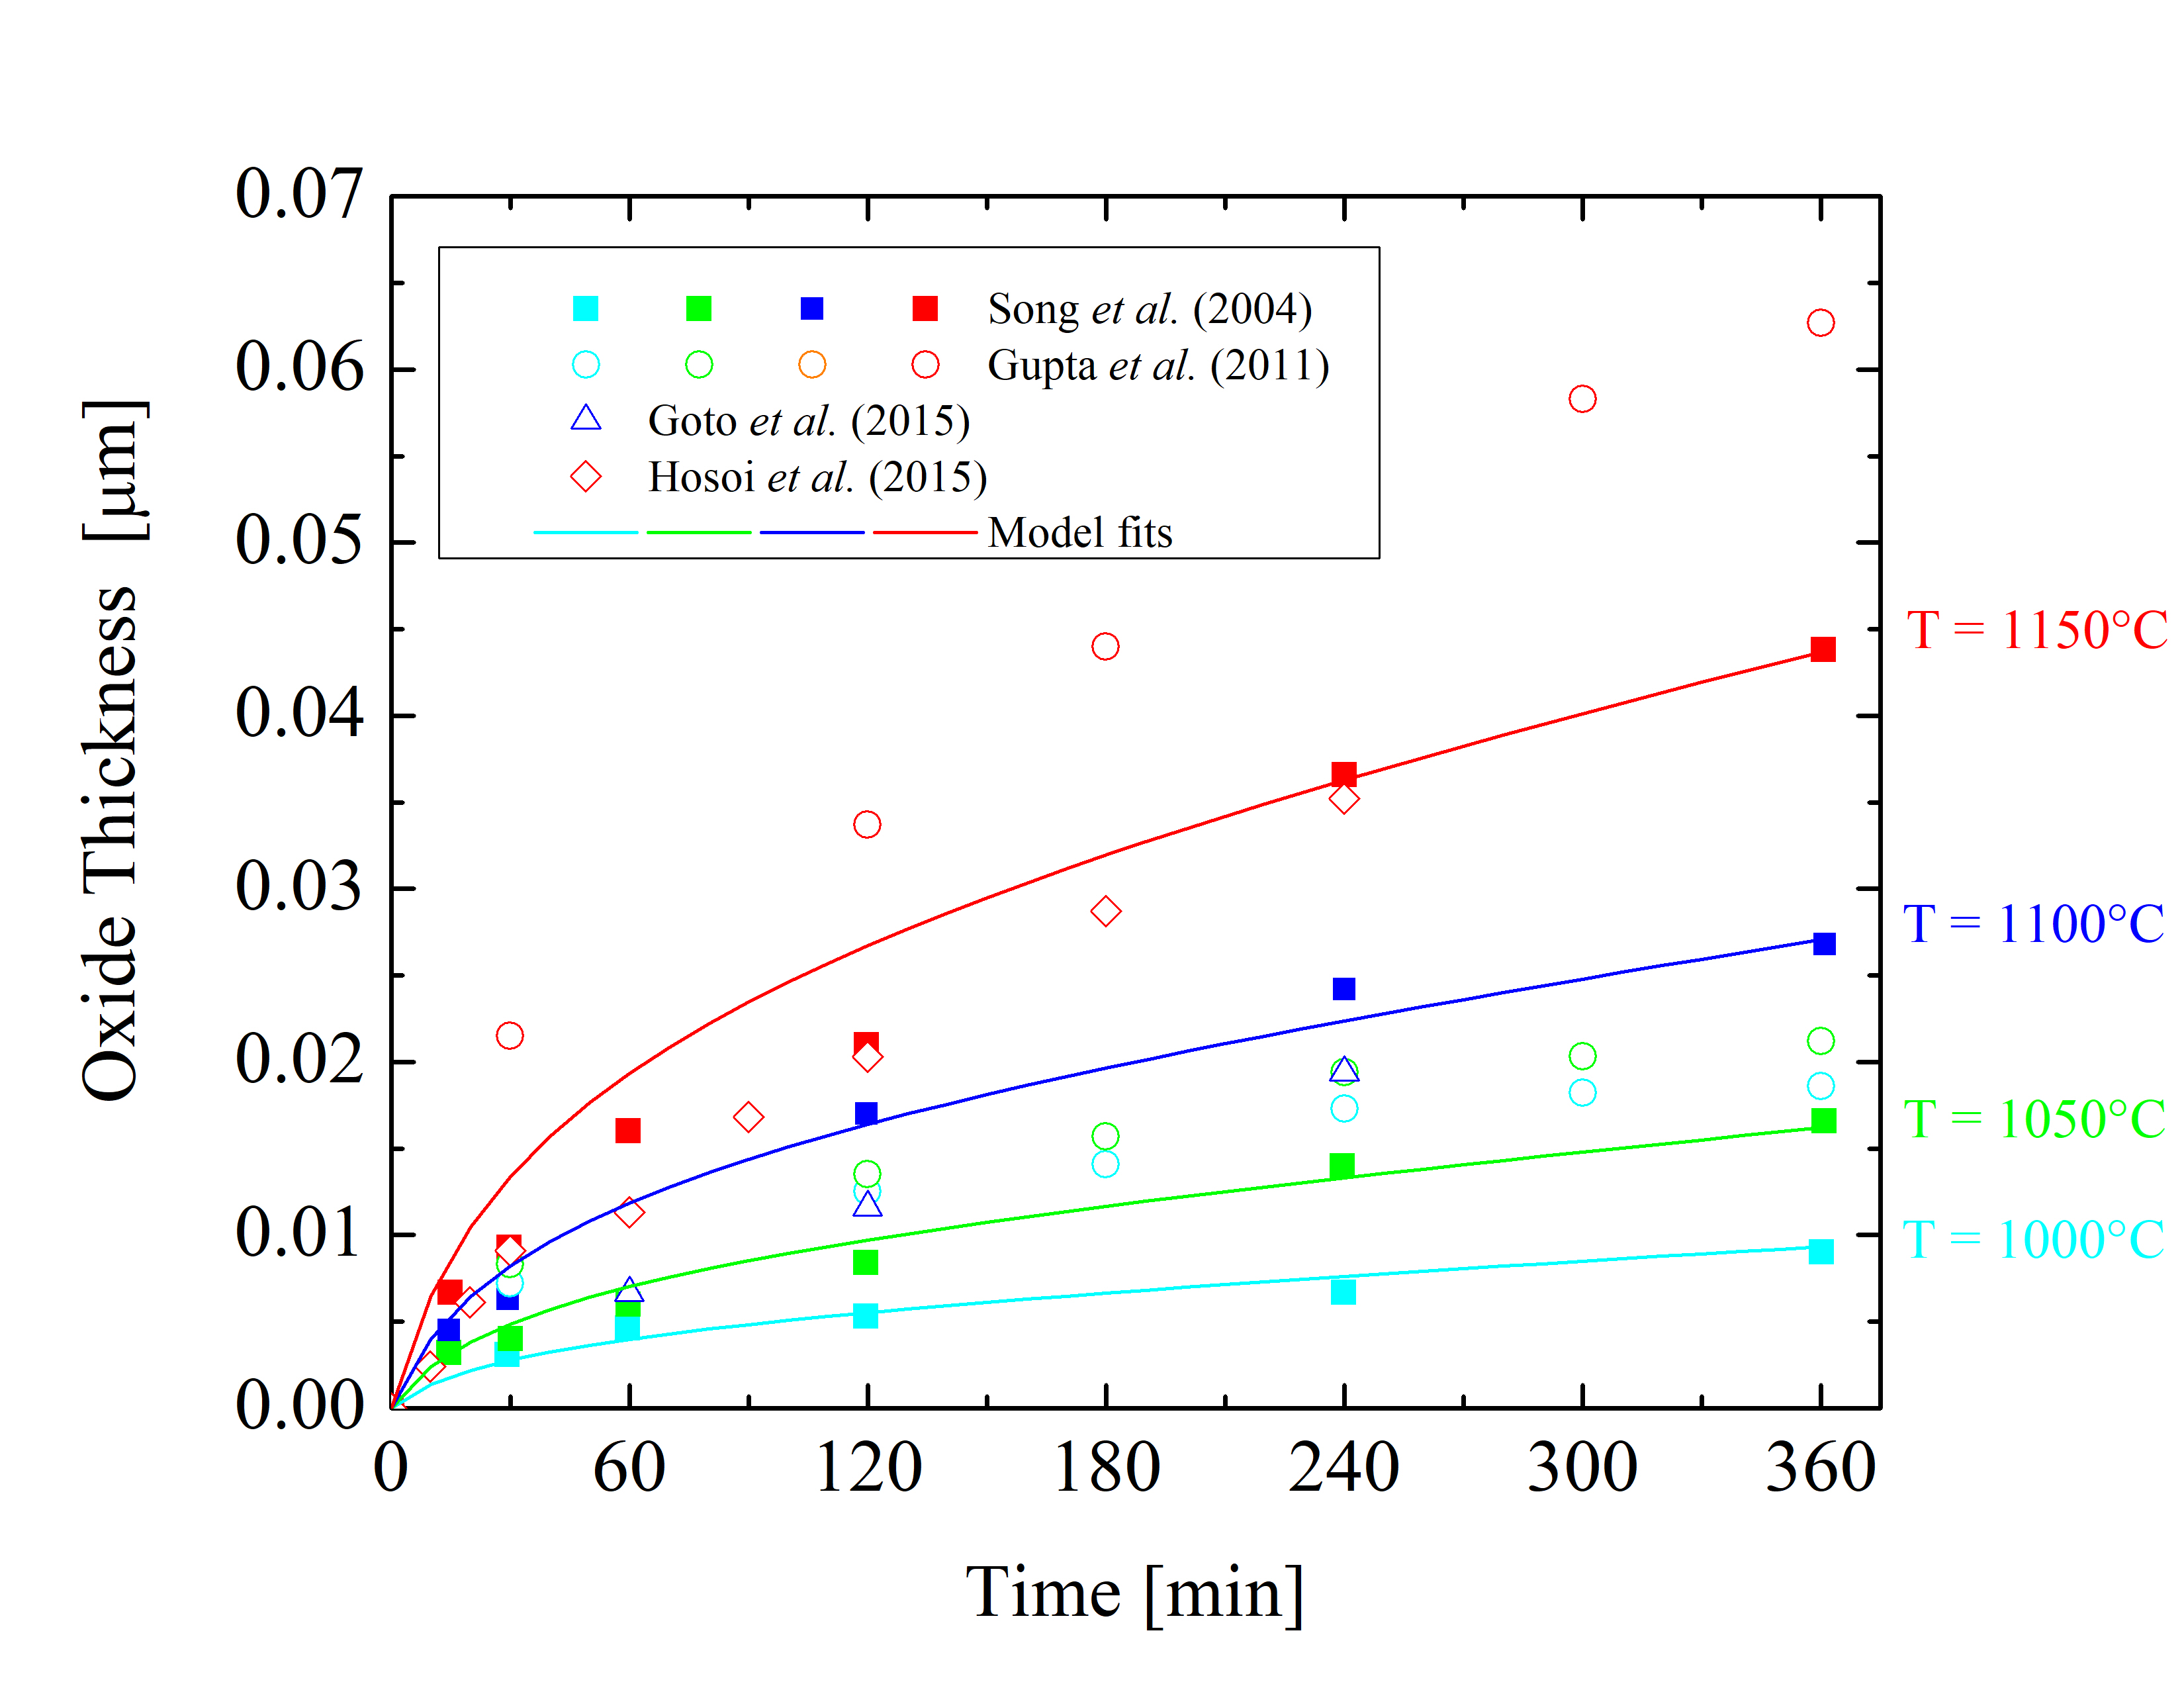
Figure 2.5: Oxide thicknesses as a function of time for various temperatures of dry thermal oxidation of the 4H-SiC \((0001)\) Si-face. The solid lines are fits by (2.24), the symbols are measurements, and the colors indicate various temperatures.
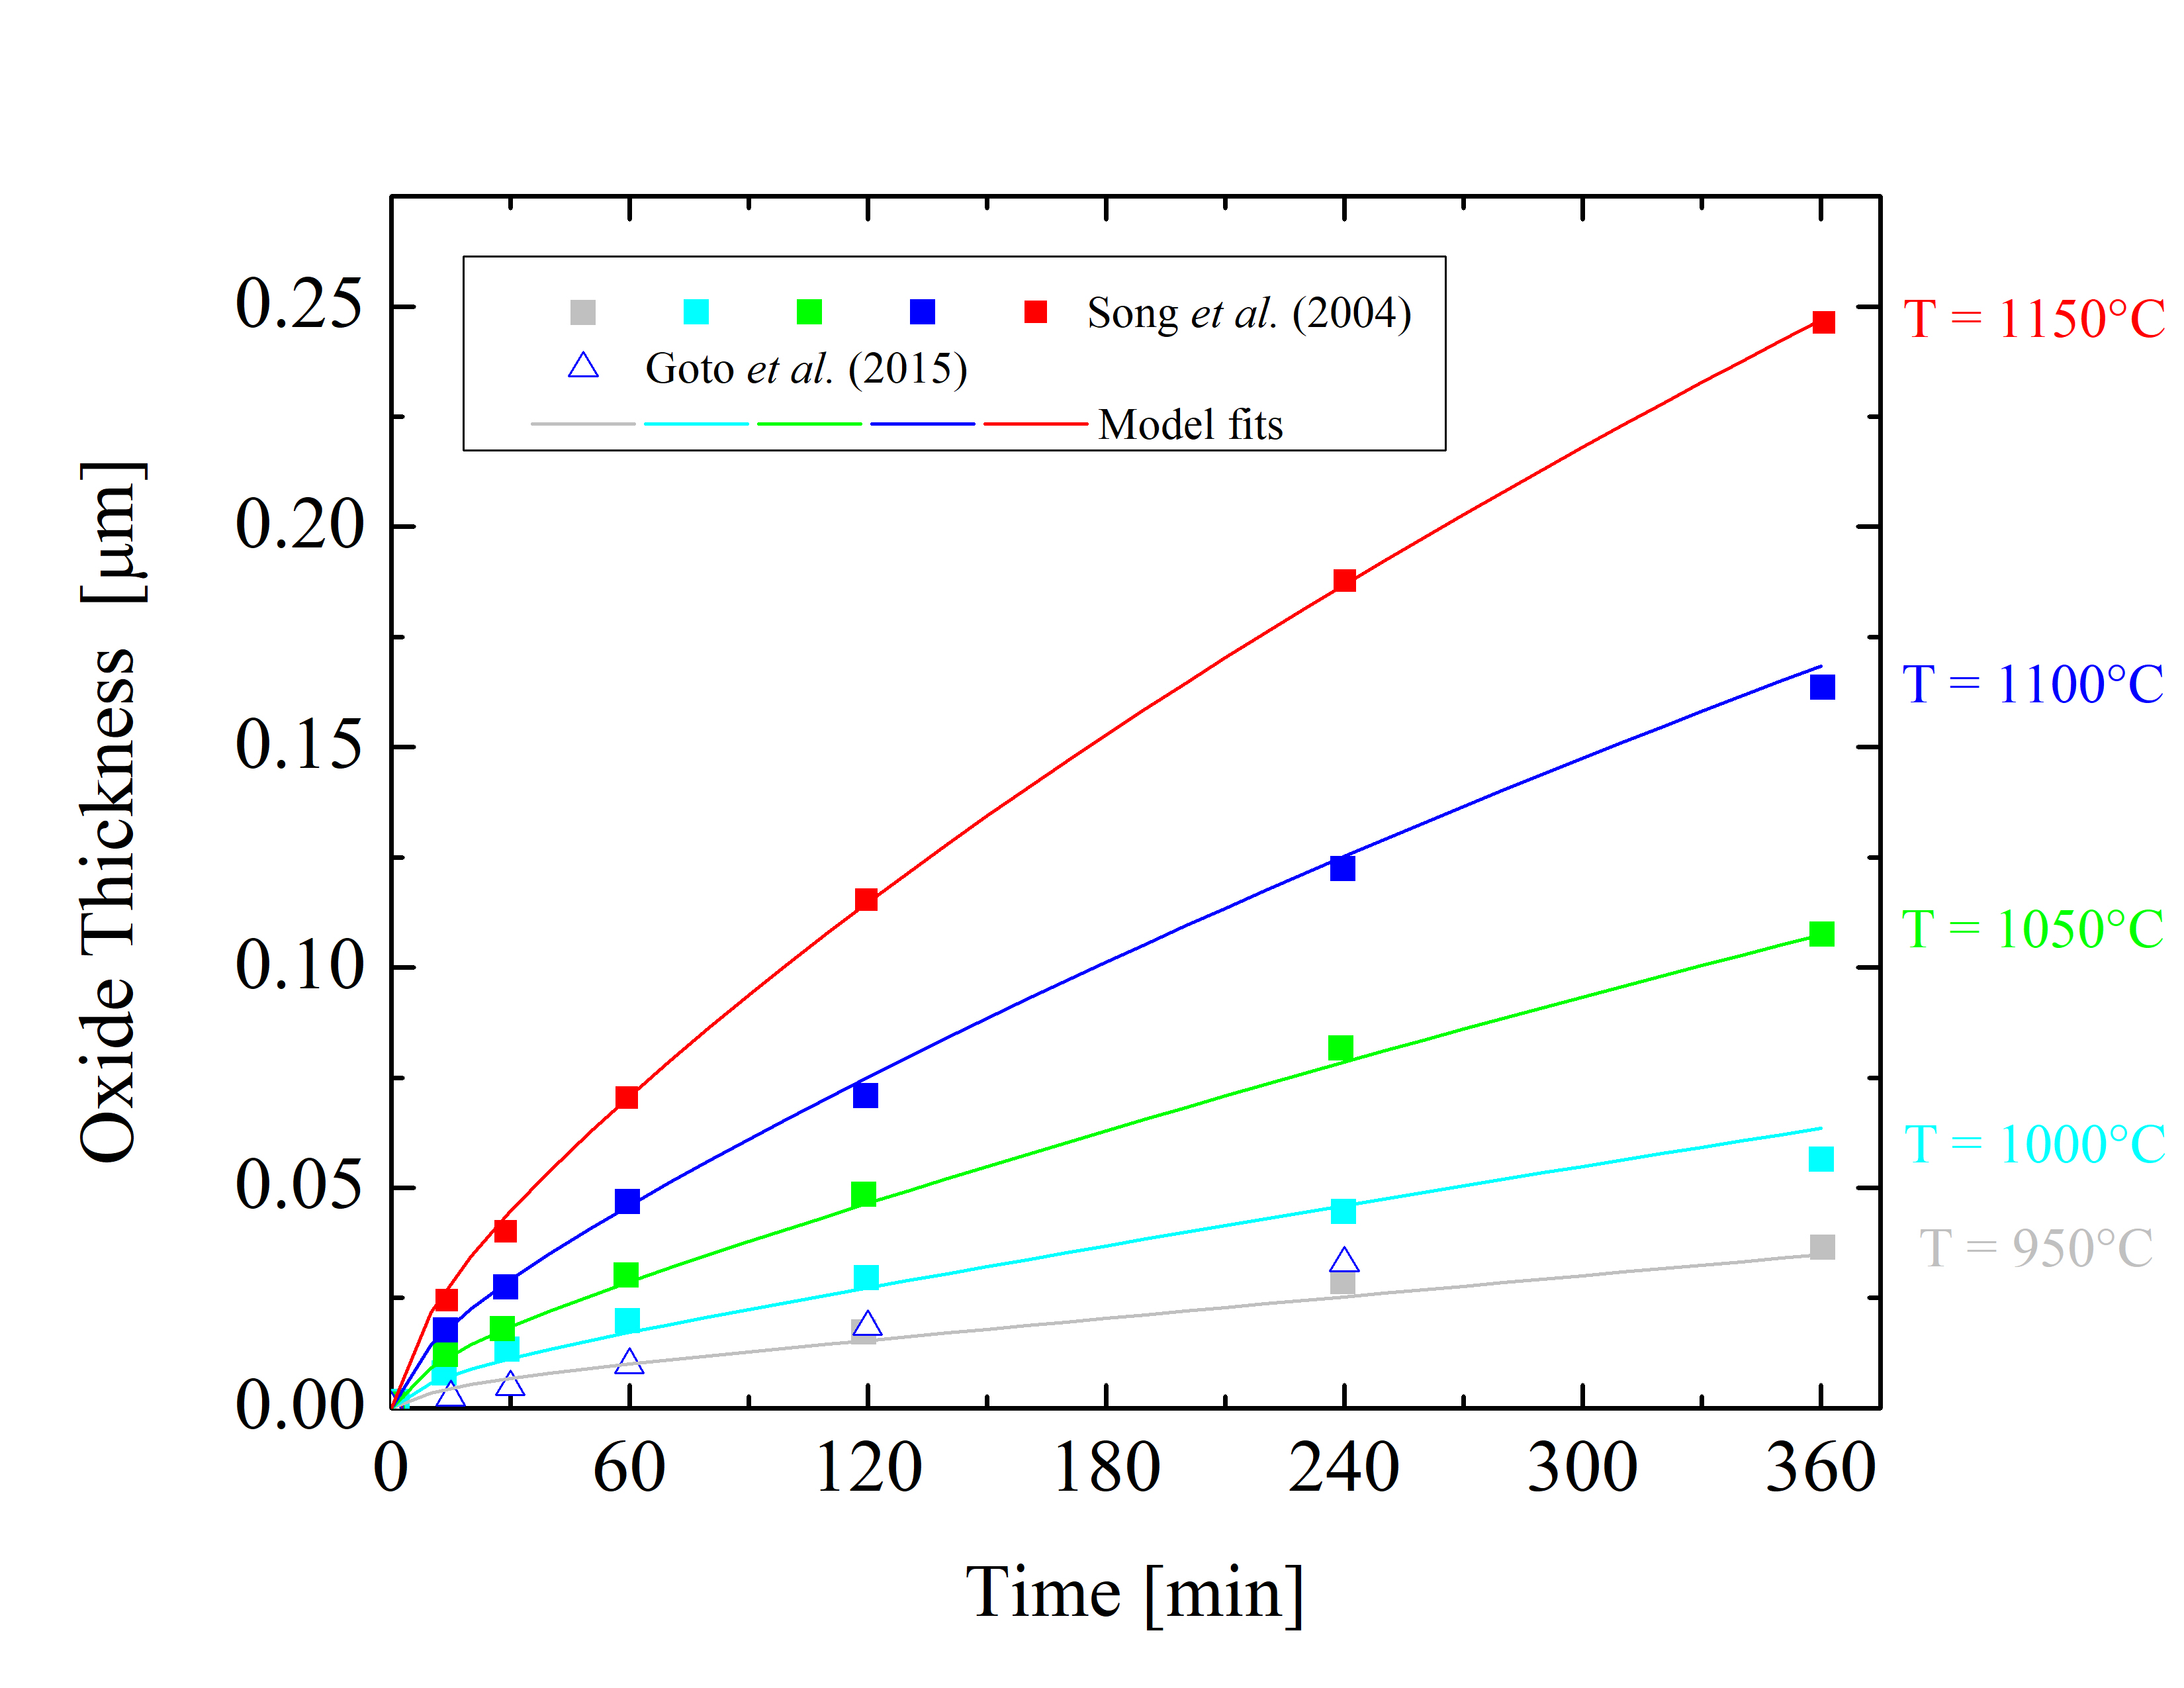
Figure 2.6: Oxide thicknesses as a function of time for various temperatures of dry thermal oxidation of the 4H-SiC \((11\bar 20)\) a-face. The solid lines are fits by (2.24), the symbols are measurements, and the colors indicate various temperatures.
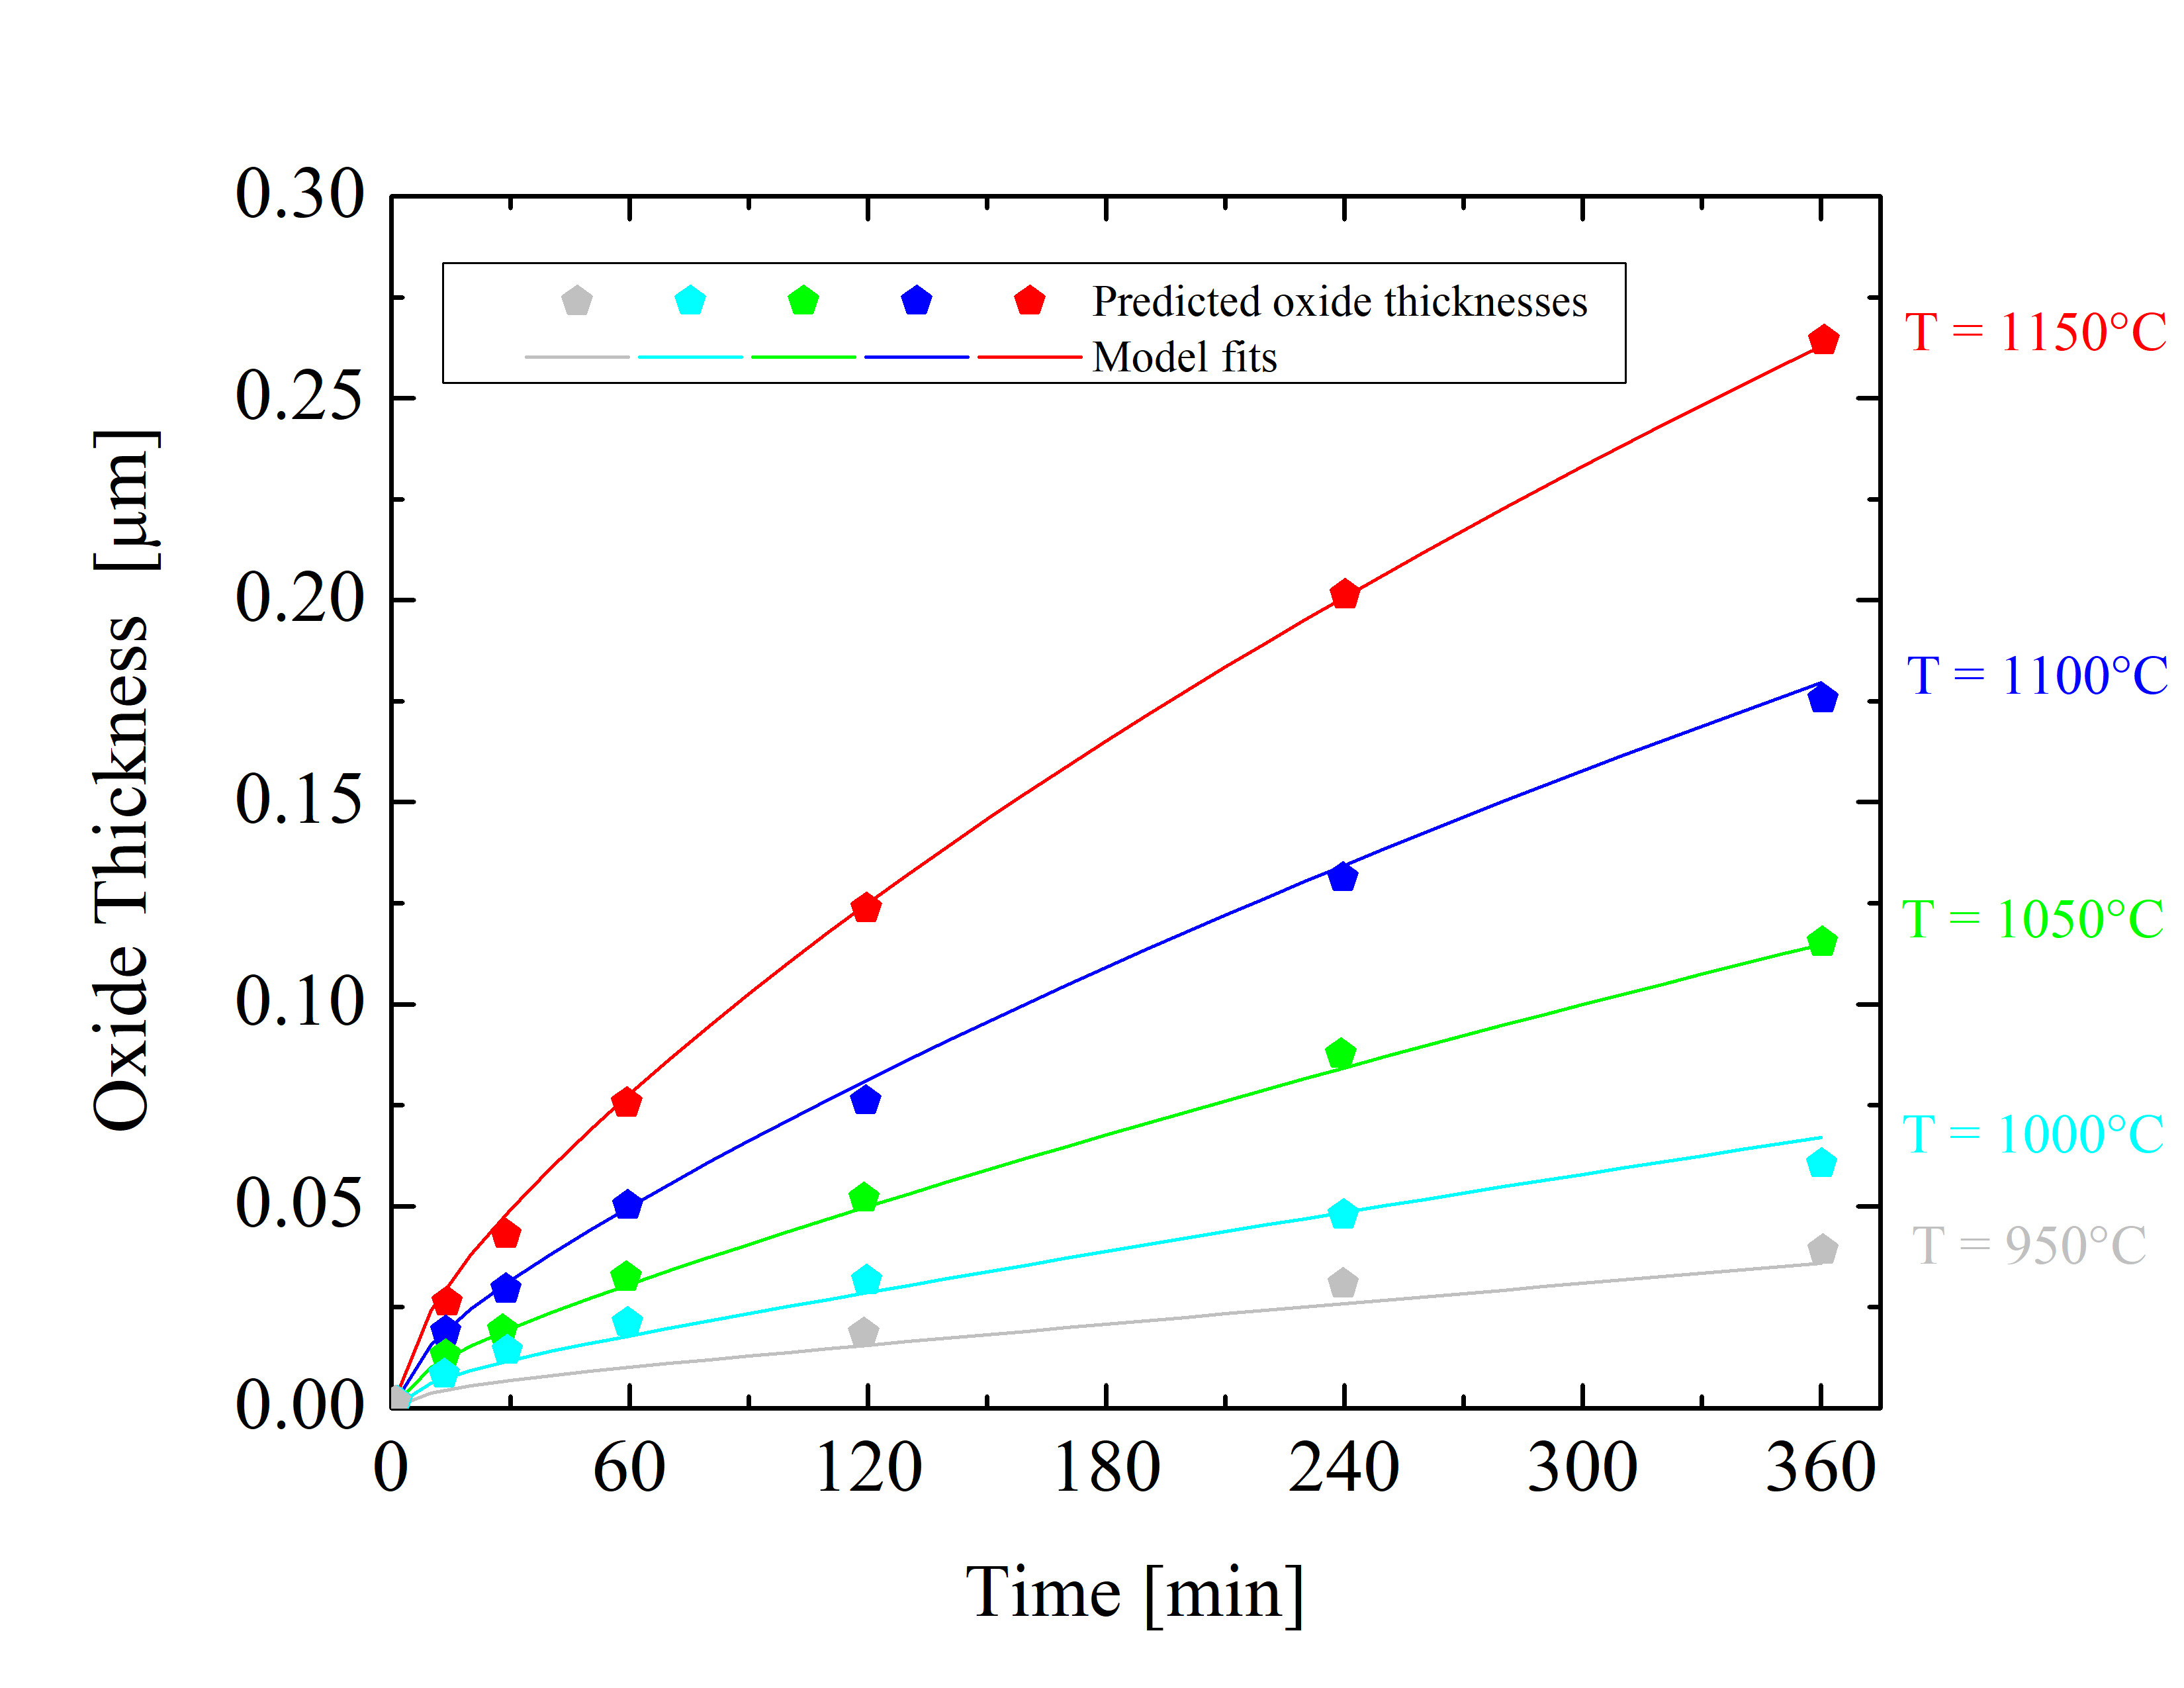
Figure 2.7: Oxide thicknesses as a function of time for various temperatures of dry thermal oxidation of the 4H-SiC \((1\bar 100)\) m-face. The solid lines are fits by (2.24), the symbols are predicted oxide thicknesses, and the colors indicate various temperatures.
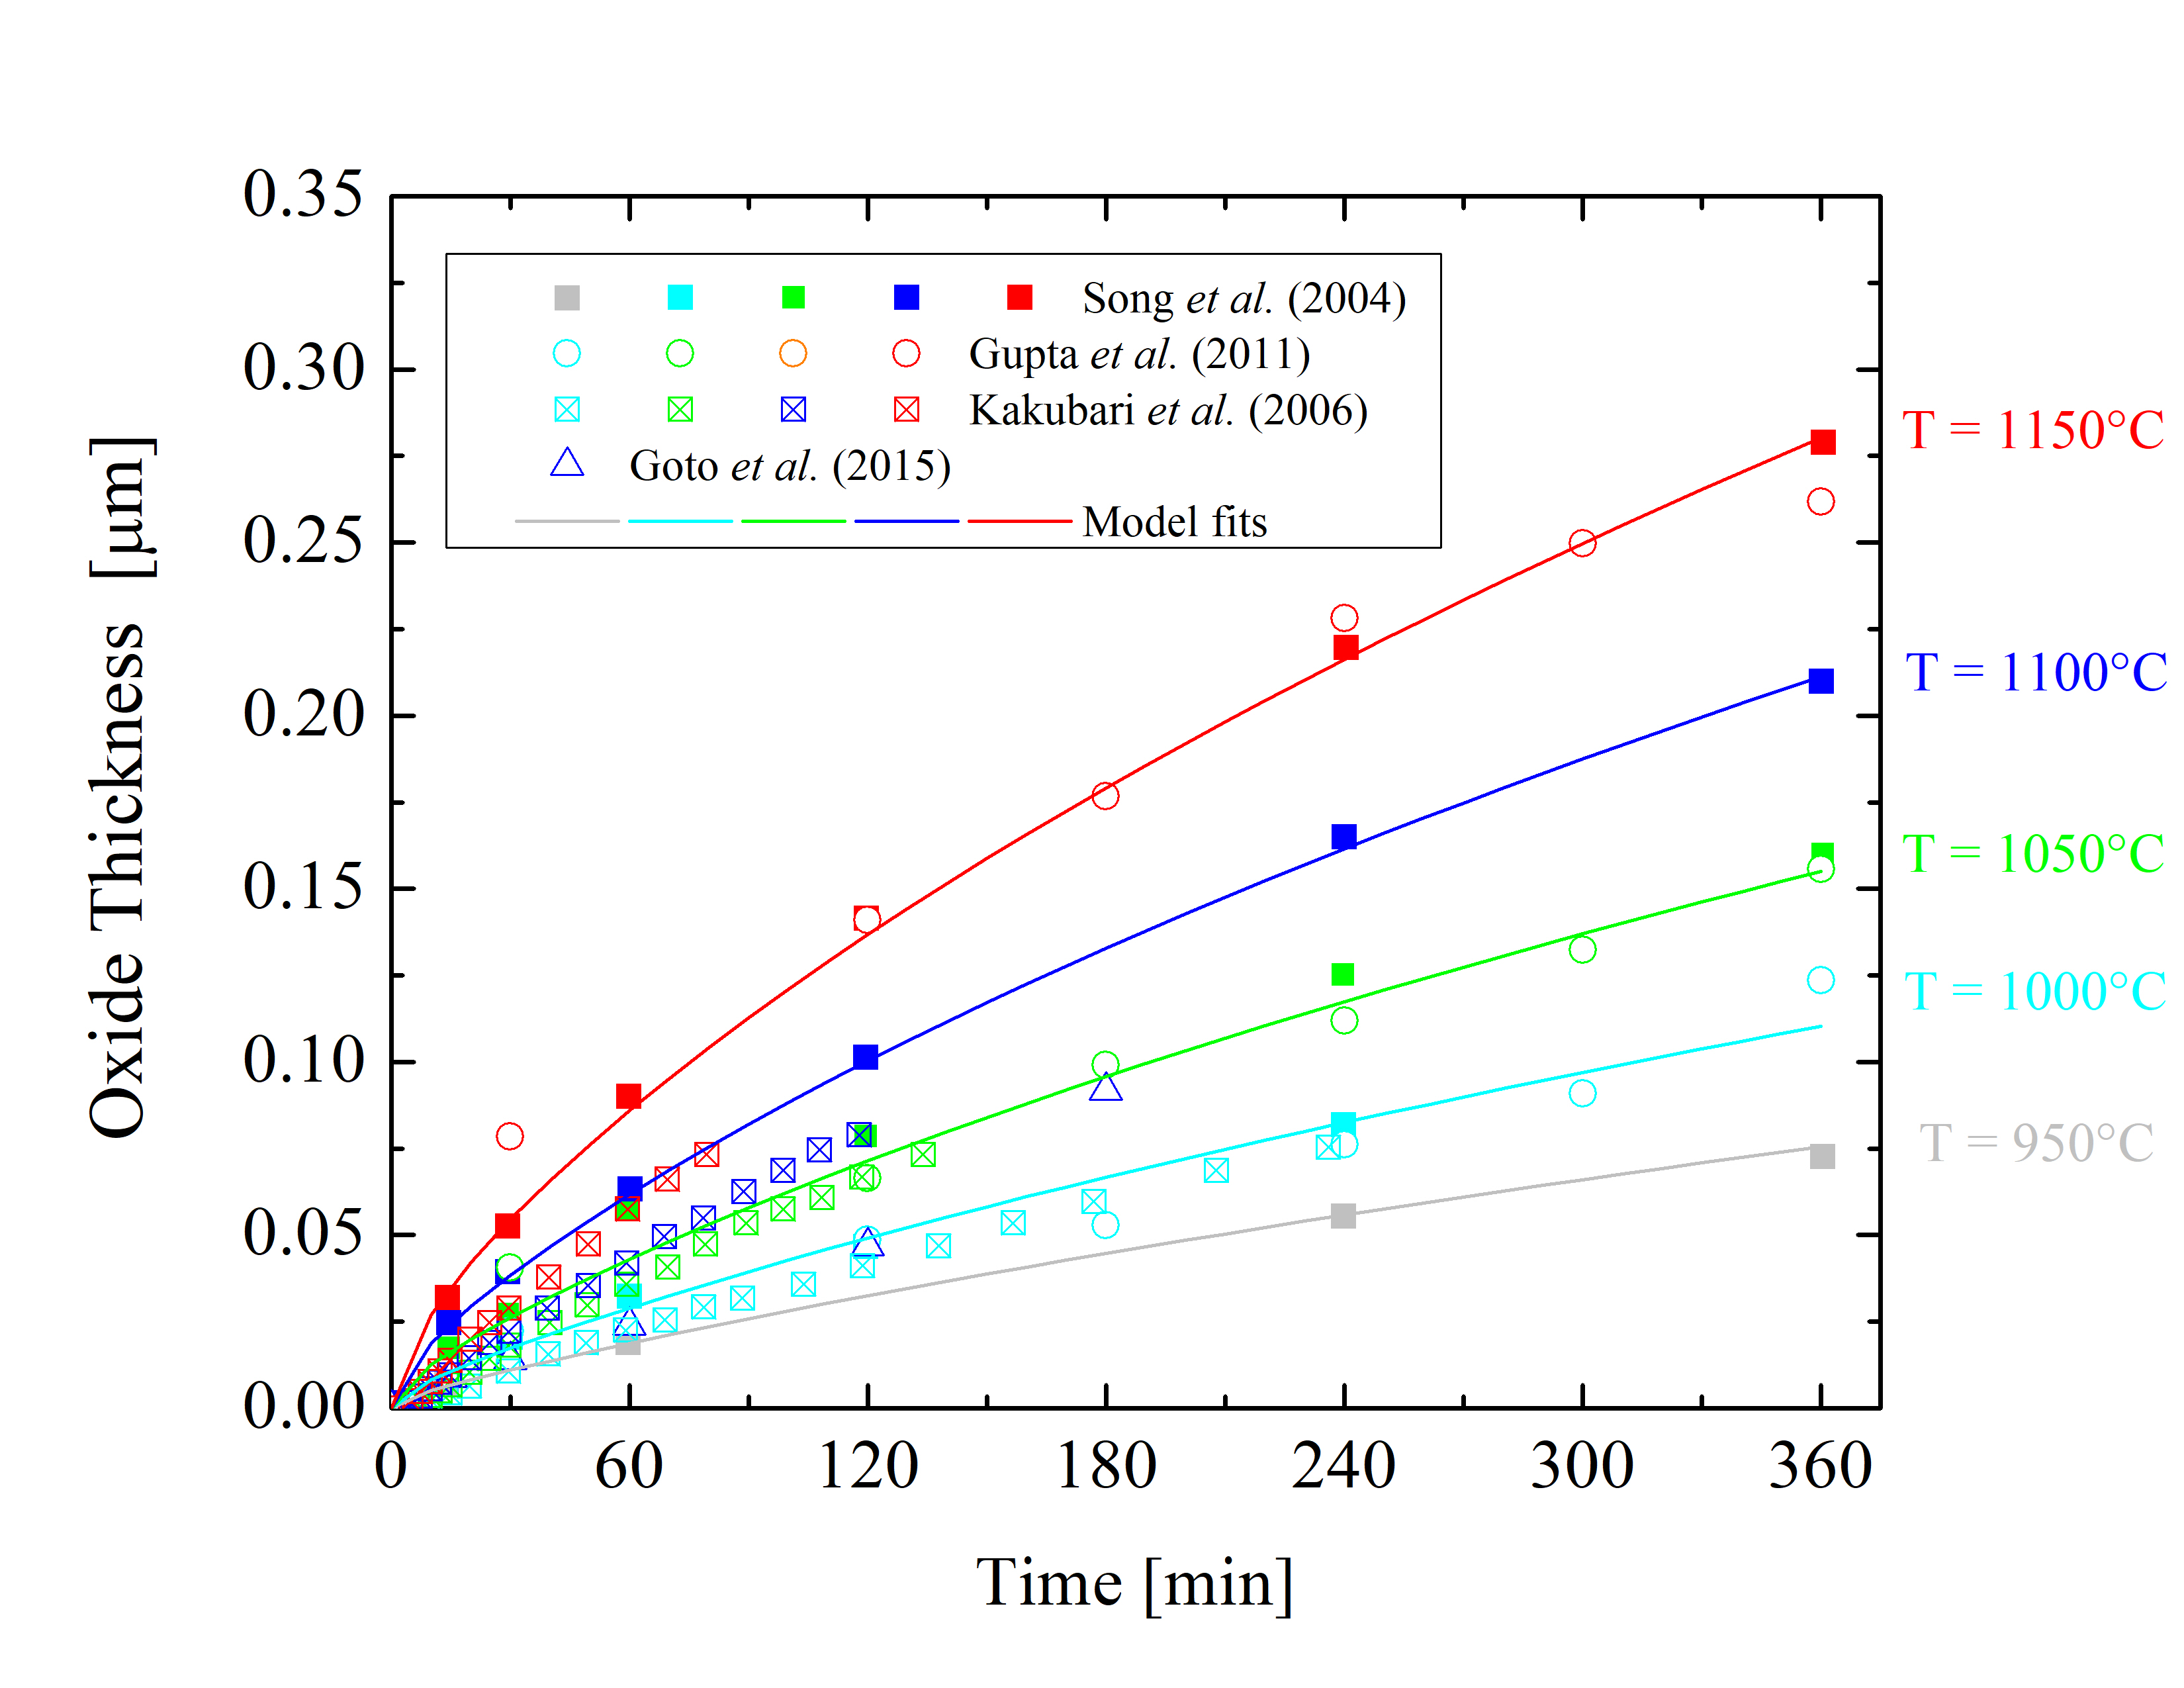
Figure 2.8: Oxide thicknesses as a function of time for various temperatures of dry thermal oxidation of the 4H-SiC \((000\bar 1)\) C-face. The solid lines are fits by (2.24), the symbols are measurements, and the colors indicate various temperatures.
The collected data is shown in Figures 2.5, 2.6, 2.7, and 2.8. The solid lines are fits using Massoud’s model and the data points are measured values obtained from Gupta et al. [89], Goto et al. [70], Song et al. [63], Hosoi et al. [58], Kakubari et al. [90], and Shenoy et al. [91]. For all the investigated oxidation temperatures, the oxide thickness is largest for the C-face followed by the m-, a-, and Si-face.
The growth of the oxide on SiC depends on various factors, e.g., cut-off angle, doping density, and crystal quality, which are the reasons for the various differences of experimental results. The most severe inconsistencies are observed in the measurements of Si-oriented SiC oxidation, as can be clearly seen in Figure 2.5. Therefore, only the data sets which yield conclusive results for the same oxidation environments and crystal orientations are fitted. The fitted curves are deviating less than 5% from the chosen measurements in the entire thickness region (2 X < A and 2 X > A), considering different surface orientations and a typical temperature range from 950 to 1150°C.
As there are no measurement sets available for the \((1\bar {1}00)\) m-face orientation, the oxidation kinetics for the m-face is predicted (Figure 2.7) according to the oxide thicknesses of the a-face [88]. The prediction is based on the oxide thickness ratio between the m- and a-face X\((1\bar 100)\)(t = 720 min)/X\((11\bar 20)\)(t = 720 min) = 1.073. Accordingly, the m-face kinetics is calculated from the oxidation kinetics of the a-face [92].
The processes of SiC oxidation can be presented by time-dependent oxide thicknesses (X(t)) or growth rates (dX/dt(t)), and/or thickness-dependent growth rates (dX/dt(X)) [64, 65]. All of the fits use an industry-proven procedure, i.e., the time-dependent oxide thickness data is fitted with the differential expression of Massoud’s model (2.24). The very well known fourth-order Runge-Kutta method [93, 94] is used to find a numerical approximation for the solution of the ordinary differential equation. The numerical integration of Massoud’s model includes the following growth rate coefficients: B/A, B, C, and L, whose values must be correctly set for accurate fitting. Thus, a fitting algorithm with an auto-step size adjustment is typically used to ensure the best fit [95]. The ratio of the SiC oxidation process highly depends on the temperature, i.e., all of the growth rate coefficients B/A, B, C, and L are temperature-dependent. The relation between the absolute temperature T and the rate constant k is typically given by an Arrhenius equation [96].
2.4.1 Arrhenius Equation
Rates of chemical reactions depend on various physical quantities, e.g., temperature and pressure. The collision theory and transition state theory implies that chemical reactions typically proceed faster at higher temperature or pressure and slower at lower temperature or pressure. The molecules move faster as the temperature increases and therefore collide more frequently, which changes the properties of the involved chemical reactions.
In order to mathematically describe and analyze the temperature dependence of chemical reaction rate coefficients, they are typically expressed with an Arrhenius equation and displayed as an Arrhenius plot, i.e., logarithm of coefficient as a function of the inverse temperature [96]. The Arrhenius equation has an important application in determining activation energies of chemical reactions and is used to model the temperature variation of diffusion coefficients, population of crystal vacancies, creep rates, and many other thermally-induced processes or reactions. The Arrhenius equation is given in the form
\( \seteqsection {2} \) \( \seteqnumber {41} \)
\begin{equation} k = Z e^{-\frac {E_\mathrm {a}}{k_\mathrm {B} T}}, \label {eq:arrhenius} \end{equation}
where Z is the pre-exponential factor, Ea the activation energy of the reaction, kB the Boltzmann constant, and T the absolute temperature. Alternatively, the Arrhenius equation may be expressed as
\( \seteqsection {2} \) \( \seteqnumber {42} \)
\begin{equation} k = Z e^{-\frac {E_\mathrm {a}}{R T}}, \label {eq:arrhenius-chem} \end{equation}
where R is the ideal gas constant.
Taking the natural logarithm of the Arrhenius equation (2.41) yields
\( \seteqsection {2} \) \( \seteqnumber {43} \)
\begin{equation} \ln {k} = - \frac {E_\mathrm {a}}{k_\mathrm {B} T} + \ln {Z}. \label {eq:arrhenius-lin} \end{equation}
The logarithmic representation has the same form as the linear function
\( \seteqsection {2} \) \( \seteqnumber {44} \)
\begin{equation} Y = K X + M, \end{equation}
where
\( \seteqsection {2} \) \( \seteqnumber {45} \)
\begin{equation} Y = \ln {k}, \end{equation}
\( \seteqsection {2} \) \( \seteqnumber {46} \)
\begin{equation} K = - \frac {E_\mathrm {a}}{k_\mathrm {B}}, \end{equation}
\( \seteqsection {2} \) \( \seteqnumber {47} \)
\begin{equation} X = \frac {1}{T}, \end{equation}
and
\( \seteqsection {2} \) \( \seteqnumber {48} \)
\begin{equation} M = \ln {Z}. \end{equation}
The linear expression of the Arrhenius equation is commonly used to determine Ea and Z of a specific chemical reaction by a linear fitting method [94].
The most common fitting approach for the linear function is the linear regression model [97] with a single explanatory variable [98, 99]. The linear regression model takes into account one independent and one dependent variable of the 2D sample of points and finds the best fit of the linear function according to the ordinary least squares method [100]. The linear regression tends to minimize the sum of the errors between the values of the fitting function and the data sets. The least-squares method thus finds its optimum, when the error Err, i.e., sum of the squared residuals,
\( \seteqsection {2} \) \( \seteqnumber {49} \)
\begin{equation} Err = \sum _{i=1}^{n} R_{i}^{2} \end{equation}
is minimal. The residual is defined as the difference between the actual value of the dependent variable Yi and the value predicted by the fitting function according to the independent variable Xi. The residual is thus
\( \seteqsection {2} \) \( \seteqnumber {50} \)
\begin{equation} R_{i} = Y_{i} - f(X_{i}). \end{equation}
With a simple linear regression analysis and the linear expression of the Arrhenius equation (2.43) any temperature-dependent parameter can be fitted. With this approach one is able to obtain Ea and Z for each of the oxidation growth rate coefficients.
2.4.2 Calibrated Parameters
The growth rate coefficient B of Massoud’s model describes the diffusivity in SiO2. Therefore, B is determined by the nature of the oxide. Thus, B is not crystal orientation-dependent, but is identical for all SiC orientations. Since converting a SiC molecule into SiO2 and CO (as in the case for SiC oxidation) consumes 1.5 times the amount of oxygen than converting Si into SiO2 only (as in the case for Si oxidation), B is assumed to be 1/1.5 of that of Si [70]
\( \seteqsection {2} \) \( \seteqnumber {51} \)
\begin{equation} B = \frac {2D^\mathrm {SD}_\mathrm {O}}{1.5}, \label {eq:B} \end{equation}
where DSDO is the oxygen self-diffusivity in SiO2 for the Si oxidation. The diffusivity is in general temperature-dependent and can be predicted by an Arrhenius equation [101]
\( \seteqsection {2} \) \( \seteqnumber {52} \)
\begin{equation} D^\mathrm {SD}_\mathrm {O} = D_0 e^{\left (-\frac {E^\mathrm {SD}_a}{k_\mathrm {B} T}\right )}, \label {eq:diffusivity} \end{equation}
where D0 is the diffusion coefficient and EaSD is the activation energy. In the case of Si oxidation, D0 = 192 μm2 min-1 and EaSD = 1.64 eV, as reported in Kageshima et al. [101]. Accordingly, the value of B is assumed to be
\( \seteqsection {2} \) \( \seteqnumber {53} \)
\begin{equation} B = 256 \cdot e^{\left (-\frac {1.64 \mathrm { eV}}{k_\mathrm {B} T}\right )} \mathrm { } \mu \mathrm {m}^2 \mathrm { min}^{-1}. \label {eq:B_final} \end{equation}
The rest of the growth rate coefficients (B/A, C, and L) are highly orientation-dependent. These are determined with the fitting procedure as shown in Figures 2.5, 2.6, 2.7, and 2.8. The temperature dependence of the parabolic growth rate coefficient B, the linear growth rate coefficient B/A, the initial enhancement parameter C, and the characteristic length L are shown in Figures 2.9, 2.10, 2.11, and 2.12, respectively.
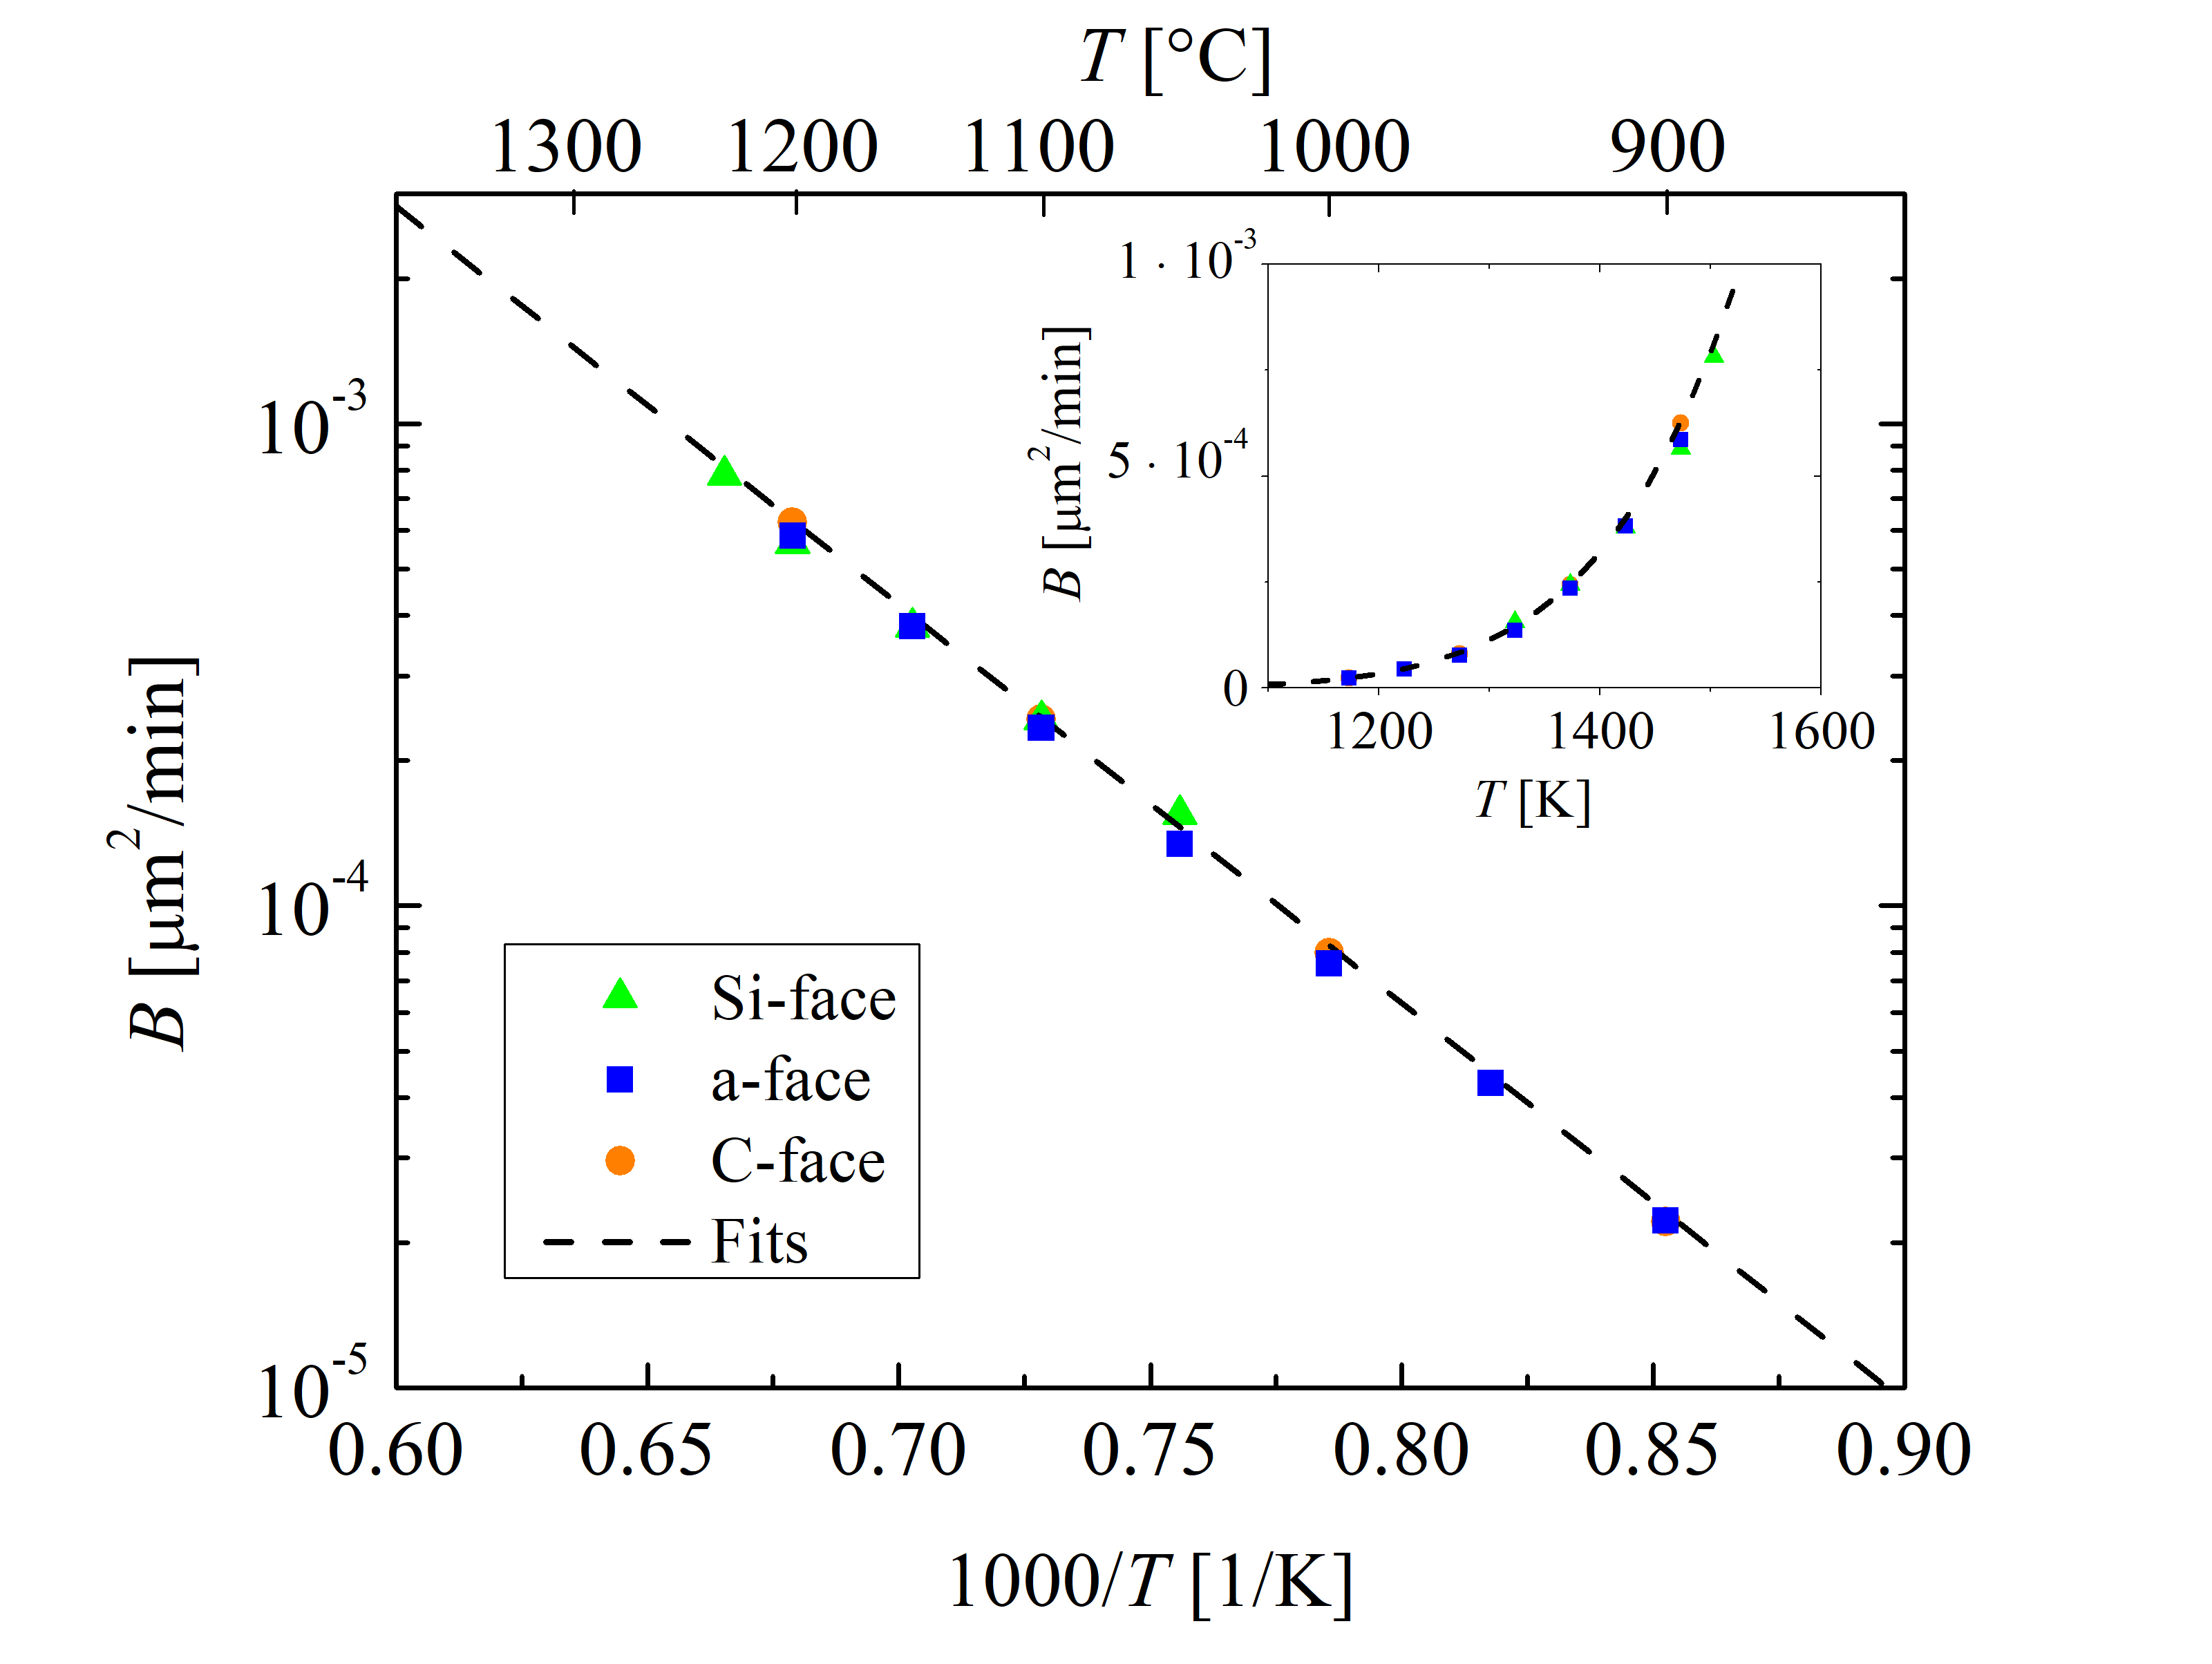
Figure 2.9: Temperature-dependent parabolic growth rate coefficient B for the \((0001)\) Si- (green triangles), the \((11\bar 20)\) a- (blue squares), the \((1\bar 100)\) m- (red diamonds), and the \((000\bar 1)\) C-face (or- ange circles) of 4H-SiC dry thermal oxidation. The data sets for the Si-, a-, and C-face (symbols) are obtained from experimental findings [70]. The dashed lines represent fits by (2.53). The inset figure shows linear y axis and non-reciprocal x axis.
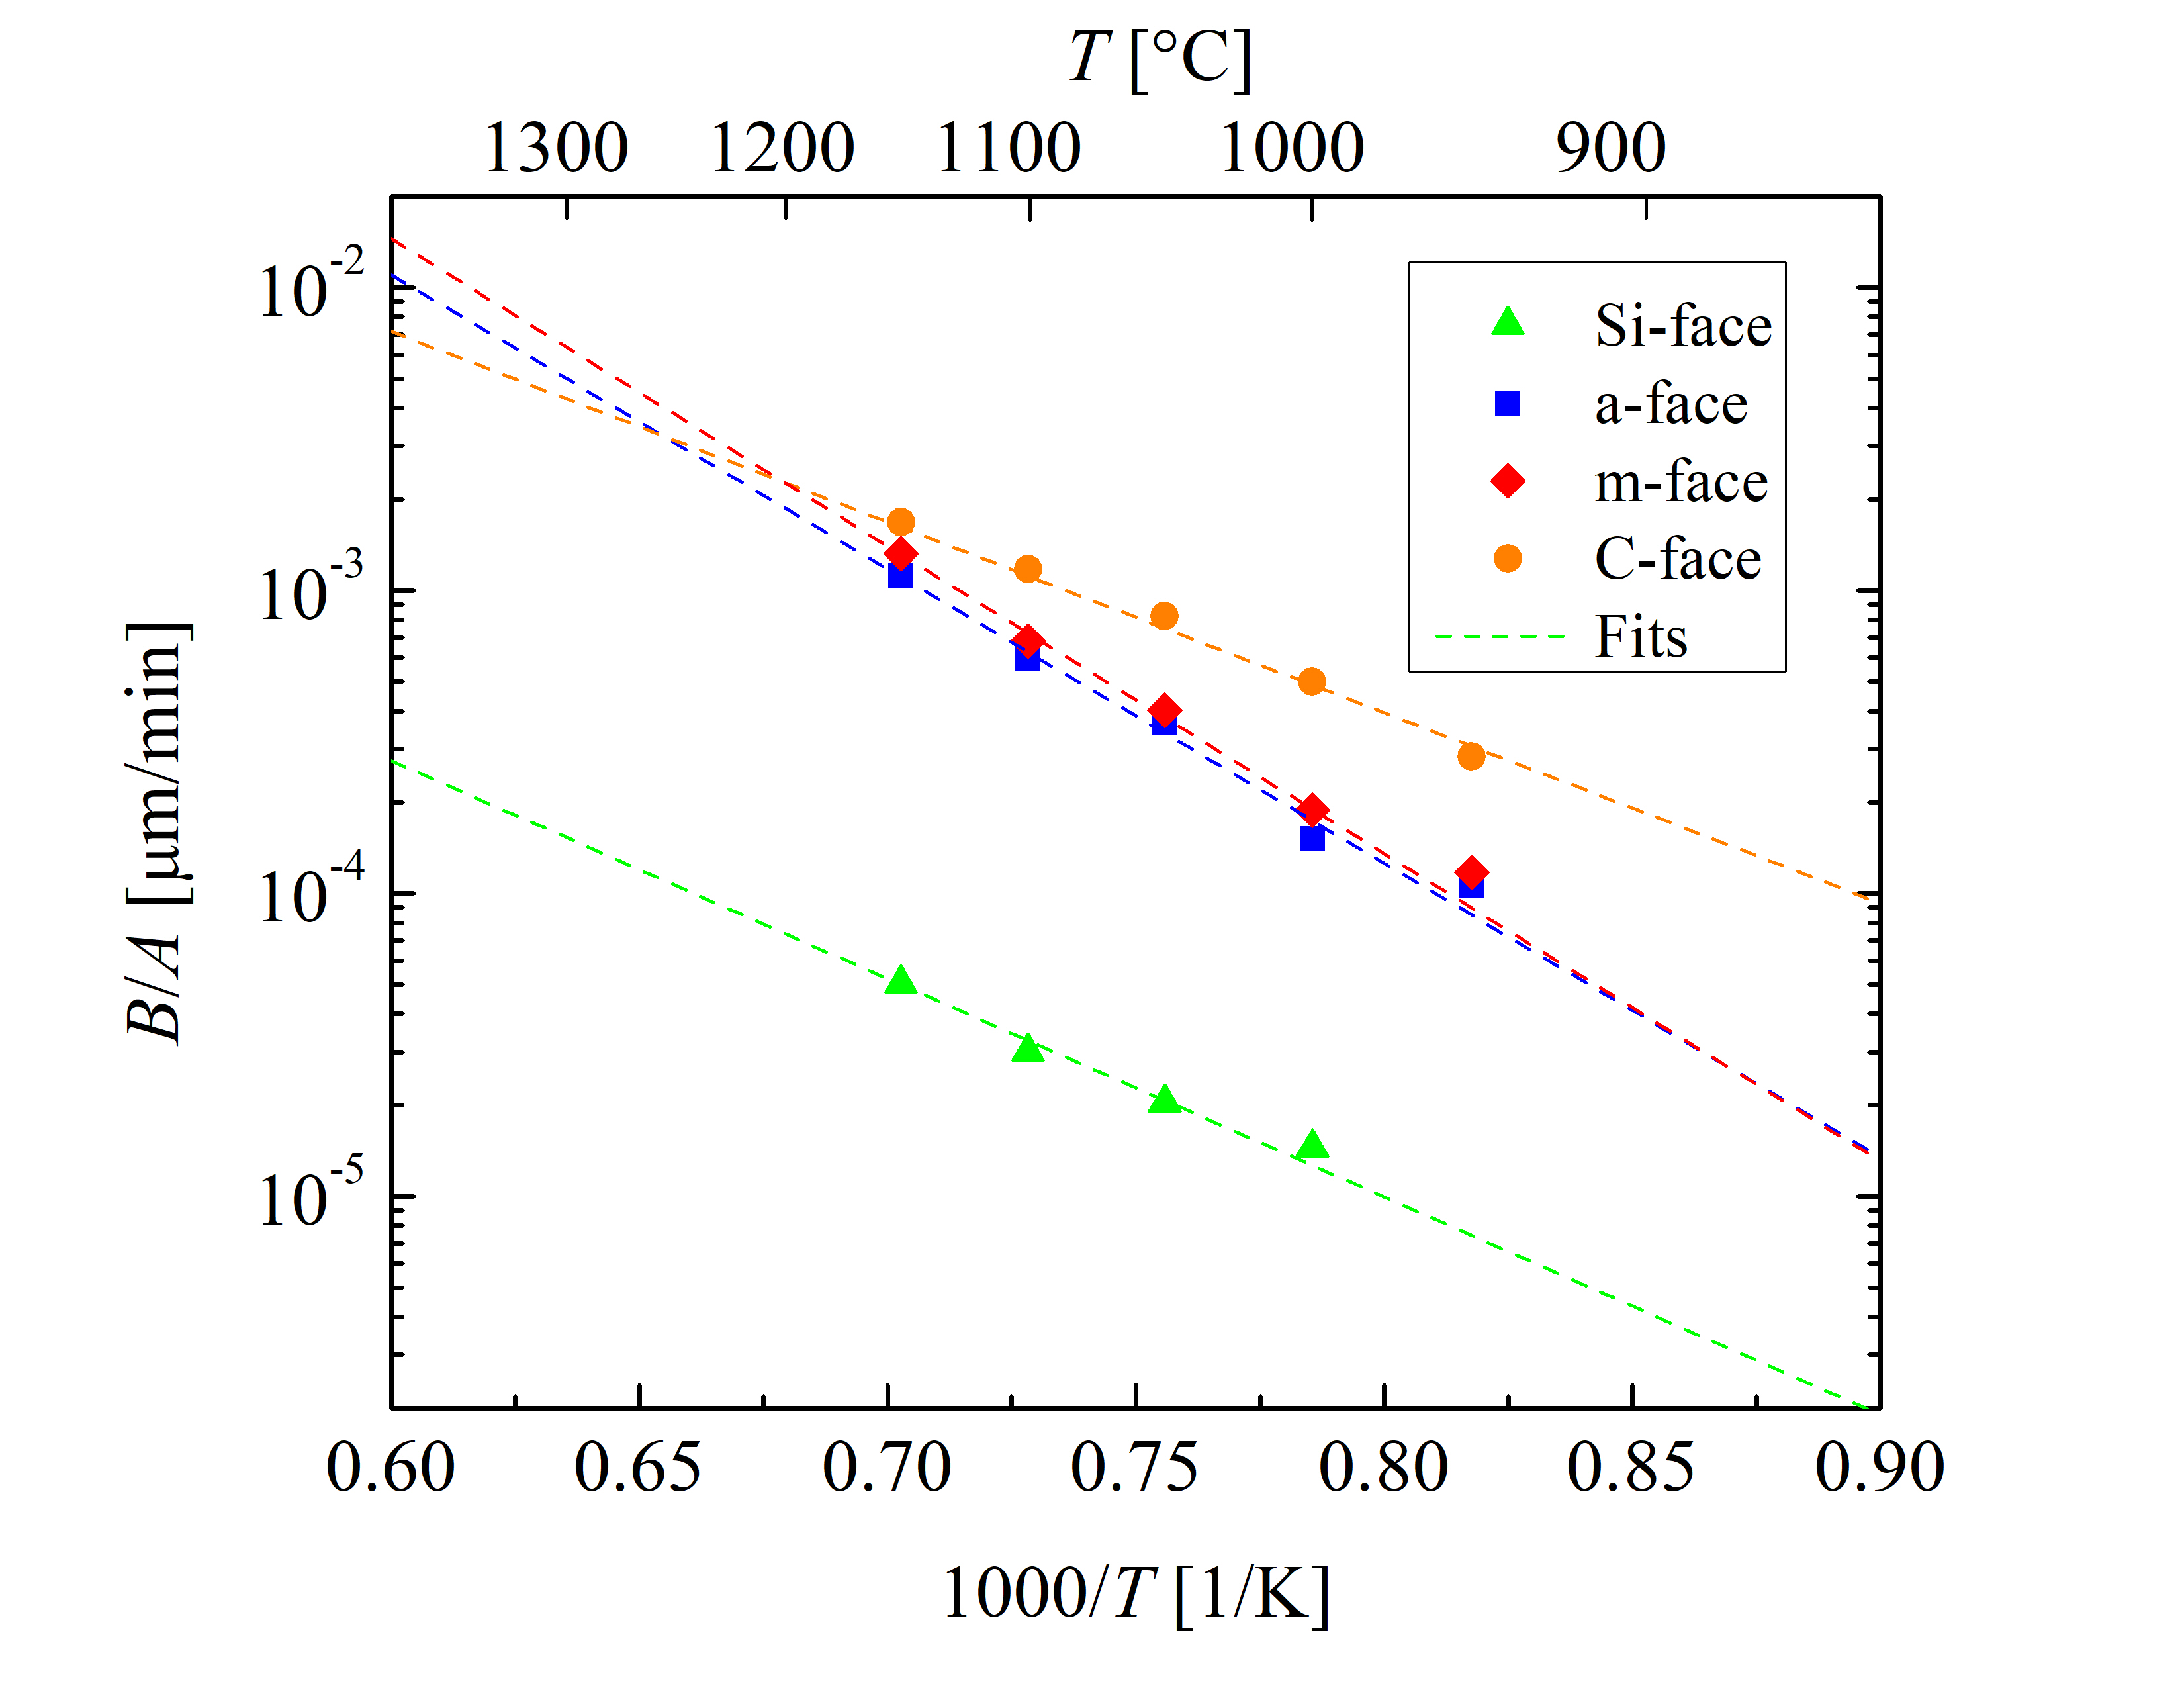
Figure 2.10: Temperature-dependent linear growth rate coefficient B/A for the \((0001)\) Si- (green triangles), the \((11\bar 20)\) a- (blue squares), the \((1\bar 100)\) m- (red diamonds), and the \((000\bar 1)\) C-face (or- ange circles) of 4H-SiC dry thermal oxidation. The rate coefficients at various temperatures (symbols) are obtained by fitting Massoud’s model to the data shown in Figures 2.5, 2.6, 2.7, and 2.8. The dashed lines represent fits by the Arrhenius equa- tion (2.43).
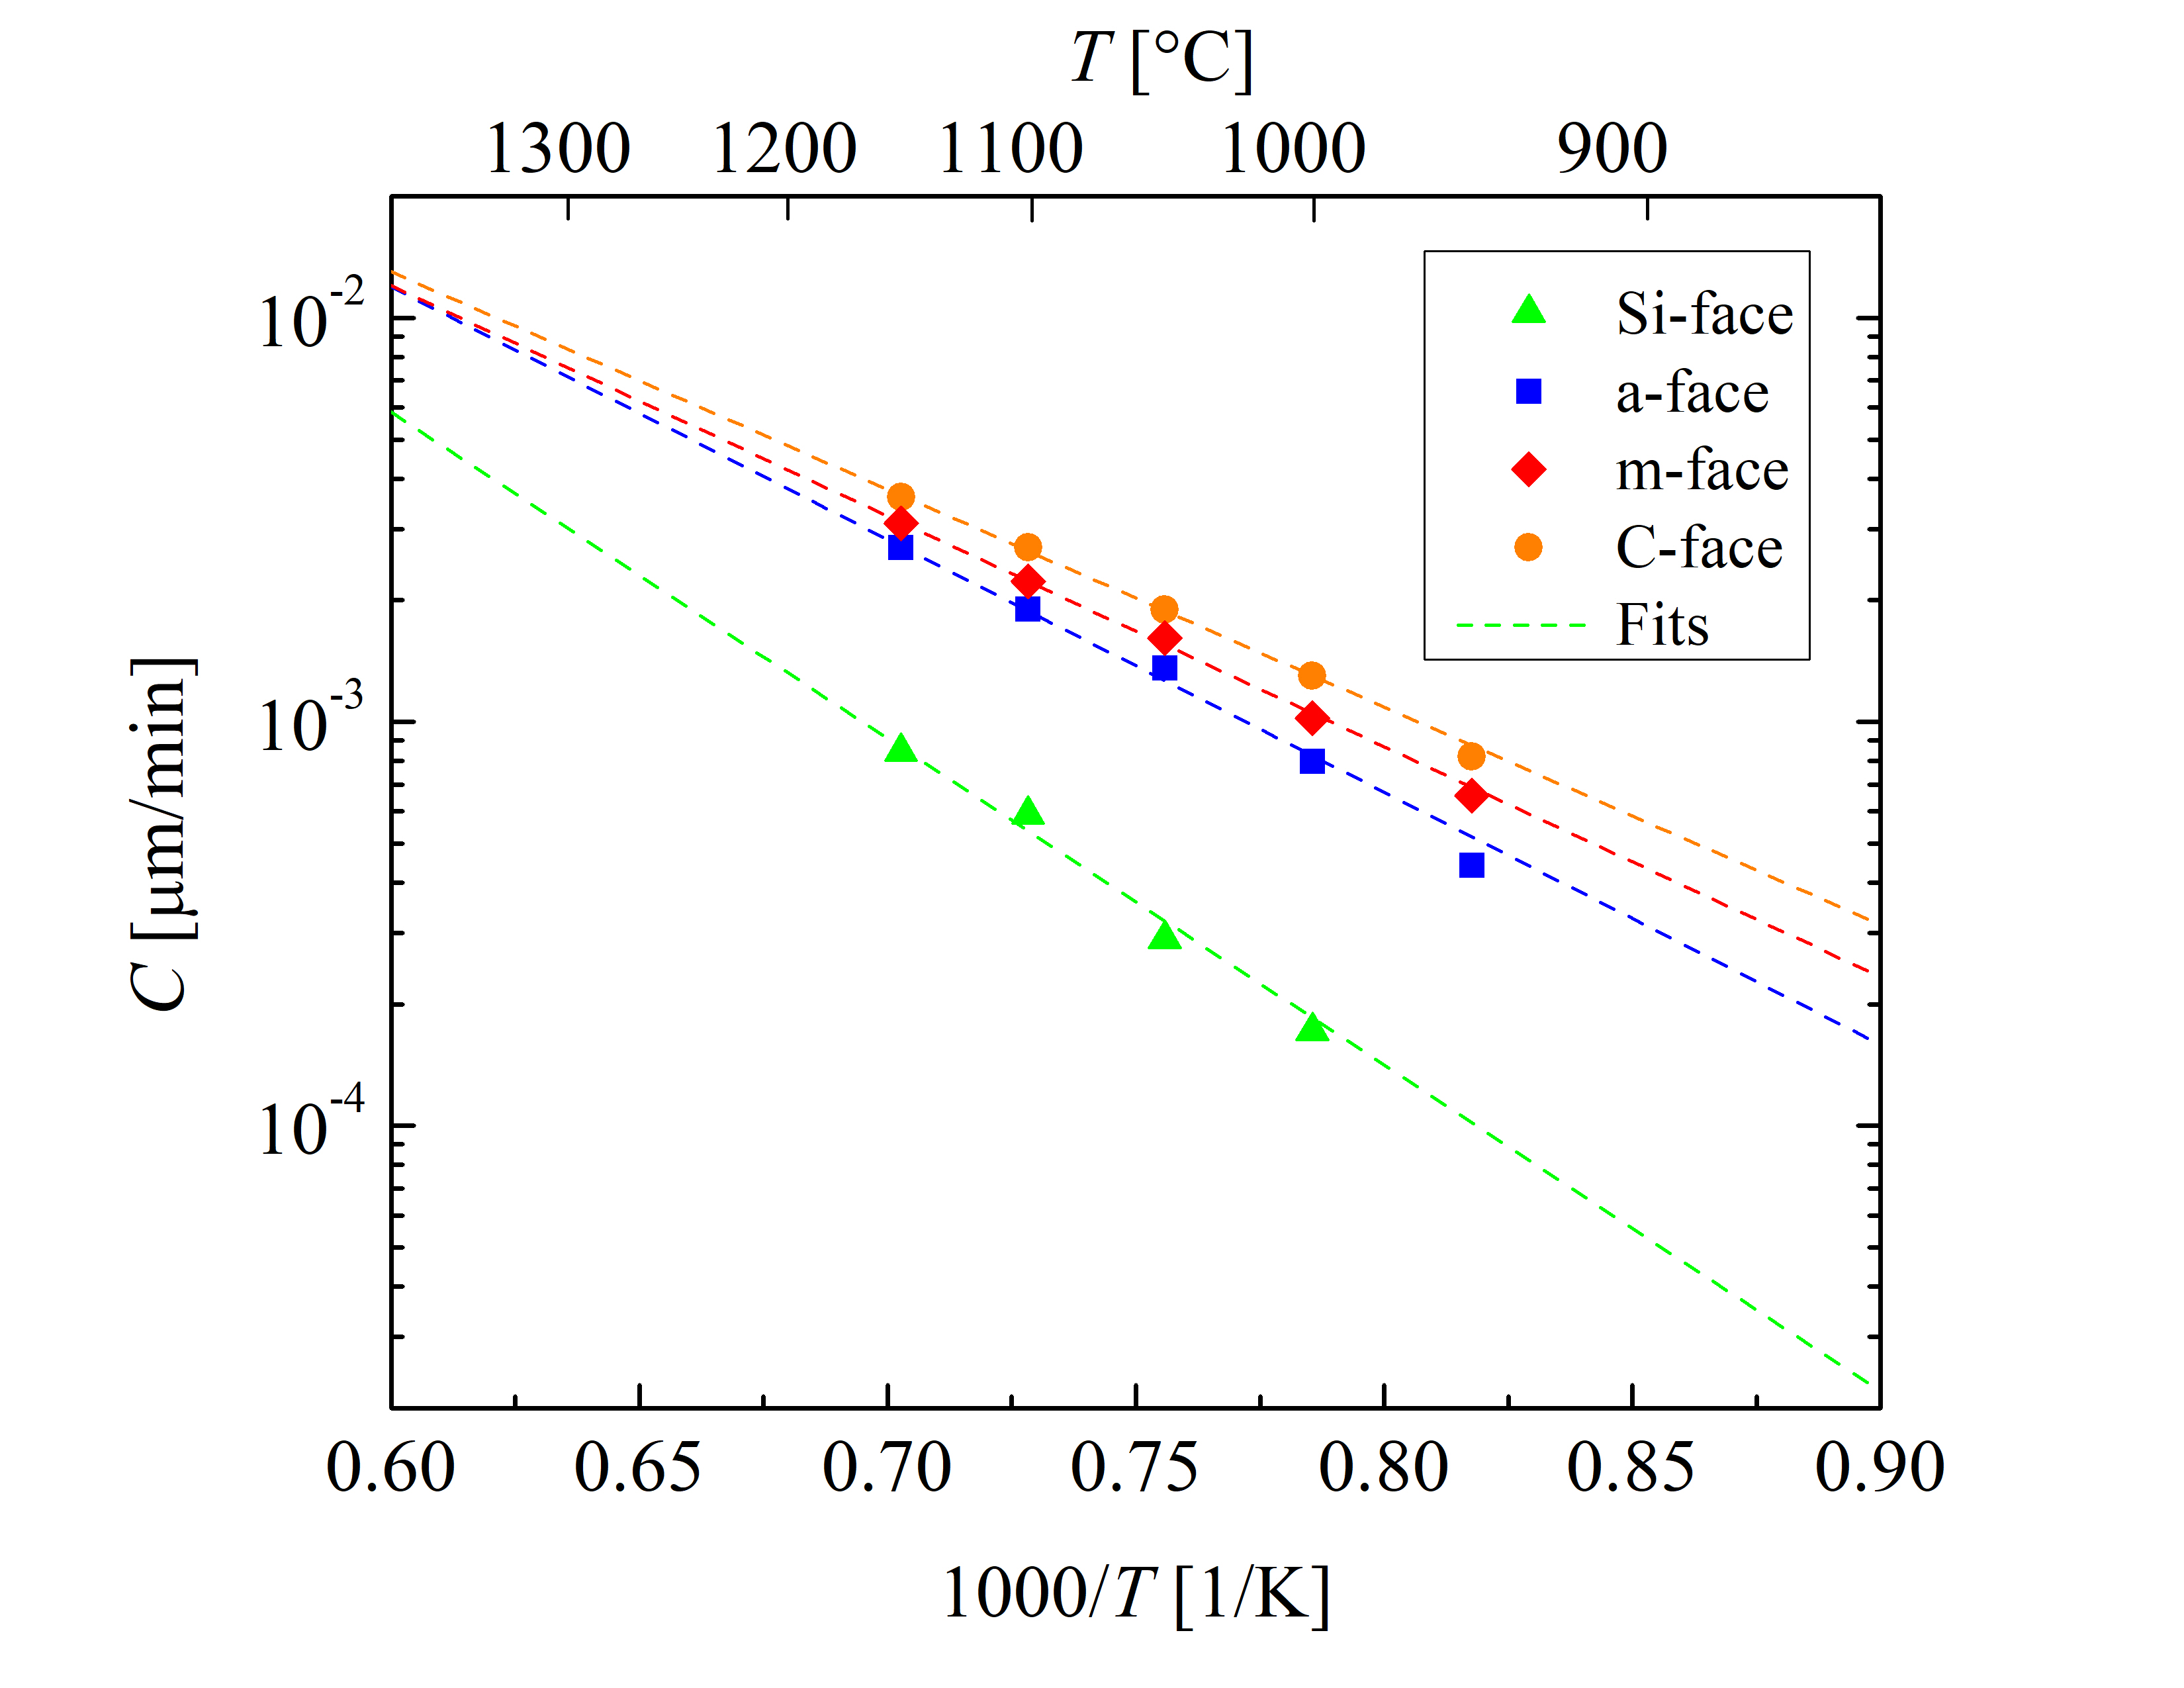
Figure 2.11: Temperature-dependent initial enhancement parameter C for the \((0001)\) Si- (green triangles), the \((11\bar 20)\) a- (blue squares), the \((1\bar 100)\) m- (red diamonds), and the \((000\bar 1)\) C-face (or- ange circles) of 4H-SiC dry thermal oxidation. The rate coefficients at various temperatures (symbols) are obtained by fitting Massoud’s model to the data shown in Figures 2.5, 2.6, 2.7, and 2.8. The dashed lines represent fits by the Arrhenius equa- tion (2.43).
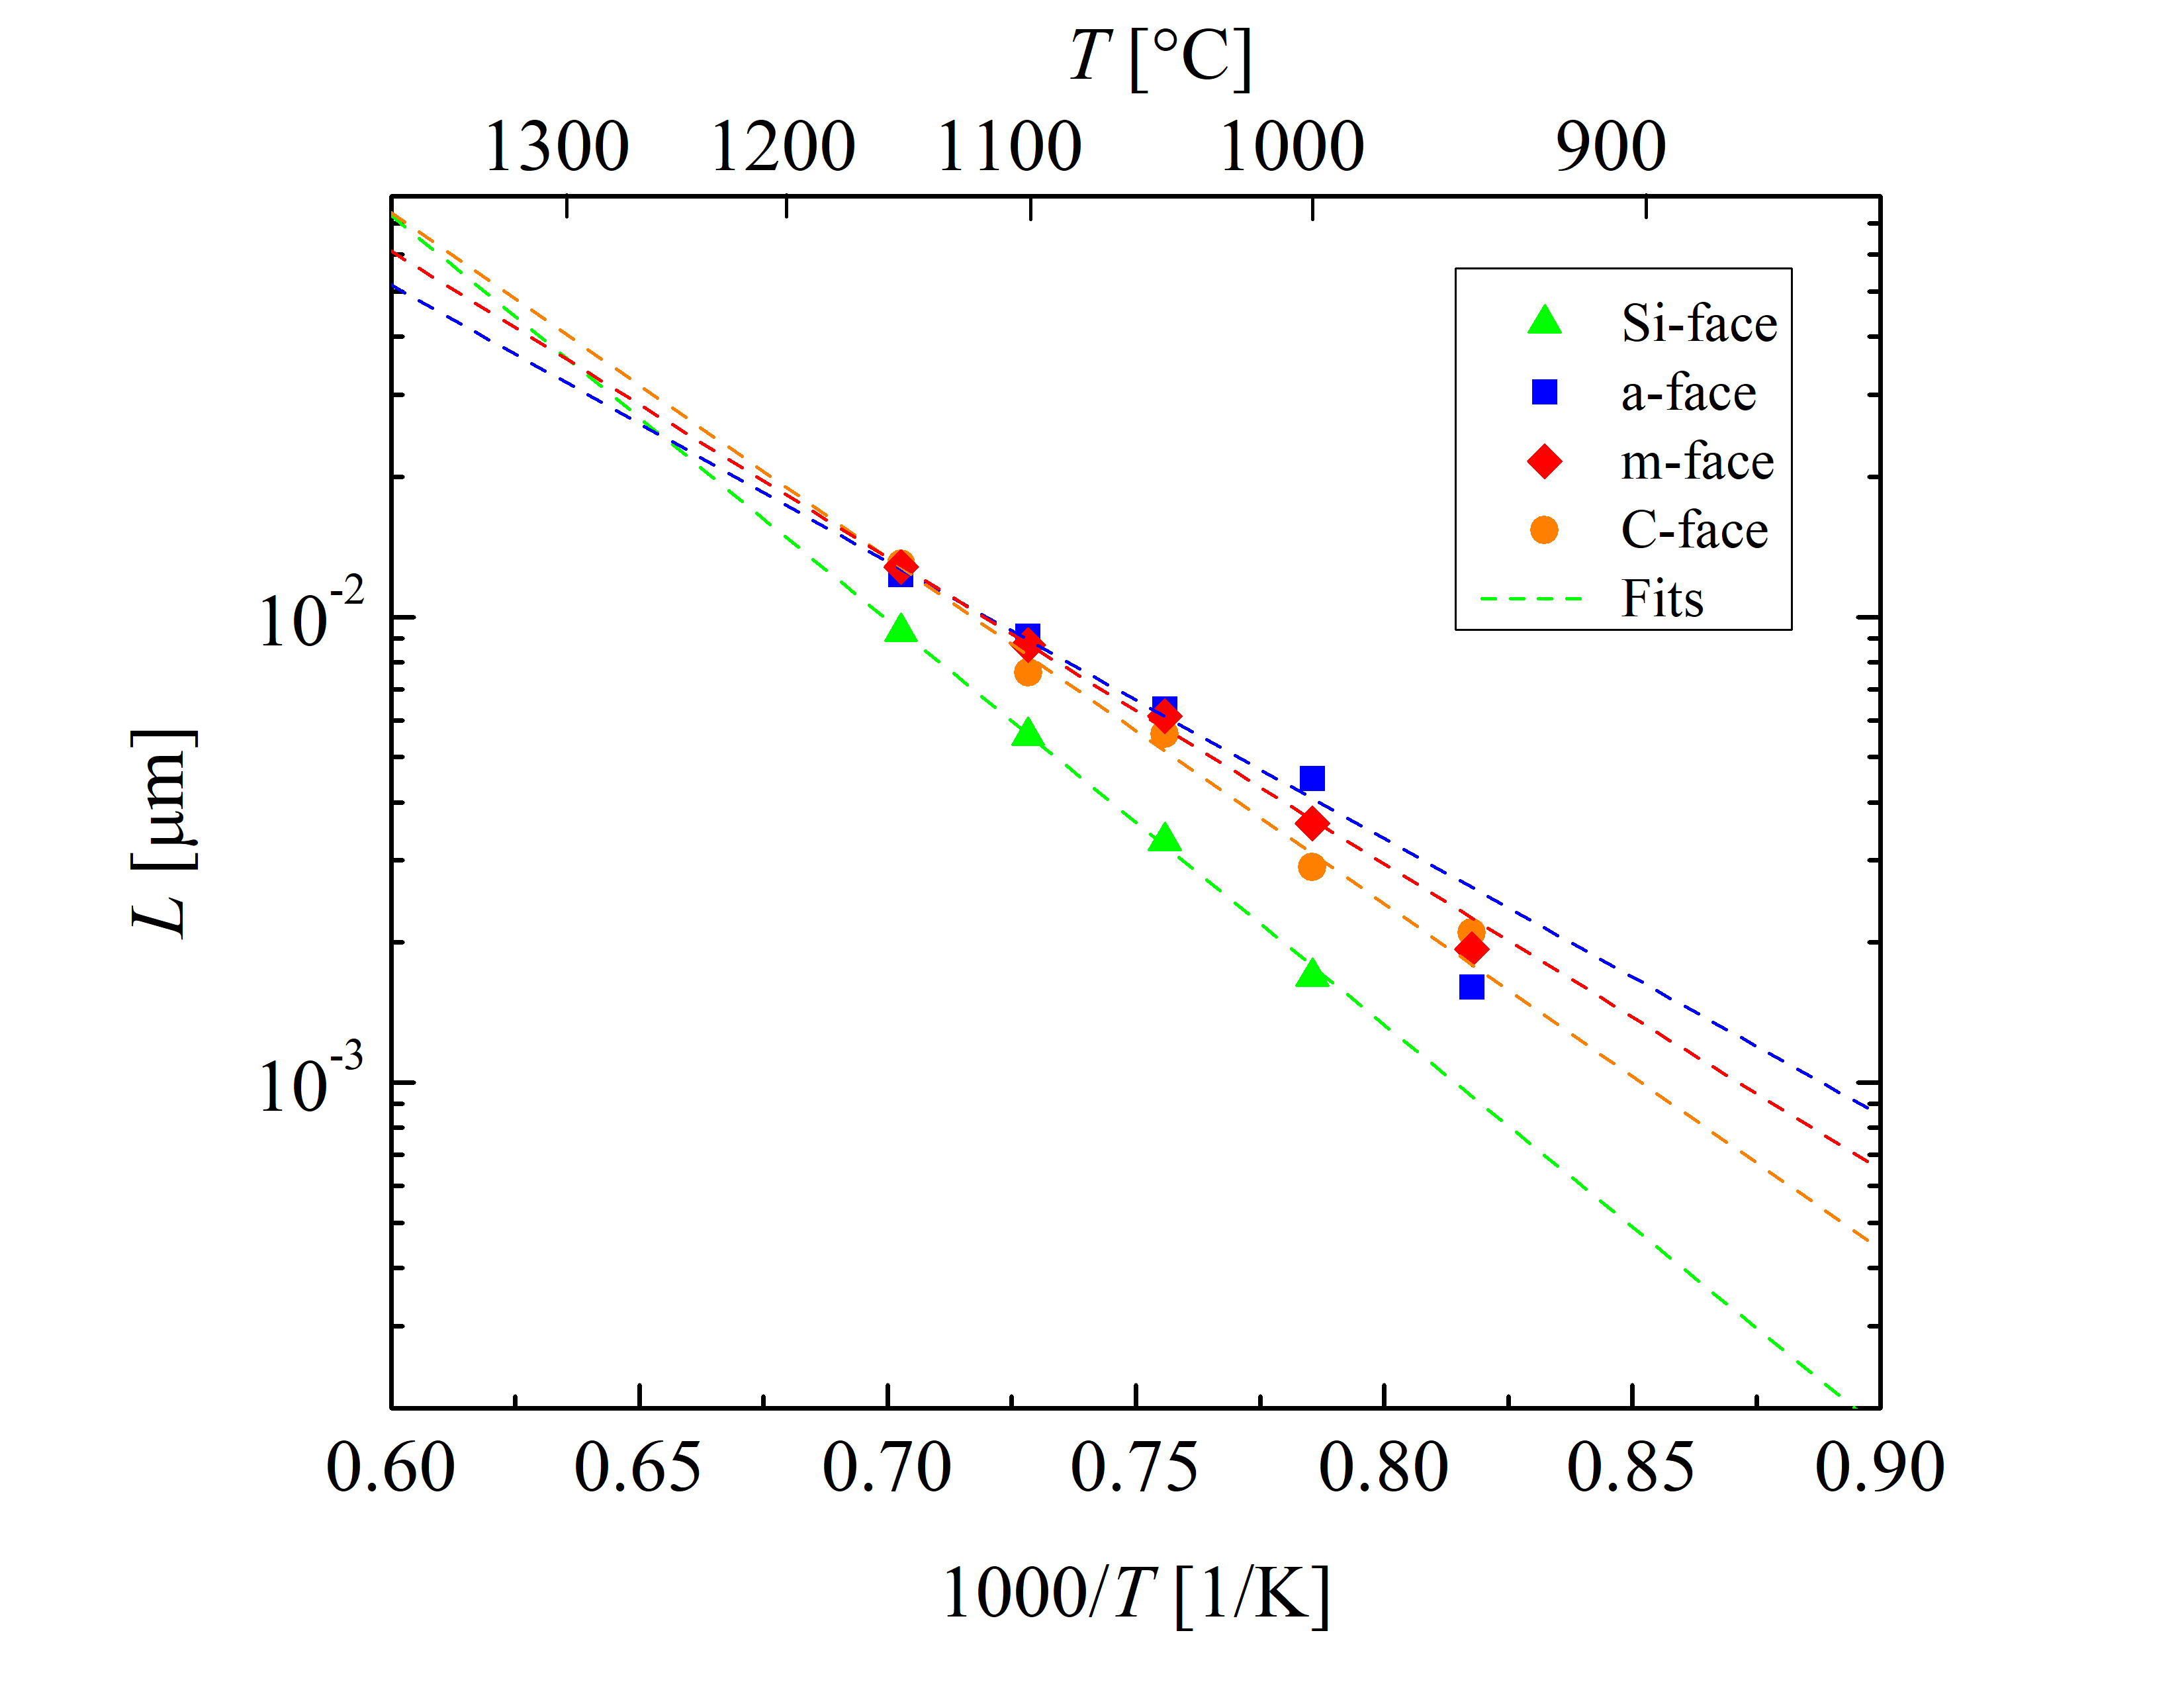
Figure 2.12: Temperature-dependent characteristic length L for the \((0001)\) Si- (green triangles), the \((11\bar 20)\) a- (blue squares), the \((1\bar 100)\) m- (red diamonds), and the \((000\bar 1)\) C-face (orange circles) of 4H-SiC dry thermal oxidation. The rate coefficients at various temperatures (symbols) are obtained by fitting Massoud’s model to the data shown in Figures 2.5, 2.6, 2.7, and 2.8. The dashed lines represent fits by the Arrhenius equa- tion (2.43).
The slopes of the Arrhenius plots of the Si- and the C-face (Figure 2.10) are almost identical, i.e., the values of the activation energies Ea are comparable for both orientations. The activation energy of the linear growth rate coefficient defines the interfacial reaction rate and is strongly correlated with the crystal structure of the oxidizing surface [102, 89]. Additionally, it is evident that the slopes of the Arrhenius plot of the a- and m-face are almost identical as well. Therefore, the activation energies are expected to be similar for surfaces with similar structures, which is verified by Figure 2.10.
The crystal structure of 4H-SiC is almost identical for the Si-face (top) and C-face (bottom), as well as for the a- (one side) and m-face (another side of the crystal). Comparing this observation with the thermal oxidation of Si, the interface chemical reaction is almost the same for the Si- and the C-face [103]. Nevertheless, the oxidation growth rates for the Si and the C-face are different as the areal density of atoms and the mechanical stress effects at the interface play a crucial role in the oxidation, which can be explained by the magnitude of the pre-exponential factor of the linear growth rate coefficient [63]. This is in agreement with recent theoretical findings [72], where the differences in the growth rates of the Si- and the C-face are mainly significant in the pre-exponential factor Z, which is an order of magnitude larger for the C-face compared to the Si-face. Figure 2.10 also shows that the activation energies of the m- and a-face are higher than the activation energies of the C- and the Si-face. Additionally, the results in Figure 2.10 suggest that the difference of the linear growth rate coefficient between the a- and m-face is negligible for the low temperature regime, which is in agreement with experimental findings [86].
Figure 2.11 shows that the growth rate enhancement parameter for thin oxides for all four crystallographic faces is temperature-dependent. These results suggest that the initial oxidation growth rate is highest for the C-face, followed by the m, a, and Si-face orientation. By comparing the results of Figures 2.10 and 2.11 it becomes clear that the ratios of the growth rate coefficients between the four crystallographic faces are different. This suggests that the temperature dependence of the initial and the linear growth rates is diverse. The values of B/A are in the same order of magnitude than the values of C, hence, the contribution of the initial oxide growth enhancement cannot be neglected [68, 66]. This fact is in alignment with the already established knowledge that the Deal-Grove model cannot accurately predict the oxidation kinetics for SiC.
The results in Figure 2.12 suggest that also the characteristic length L is temperature- and orientation-dependent. L is determined by the oxidation and the diffusion coefficient of SiO2 interstitials and the emission ratios of Si and C interstitials. An increase in the diffusion coefficient leads to an increase of L, while an increase of the oxidation coefficient or the emission ratio of interstitials leads to a reduction of L [70]. The results in Figure 2.12 are consistent with the reports from experimental findings [70, 80], which suggest that a temperature increase is more significant for the diffusion coefficient than the oxidation coefficient or emission ratios.
Higher values of L are observed for the C-face orientation than for the Si-face for the temperature regime below 1265°C, which is consistent with the predictions that the emission ratio for the Si-face is significantly larger than that for the C-face [104, 71]. Interestingly, higher values of L for the m- and the a-face than the ones for the C-face are in addition observed for T < 1265°C, i.e., the initial growth enhancement is larger for the m- and the a-face for this temperature regime. It is believed that the reason for this phenomenon is a higher diffusion coefficient, lower emission ratio, and lower oxidation coefficient of the m- and the a-face compared to the C-face [72]. Results in Figure 2.12 also suggest that the above mentioned relations are reversed for temperatures above 1265°C. In addition, the differences in L between the Si and the C-face at very high oxidation temperatures are lower than 5%. Therefore, in the high-temperature region the value of L for both these faces is approximately the same.
An overview of the activation energies and the pre-exponential factors of the Arrhenius plots for all four inspected crystallographic faces is provided in Table 2.2. As discussed before, the pre-exponential factor has a significant role in the temperature dependence of the SiC oxidation kinetics. Therefore, it is always necessary to present Arrhenius plots, enabling to consider Ea together with Z.
With these validated parameters (Table 2.2) it is now possible to accurately calculate multi-dimensional 4H-SiC oxidation kinetics. The predicted oxidation growth rates as a function of oxide thickness for the Si-, a-, m-, and C-face at various relevant temperatures (T = 950, 1000, 1050, 1100, and 1150°C) are shown in Figure 2.13. The calculations suggest that the initial enhancement of the oxide growth is strongest for the Si-face. Furthermore, at low temperatures the differences in the growth rates between the m- and the a-face orientations are less than 5%.
Table 2.2: Activation energies and pre-exponential factors of the Arrhenius plots for the \((0001)\) Si-, \((11\bar 20)\) a-, \((1\bar 100)\) m-, and \((000\bar 1)\) C-face of 4H-SiC dry thermal oxidation. The linear rate coefficient B/A, the initial enhancement parameter C, and the characteristic length L have been obtained by fitting Eq. (2.43) to the data presented in Figure 2.10, 2.11, and 2.12.
| 4H-SiC | B/A | C | L | ||||
| face | Ea [eV] | Z [μm/min] | Ea [eV] | Z [μm/min] | Ea [eV] | Z [μm] | |
| Si | 1.429 | 5.751 | 1.604 | 412.9 | 1.724 | 1.190 · 104 | |
| a | 1.927 | 7.404 · 103 | 1.241 | 67.51 | 1.180 | 189.5 | |
| m | 2.015 | 1.791 · 104 | 1.132 | 31.84 | 1.305 | 539.8 | |
| C | 1.249 | 42.70 | 1.069 | 22.22 | 1.473 | 2.096 · 103 | |
Additionally, the growth rate of the C-face is significantly larger compared to the other orientations at low temperatures, e.g., T = 950°C, the average growth rates for the Si-, a-, m-, and C-face are 0.12 · 10-4, 0.90 · 10-4, 0.93 · 10-4, and 1.82 · 10-4 μm/min, respectively. On the other hand, this difference is less pronounced at higher temperatures, e.g., T = 1150°C, the average growth rates for the Si-, a-, m-, and C-face are 0.93 · 10-4, 5.70 · 10-4, 6.02 · 10-4, and 6.39 · 10-4 μm/min, respectively.
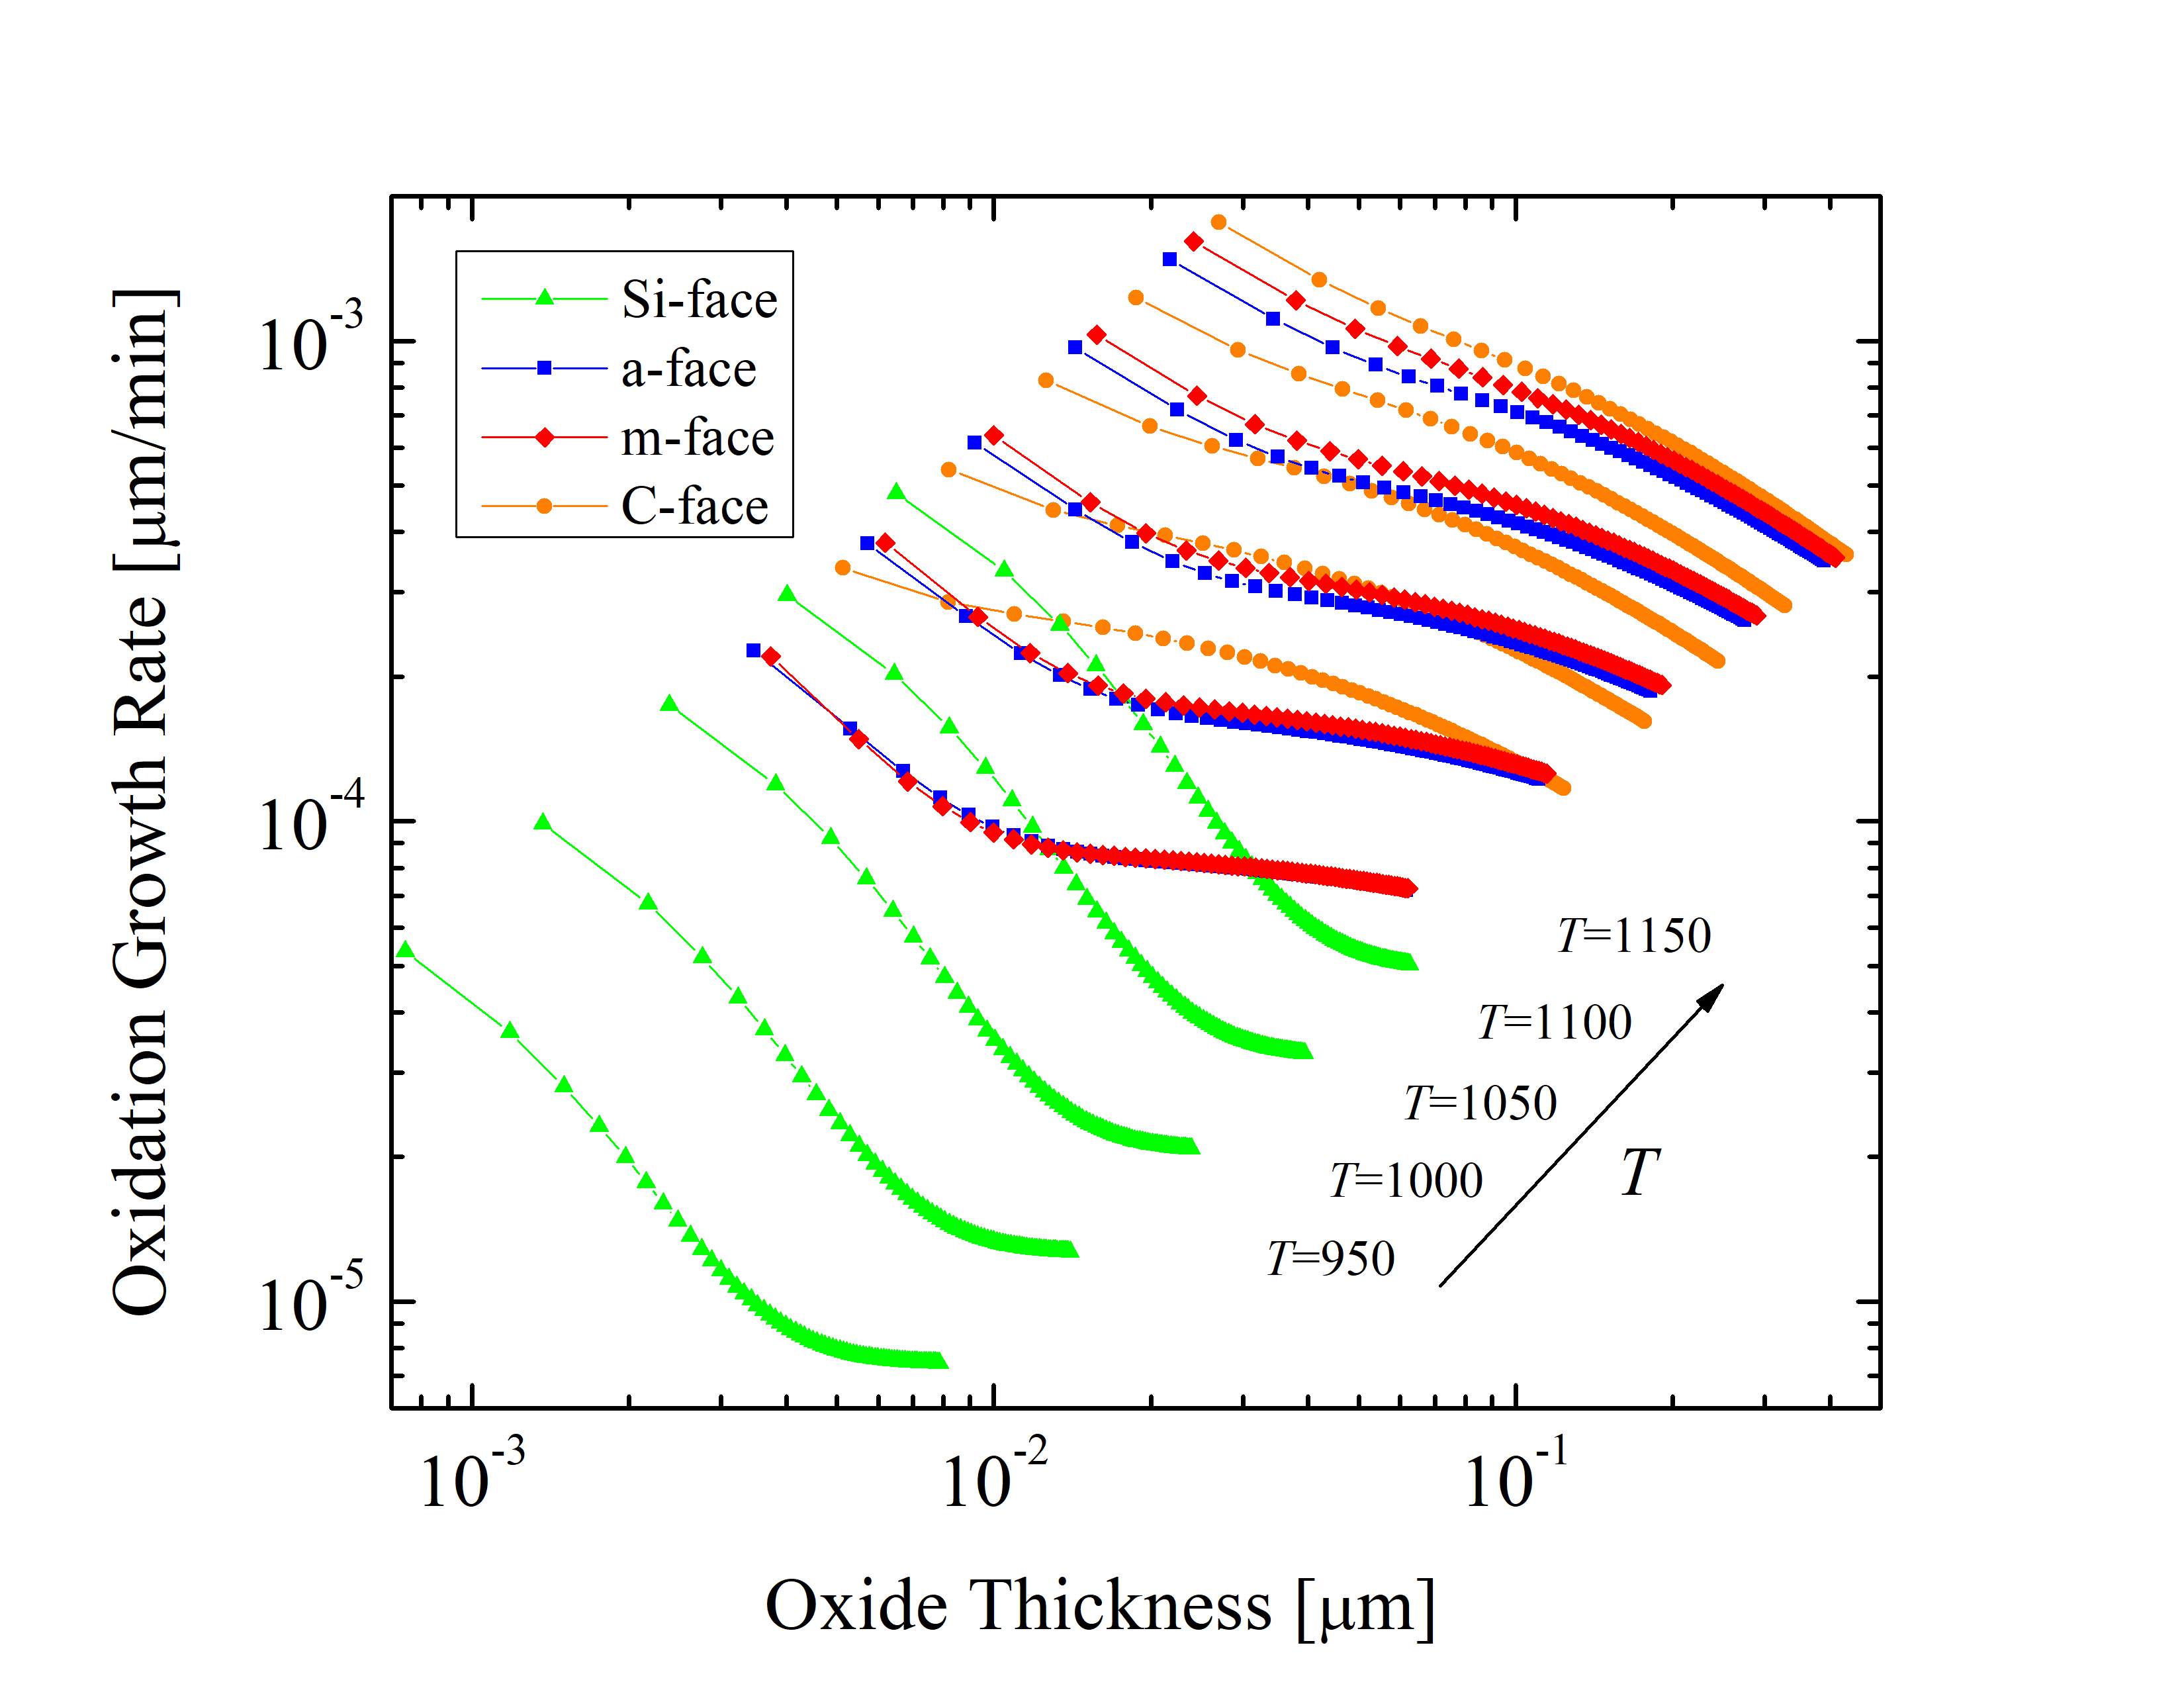
The saturation of the oxidation process depends on the temperature and pressure as well as on the chemical nature of the substances. The derivatives of the curves shown in Figure 2.13 indicate that the saturation of the oxide growth is highest, i.e., the oxidation process is hindered the most, for Si-oriented SiC. This is consistent with experimental and theoretical reports [70, 66, 69]. The calculations corroborate that the saturation of SiC oxidation is indeed orientation-dependent. However, in order to describe the oxidation in an arbitrary crystal direction, an extension of the oxidation models is necessary.