3.3 Semi-Empirical Model
In the previous section a temperature-dependent activation model has been demonstrated in detail. However, the post-implantation annealing steps of process simulations are much more complex, i.e., include many more dependences. Besides the annealing temperature the next most significant dependence is on the total doping concentration [1]. Both process variables (TA and Ctot) are essential in order to maximize the efficiency of SiC devices and must be accurately predicted by TCAD process simulations. For this reason, the semi-empirical activation model has been proposed, evaluated, and tested [154] and is presented in the following.
3.3.1 Methodology
The semi-empirical model has been inherited and modified from the model for the electrical activation of dopants in silicon [53]. The modification for SiC introduces a continuous transition between the linear and the logarithmic component of the model, which enables model fitting on the entire scale of the investigated variables. The semi-empirical model is represented by an empirical time-independent formula and assumes that the activation of dopants happens instantaneously, i.e., in a fraction of time. The donor ND or acceptor concentration NA is represented as the active dopant concentration Ctot and is described as [154]
\( \seteqsection {3} \) \( \seteqnumber {28} \)
\begin{equation} C_\mathrm {act} = S_{1} C_\mathrm {tot} + S_{2} C_\mathrm {th} S_\mathrm {t} \mathrm {, where} \label {eq:semiempirical} \end{equation}
\( \seteqsection {3} \) \( \seteqnumber {29} \)
\begin{equation} \begin {split} & S_{1} = 1/2 \left ( 1+ \tanh \left (C_\mathrm {th} - C_\mathrm {tot} \right ) \right ) \mathrm {, } \\ & S_{2} = 1/2 \left ( 1+ \tanh \left (C_\mathrm {tot} - C_\mathrm {th} \right ) \right ) \mathrm {, and} \end {split} \label {eq:semiempiricalswitch} \end{equation}
\( \seteqsection {3} \) \( \seteqnumber {30} \)
\begin{equation} S_\mathrm {t} = \left ( 1 + (1-F_\mathrm {act})\ln \left (\frac {\left |C_\mathrm {tot}/C_\mathrm {th}-F_\mathrm {act}\right |}{1-F_\mathrm {act}}\right ) \right ). \label {eq:semiempiricalsaturation} \end{equation}
Ctot is the total concentration of (e.g., implanted) dopants, Cth is the dopant specific threshold concentration, Fact is the empirical scalar parameter, St is the saturation ratio, and S1 and S2 are model pre-factors.
For the total dopant concentration below the threshold concentration (Ctot < Cth) the model suggests that after annealing at a given temperature the acceptor concentration equals the total doping concentration (NA = Ctot). Note, Cth varies with annealing temperature, therefore, the regime of full dopant activation is indirectly temperature-dependent. For the total dopant concentration above the threshold concentration (Ctot > Cth) the model introduces dopant and temperature-dependent saturation effects, described by (3.30). Thus, a continuous switching between the linear and the logarithmic region of the activation response is required, which is handled via pre-factors (3.29) according to the difference between Ctot and NA. This is a key contribution of the SiC modeling approach and enables model fitting and calibration of simulation tools.
Despite the complexity of the model expression, an advantage of the model is the low number of free model parameters and its analytic nature: The computational complexity is thus significantly smaller than a first principles simulation, e.g., a molecular dynamics simulation. In an industry-focused simulation context the empirical approach is thus preferred.
3.3.2 Calibration
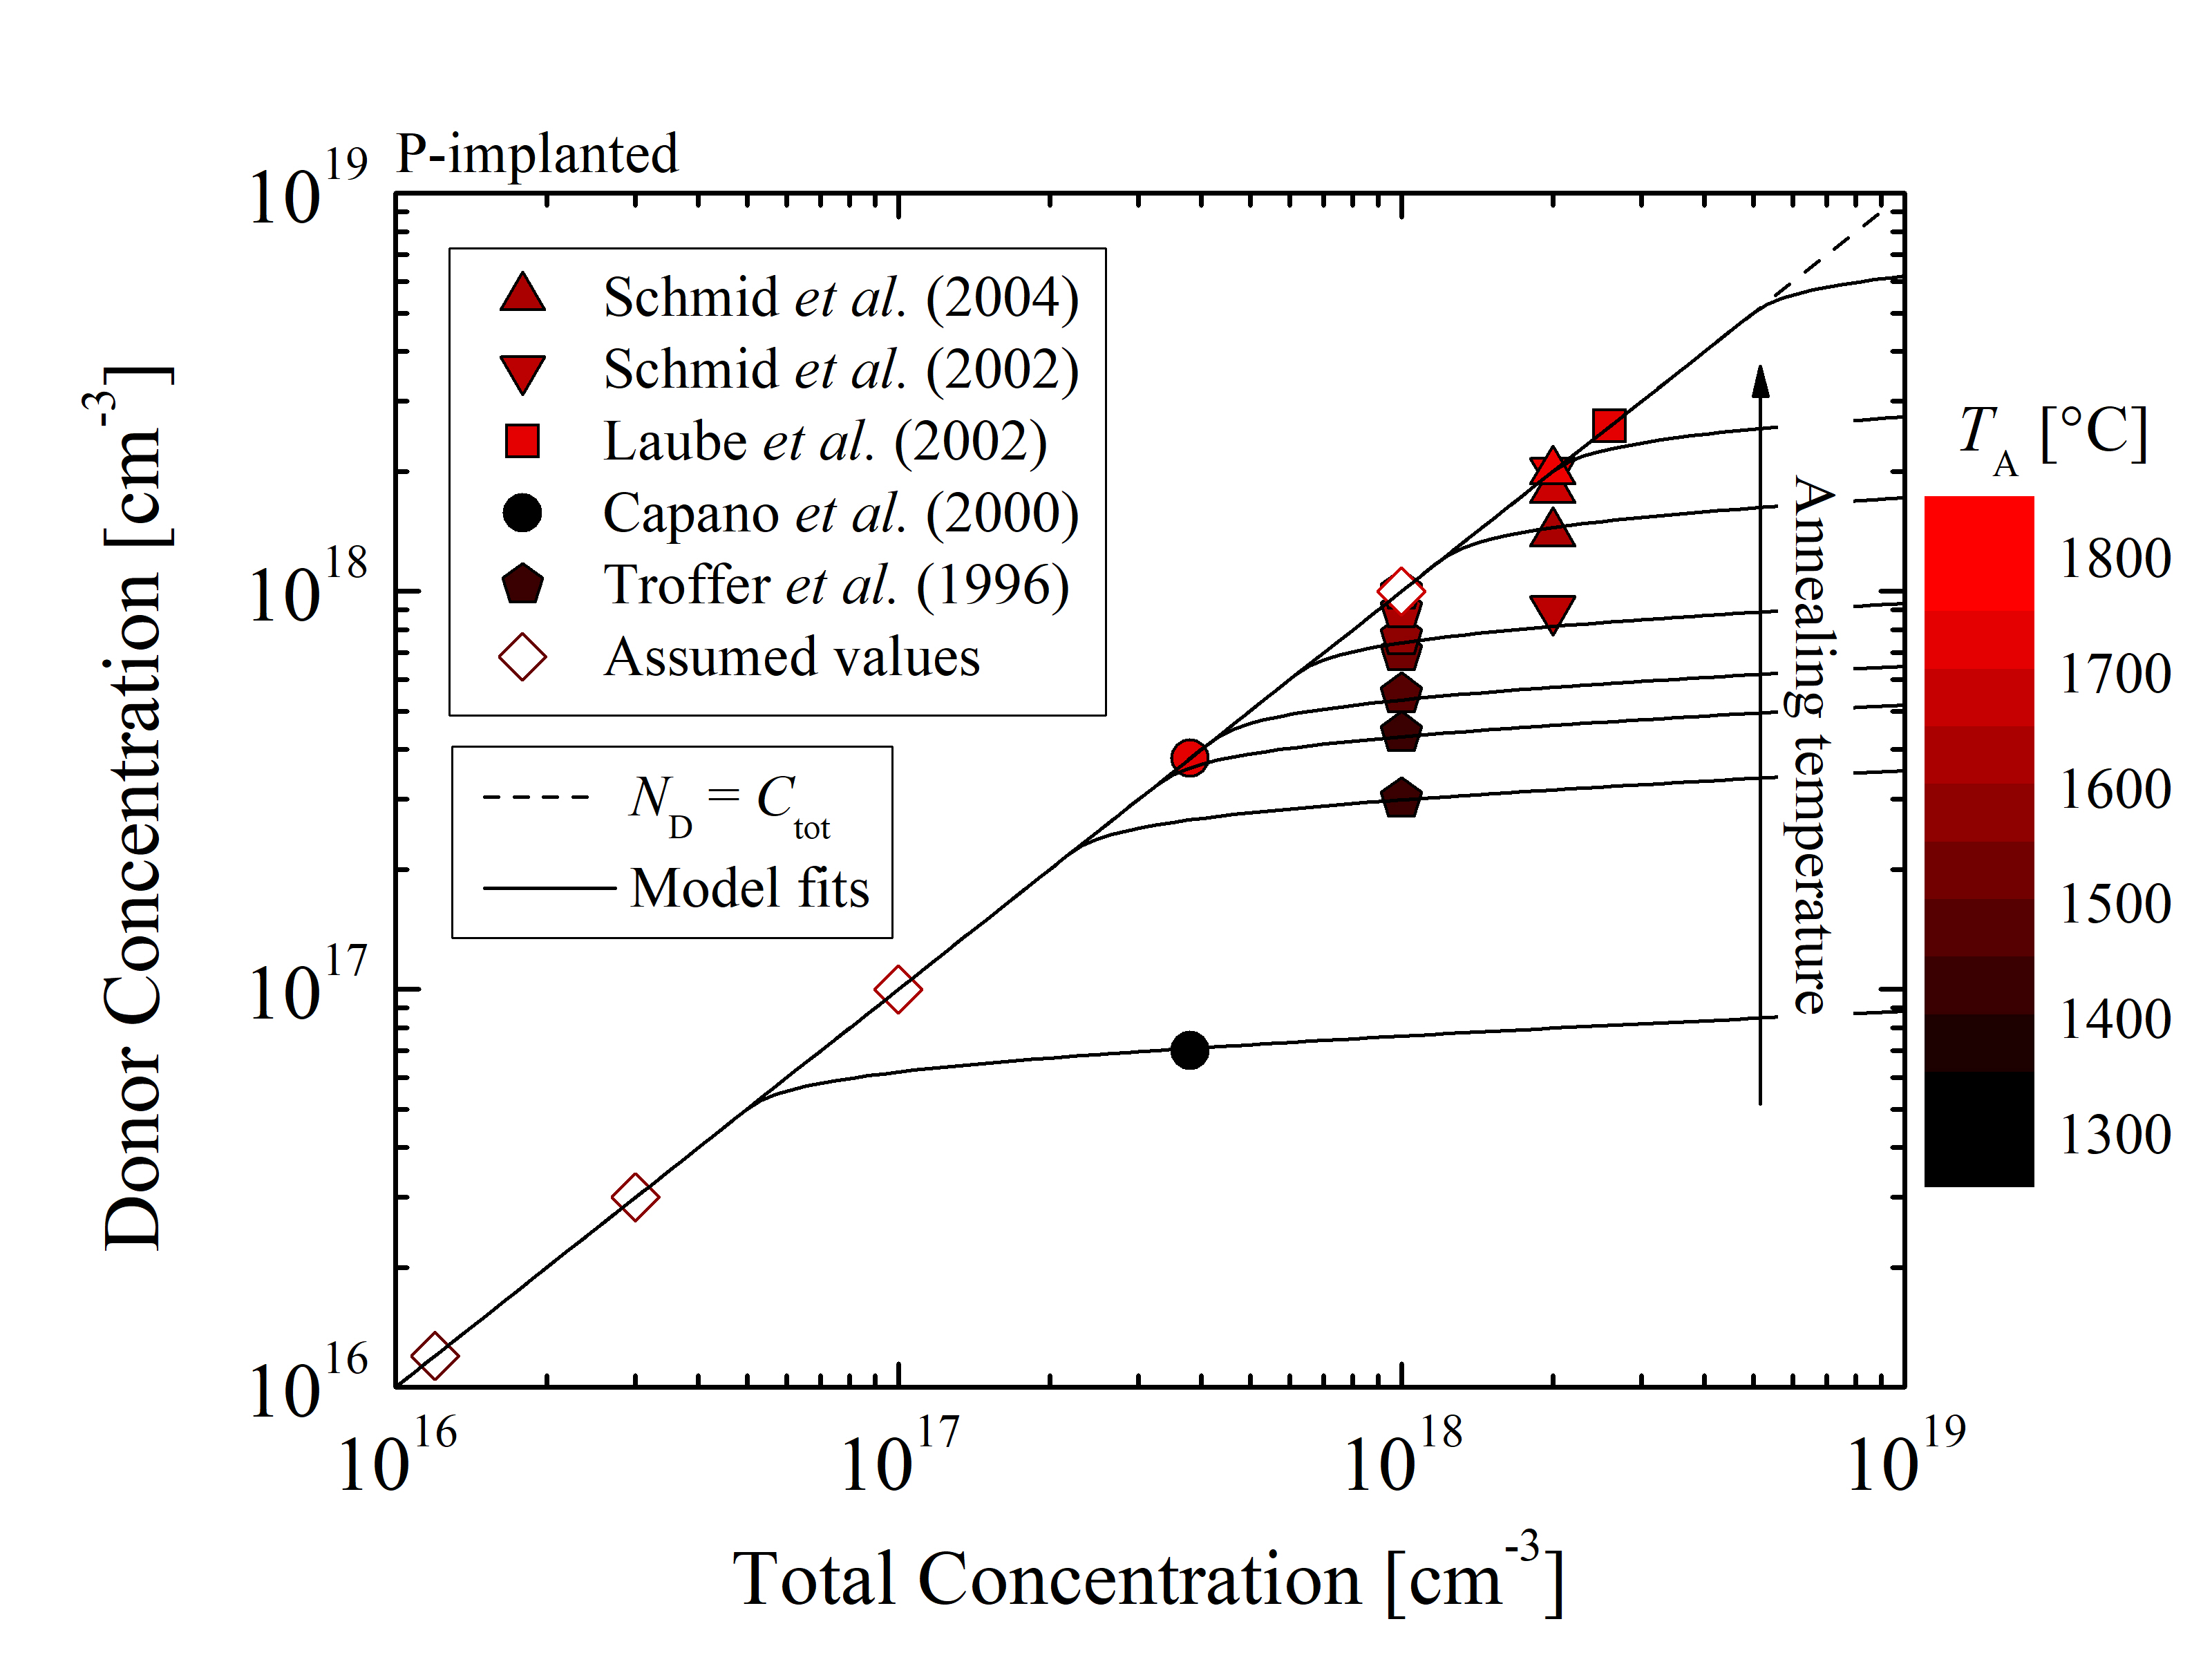
In order to calibrate the semi-empirical model a sufficient amount of sets of annealing data must be collected for various implanted concentrations and annealing temperatures [136]. These are obtained via charge neutrality fitting of the measurements [140, 137, 138, 144, 141] for P- and N-implanted (n-type) SiC and [155, 152, 134, 130, 147, 143, 144] for Al- and B-implanted (p-type) SiC. The acceptor concentrations as a function of the total implanted concentrations for various annealing temperatures are shown in Figures 3.8 and 3.9 for n- and p-type SiC, respectively.
(a)
(b)
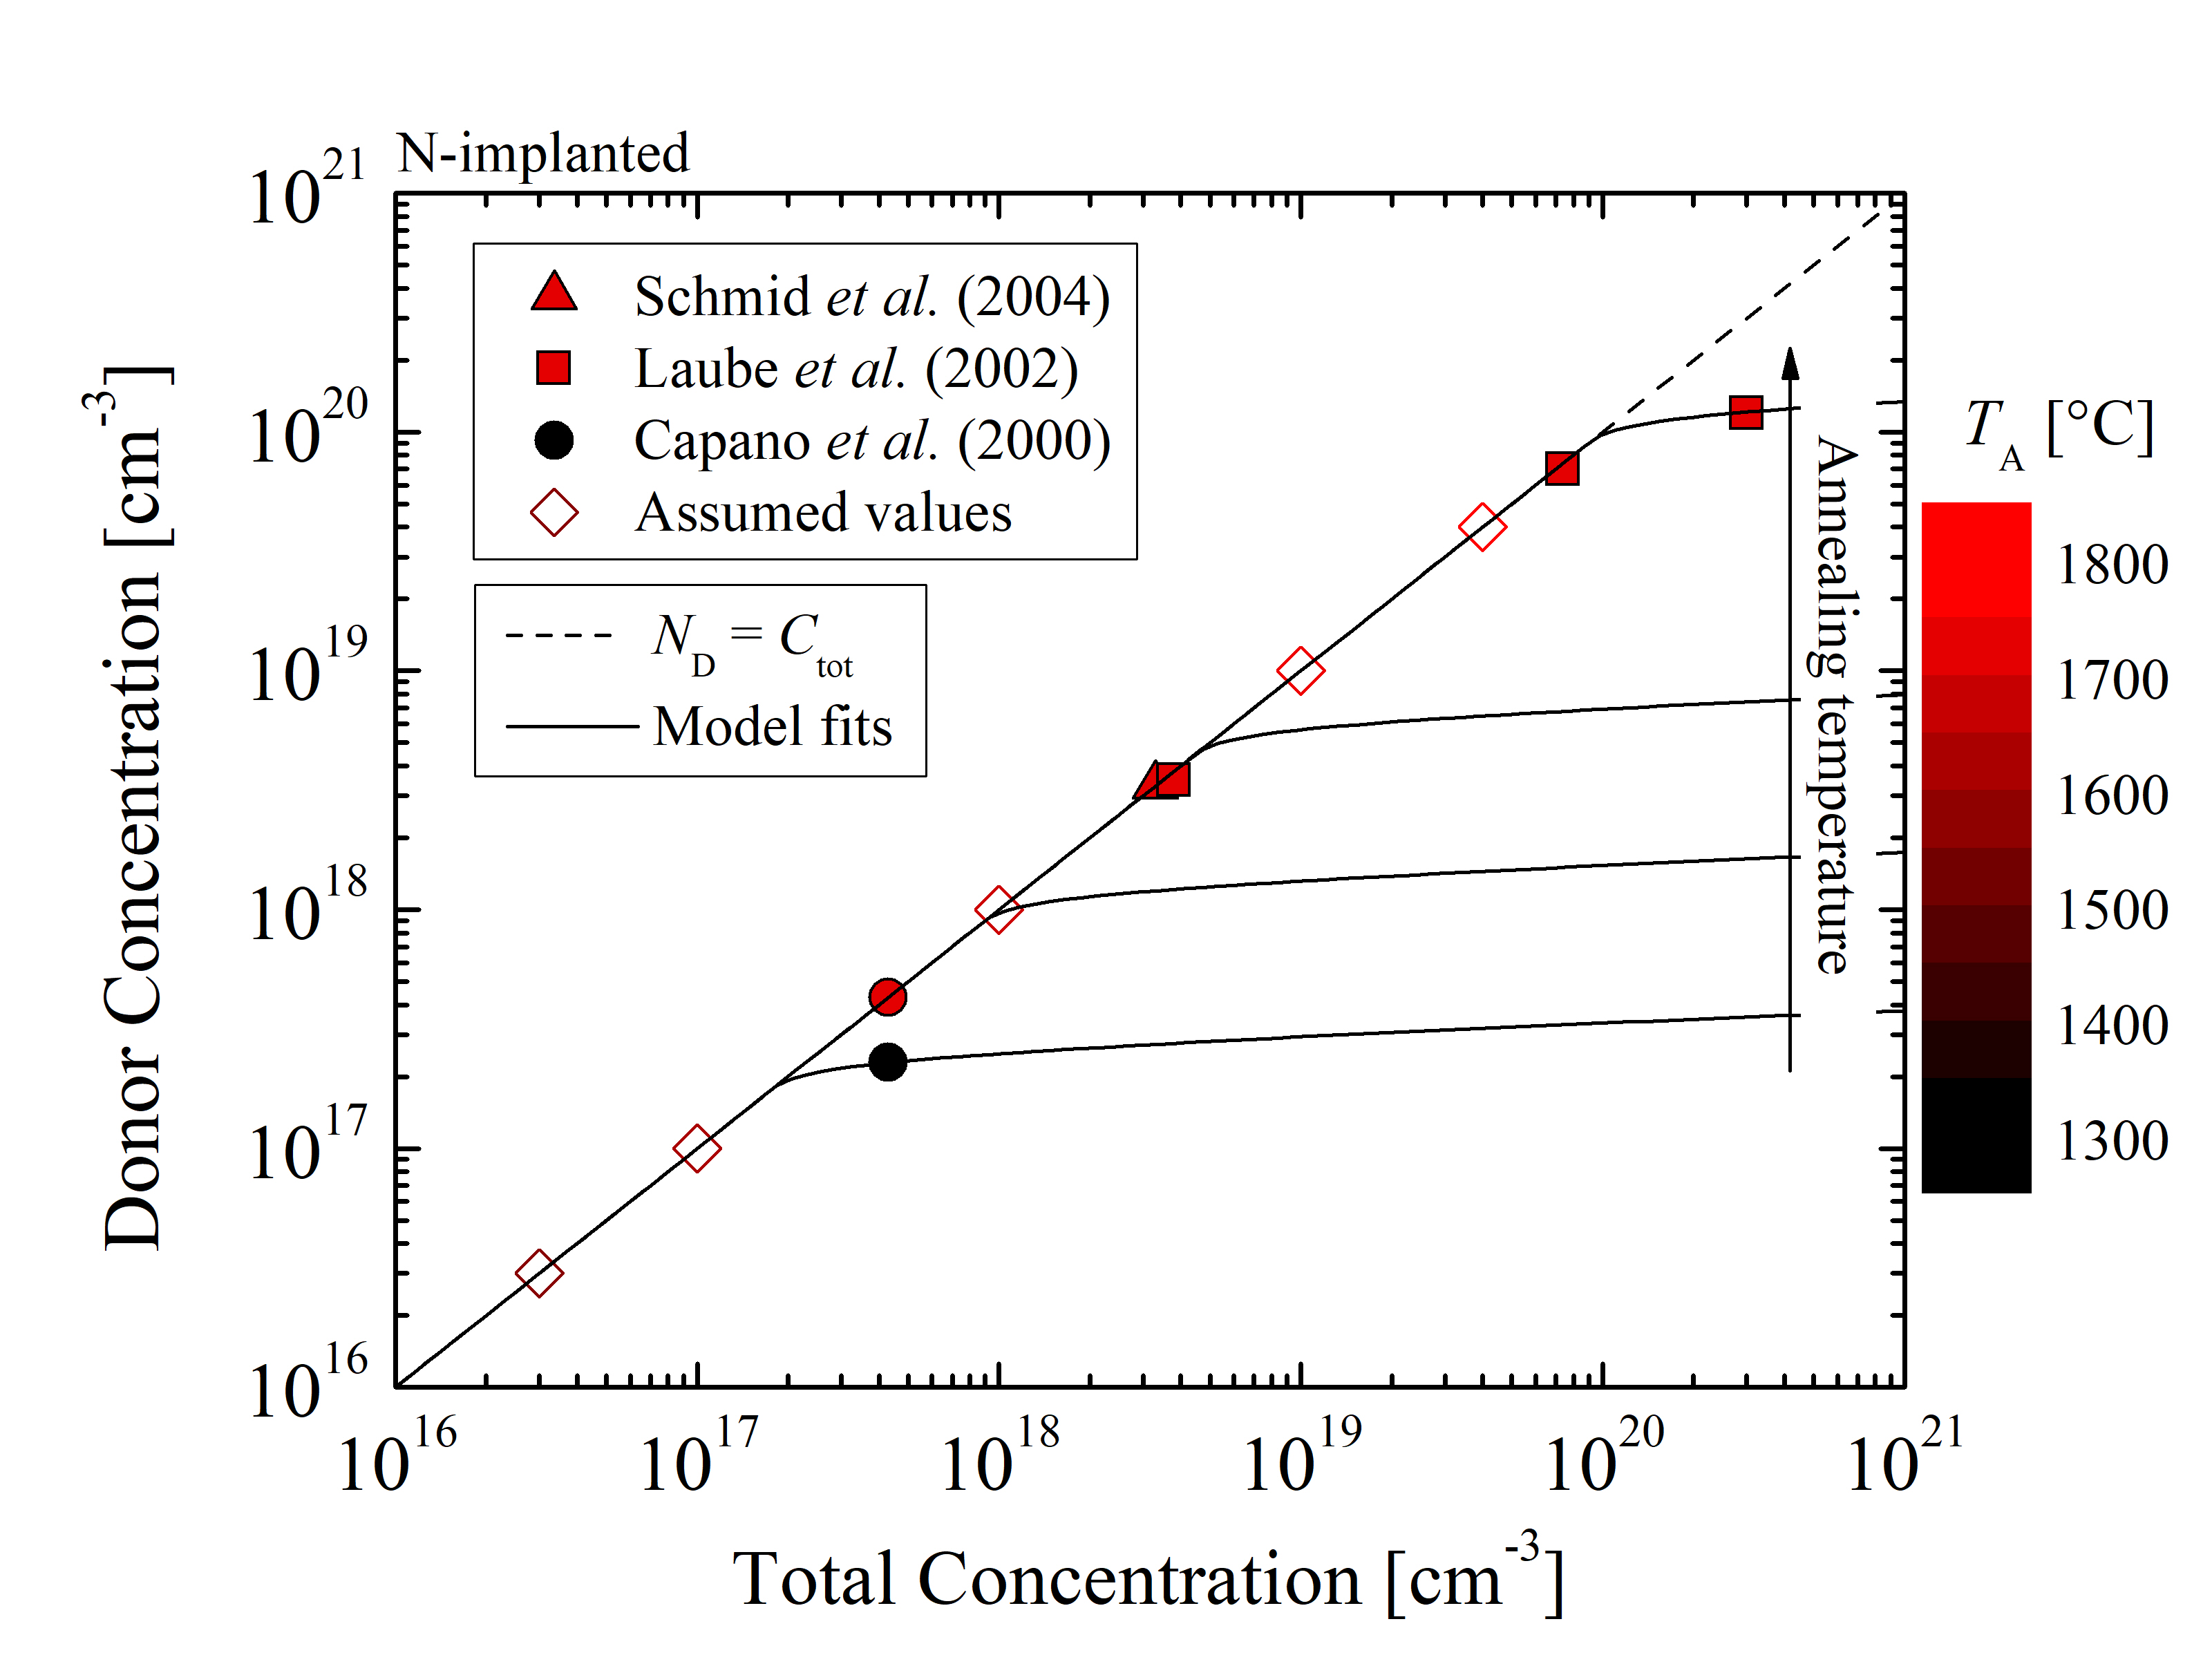
Figure 3.8: Acceptor concentrations as a function of the total doping concentration for (a) P- and (b) N-implanted SiC. The closed symbols refer to the references [140, 137, 138, 144, 141] and the open symbols refer to the assumed values, which are used to increase the accuracy of the model fitting. The solid lines are model fits and the dashed lines indicate the linear dependence of ND. The colors refer to the various annealing temperatures.
(a)
(b)
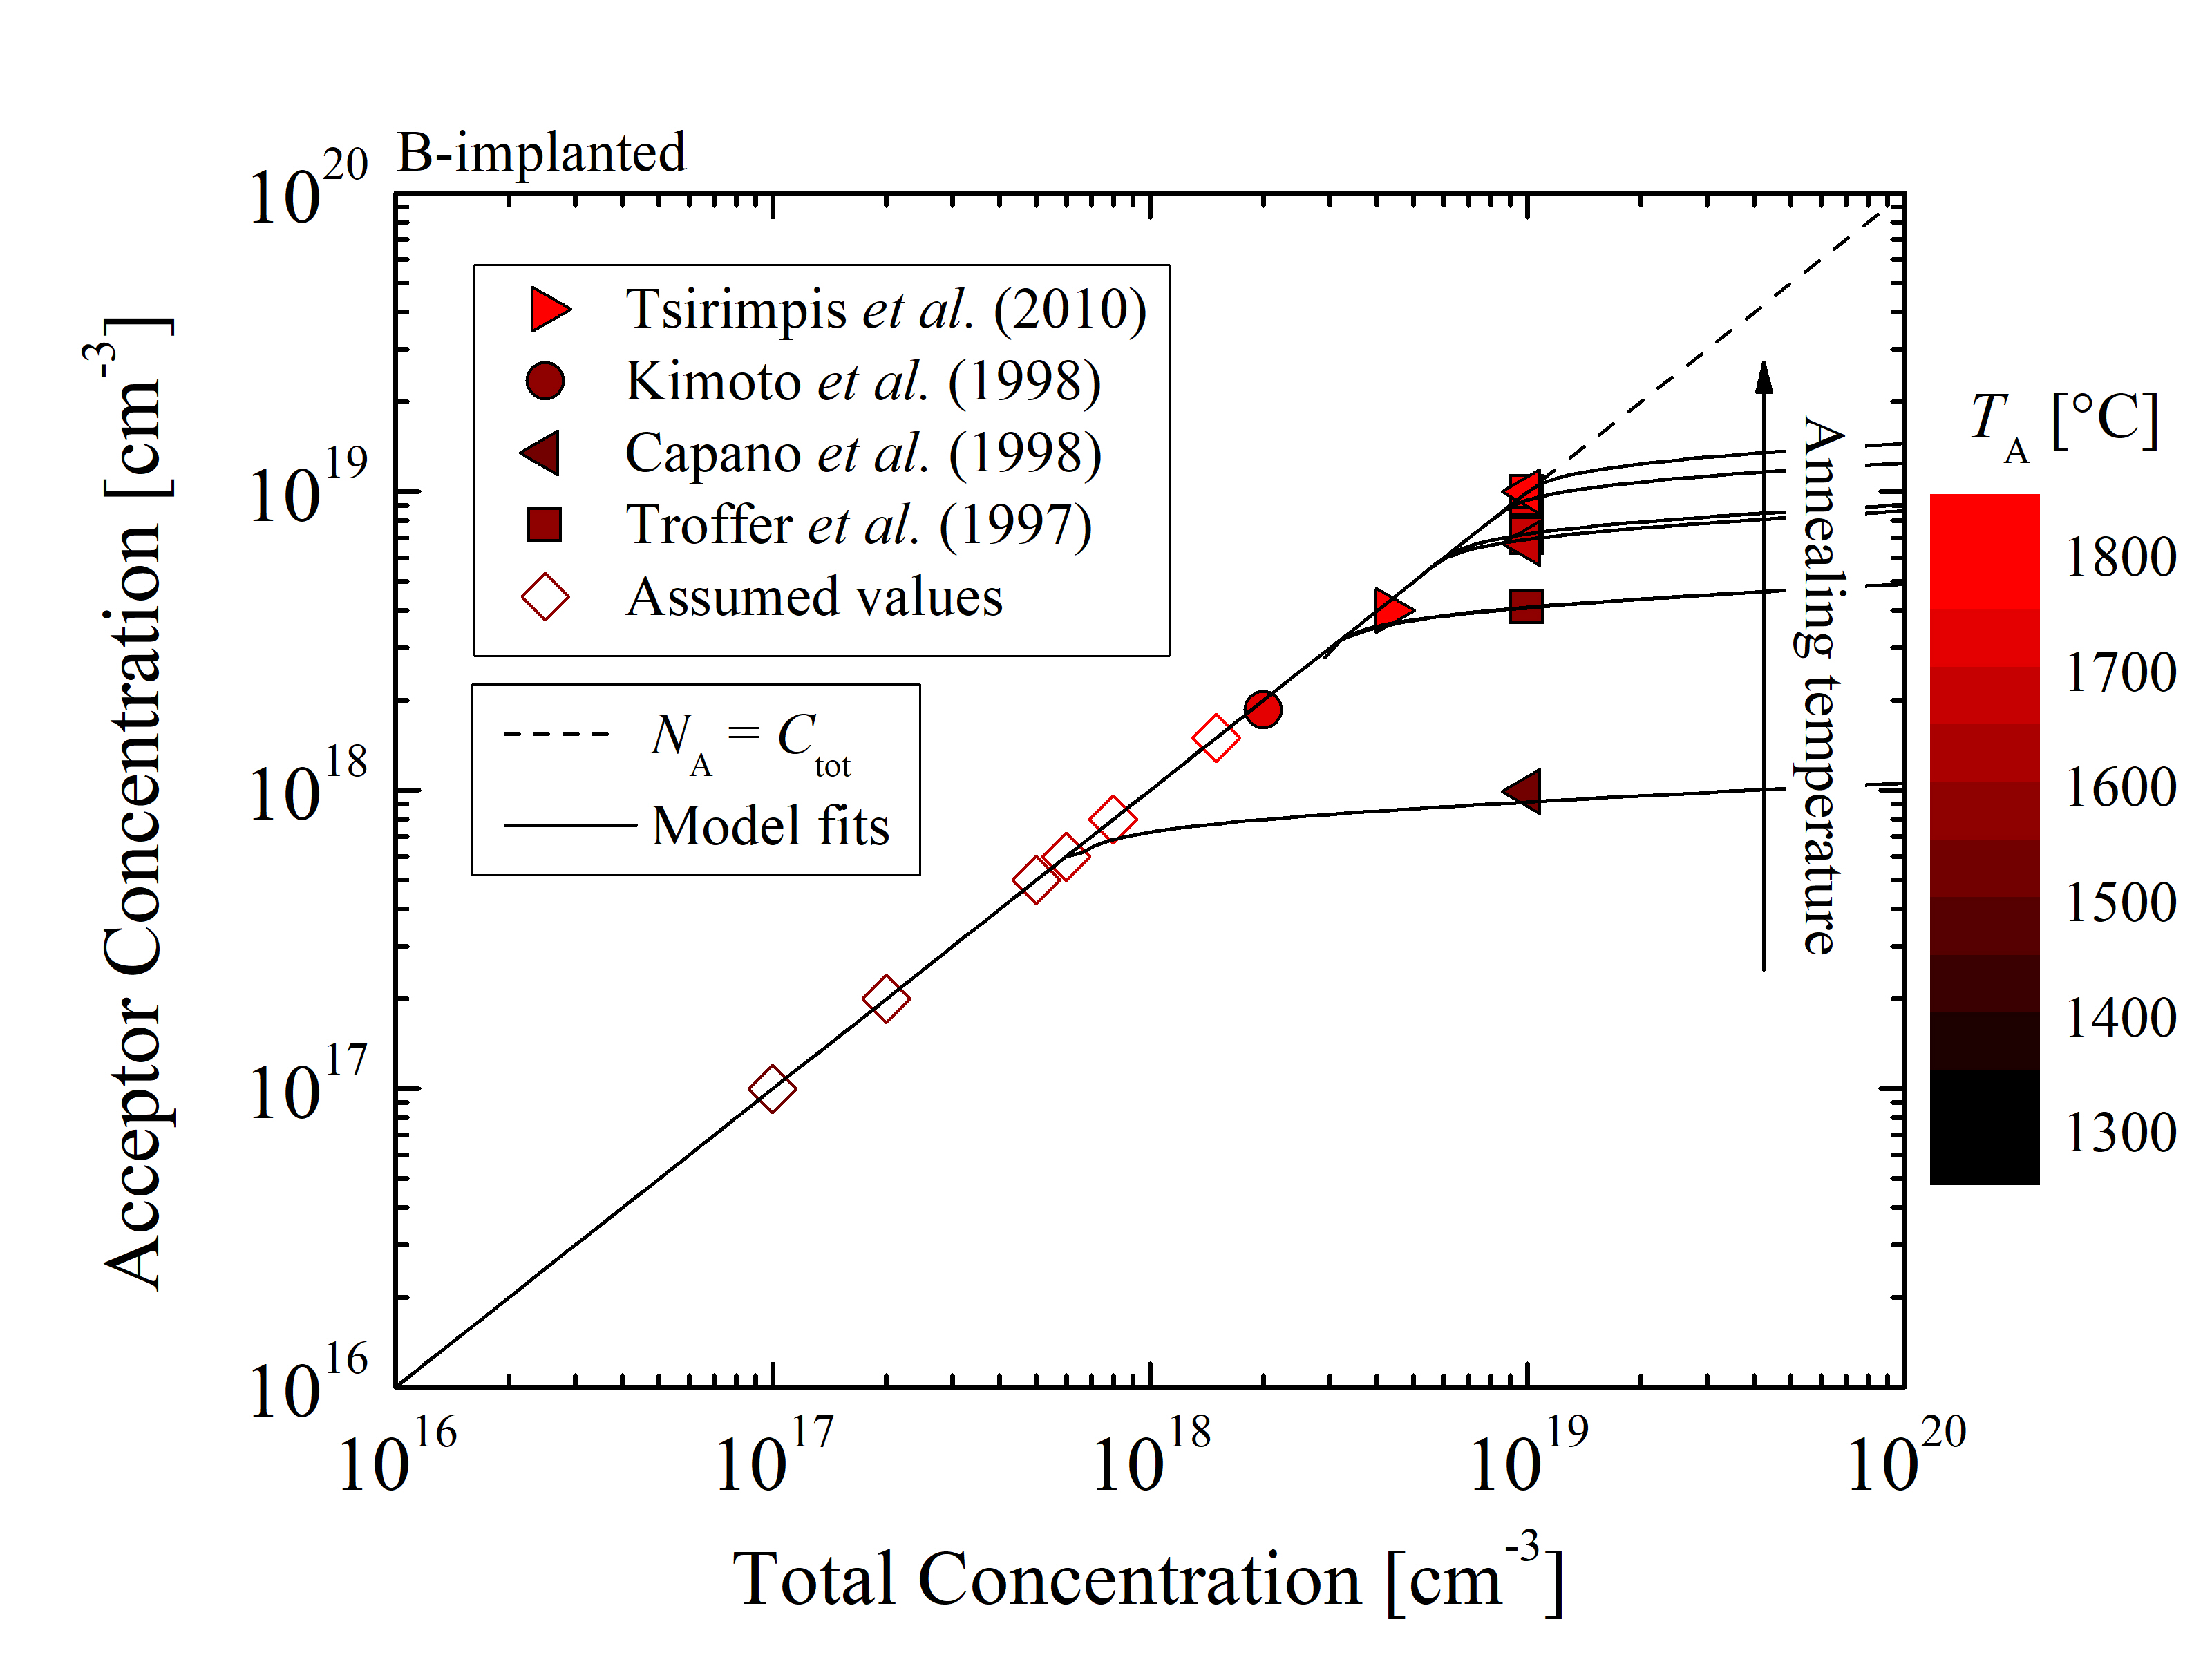
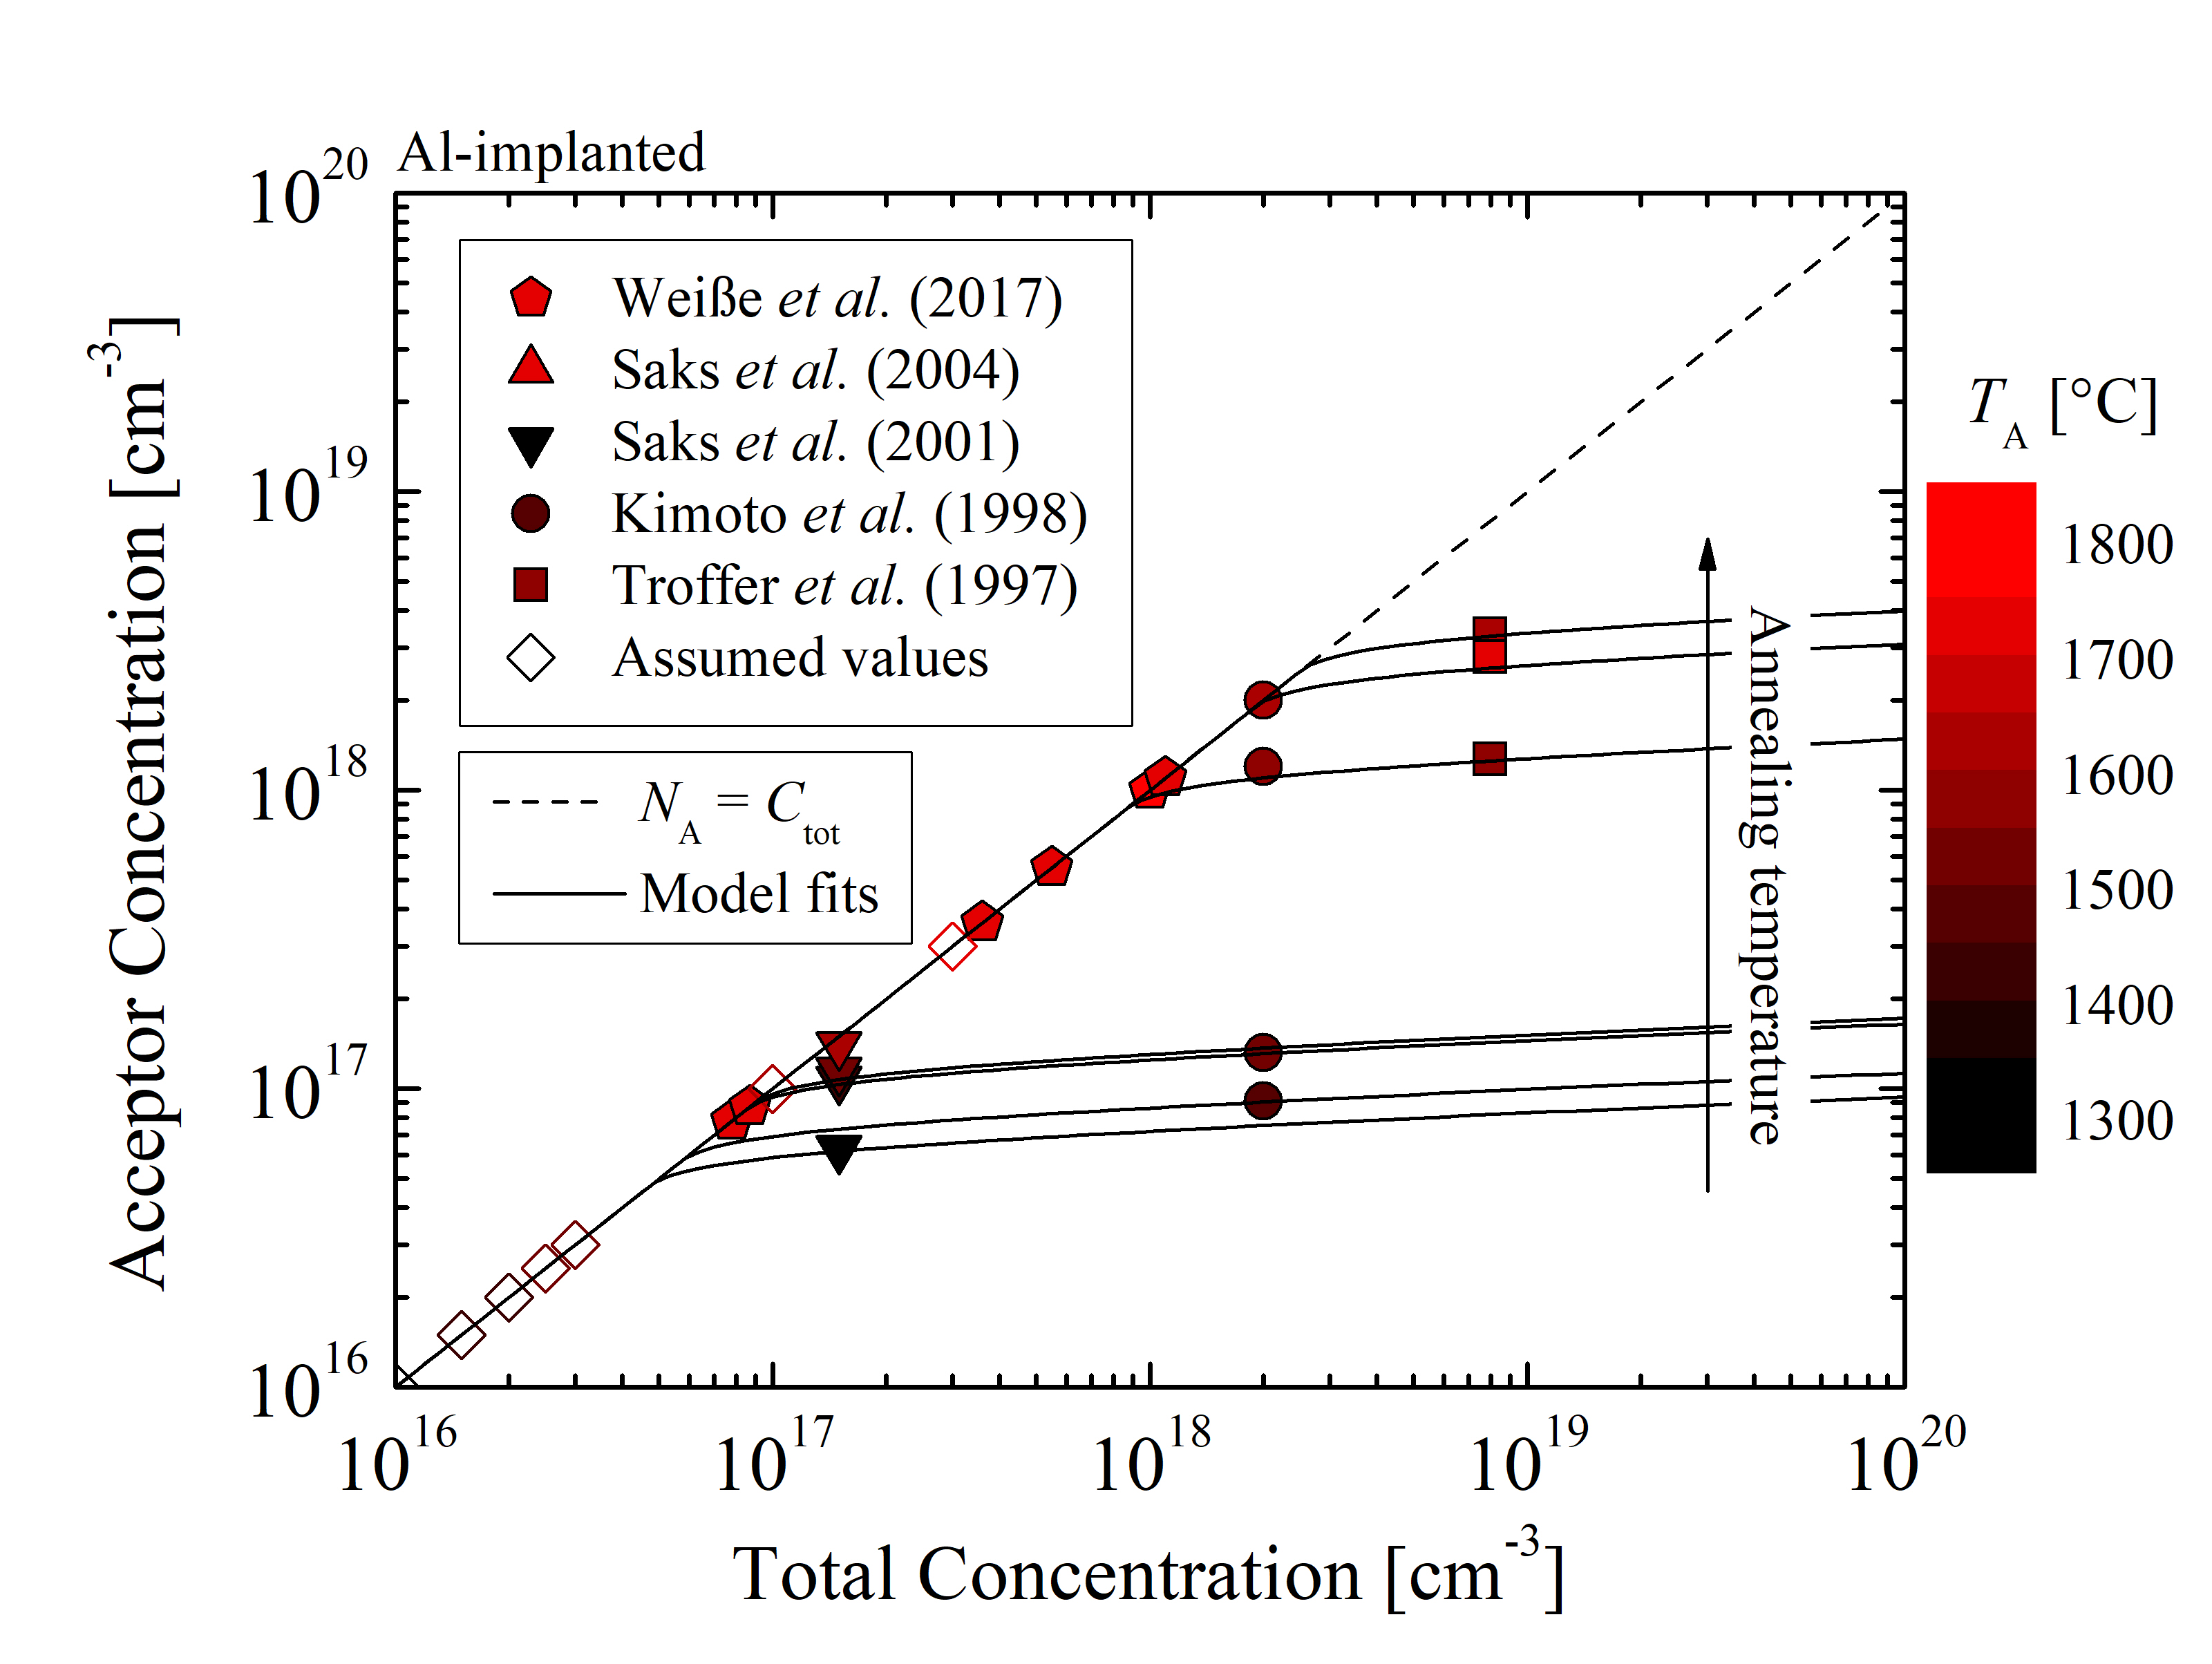
Figure 3.9: Acceptor concentrations as a function of the total doping concentration for (a) Al- and (b) B-implanted SiC. The closed symbols refer to the references [155, 152, 134, 130, 147, 143, 144] and the open symbols refer to the assumed values, which are used to increase the accuracy of the model fitting. The solid lines are model fits and the dashed lines indicate the linear dependence of NA. The colors refer to the various annealing temperatures.
Doping concentrations from 1016 cm-3 to 1021 cm-3 and annealing temperatures from 1300°C to 1900°C have been investigated. Only the data which is based on identical crystal orientations, annealing ambient, implantation temperatures, and measurement methods is considered. As already discussed, this data selection is necessary to ensure a meaningful and correct investigation of the annealing temperature and total concentration-dependent effects on the activation of impurities. The annealing steps of the collected data include microwave heating in an Ar ambient. The collection of these data sets assumes no differences in activation ratios between hexagonal structures of SiC, i.e., 4H- and 6H-SiC. The error due to this assumption is in average very small, i.e., < 5% [134] and can thus be neglected. In addition, the fitted data must only include the activation state of impurities at the thermodynamic equilibrium, which is a fundamental requirement of the model. Overall, these important criteria limit the amount of relevant data, but in turn ensure a proper frame of reference for the semi-empirical model.
An iterative fitting method, evaluated by least squares error, is used to accurately fit the model (3.28-3.30) to the pre-processed data of the acceptor concentrations as a function of the total doping concentration. In order to minimize the numerical fitting error due to the low amount of relevant data, 100% activation is assumed for samples with low implanted concentration, which are annealed at high temperatures relative to the implanted dose. The model parameter Cth for P-, N-, Al-, and B-implanted SiC is obtained with respect to the various annealing temperatures. It has been empirically determined that the best fits are accomplished for Fact ≈ 0.9. Therefore, the empirical scalar parameter is, particularly for SiC, fixed to 0.9 for all cases.
The temperature-dependent parameter Cth introduces the dopant concentration limit where saturation effects start to manifest. The activation ratio is significantly reduced (i.e., saturates) above the threshold for a particular annealing temperature. The threshold concentrations for the p- and n-type implantation, obtained by model fitting, is shown in Figures 3.10 and 3.11, respectively.
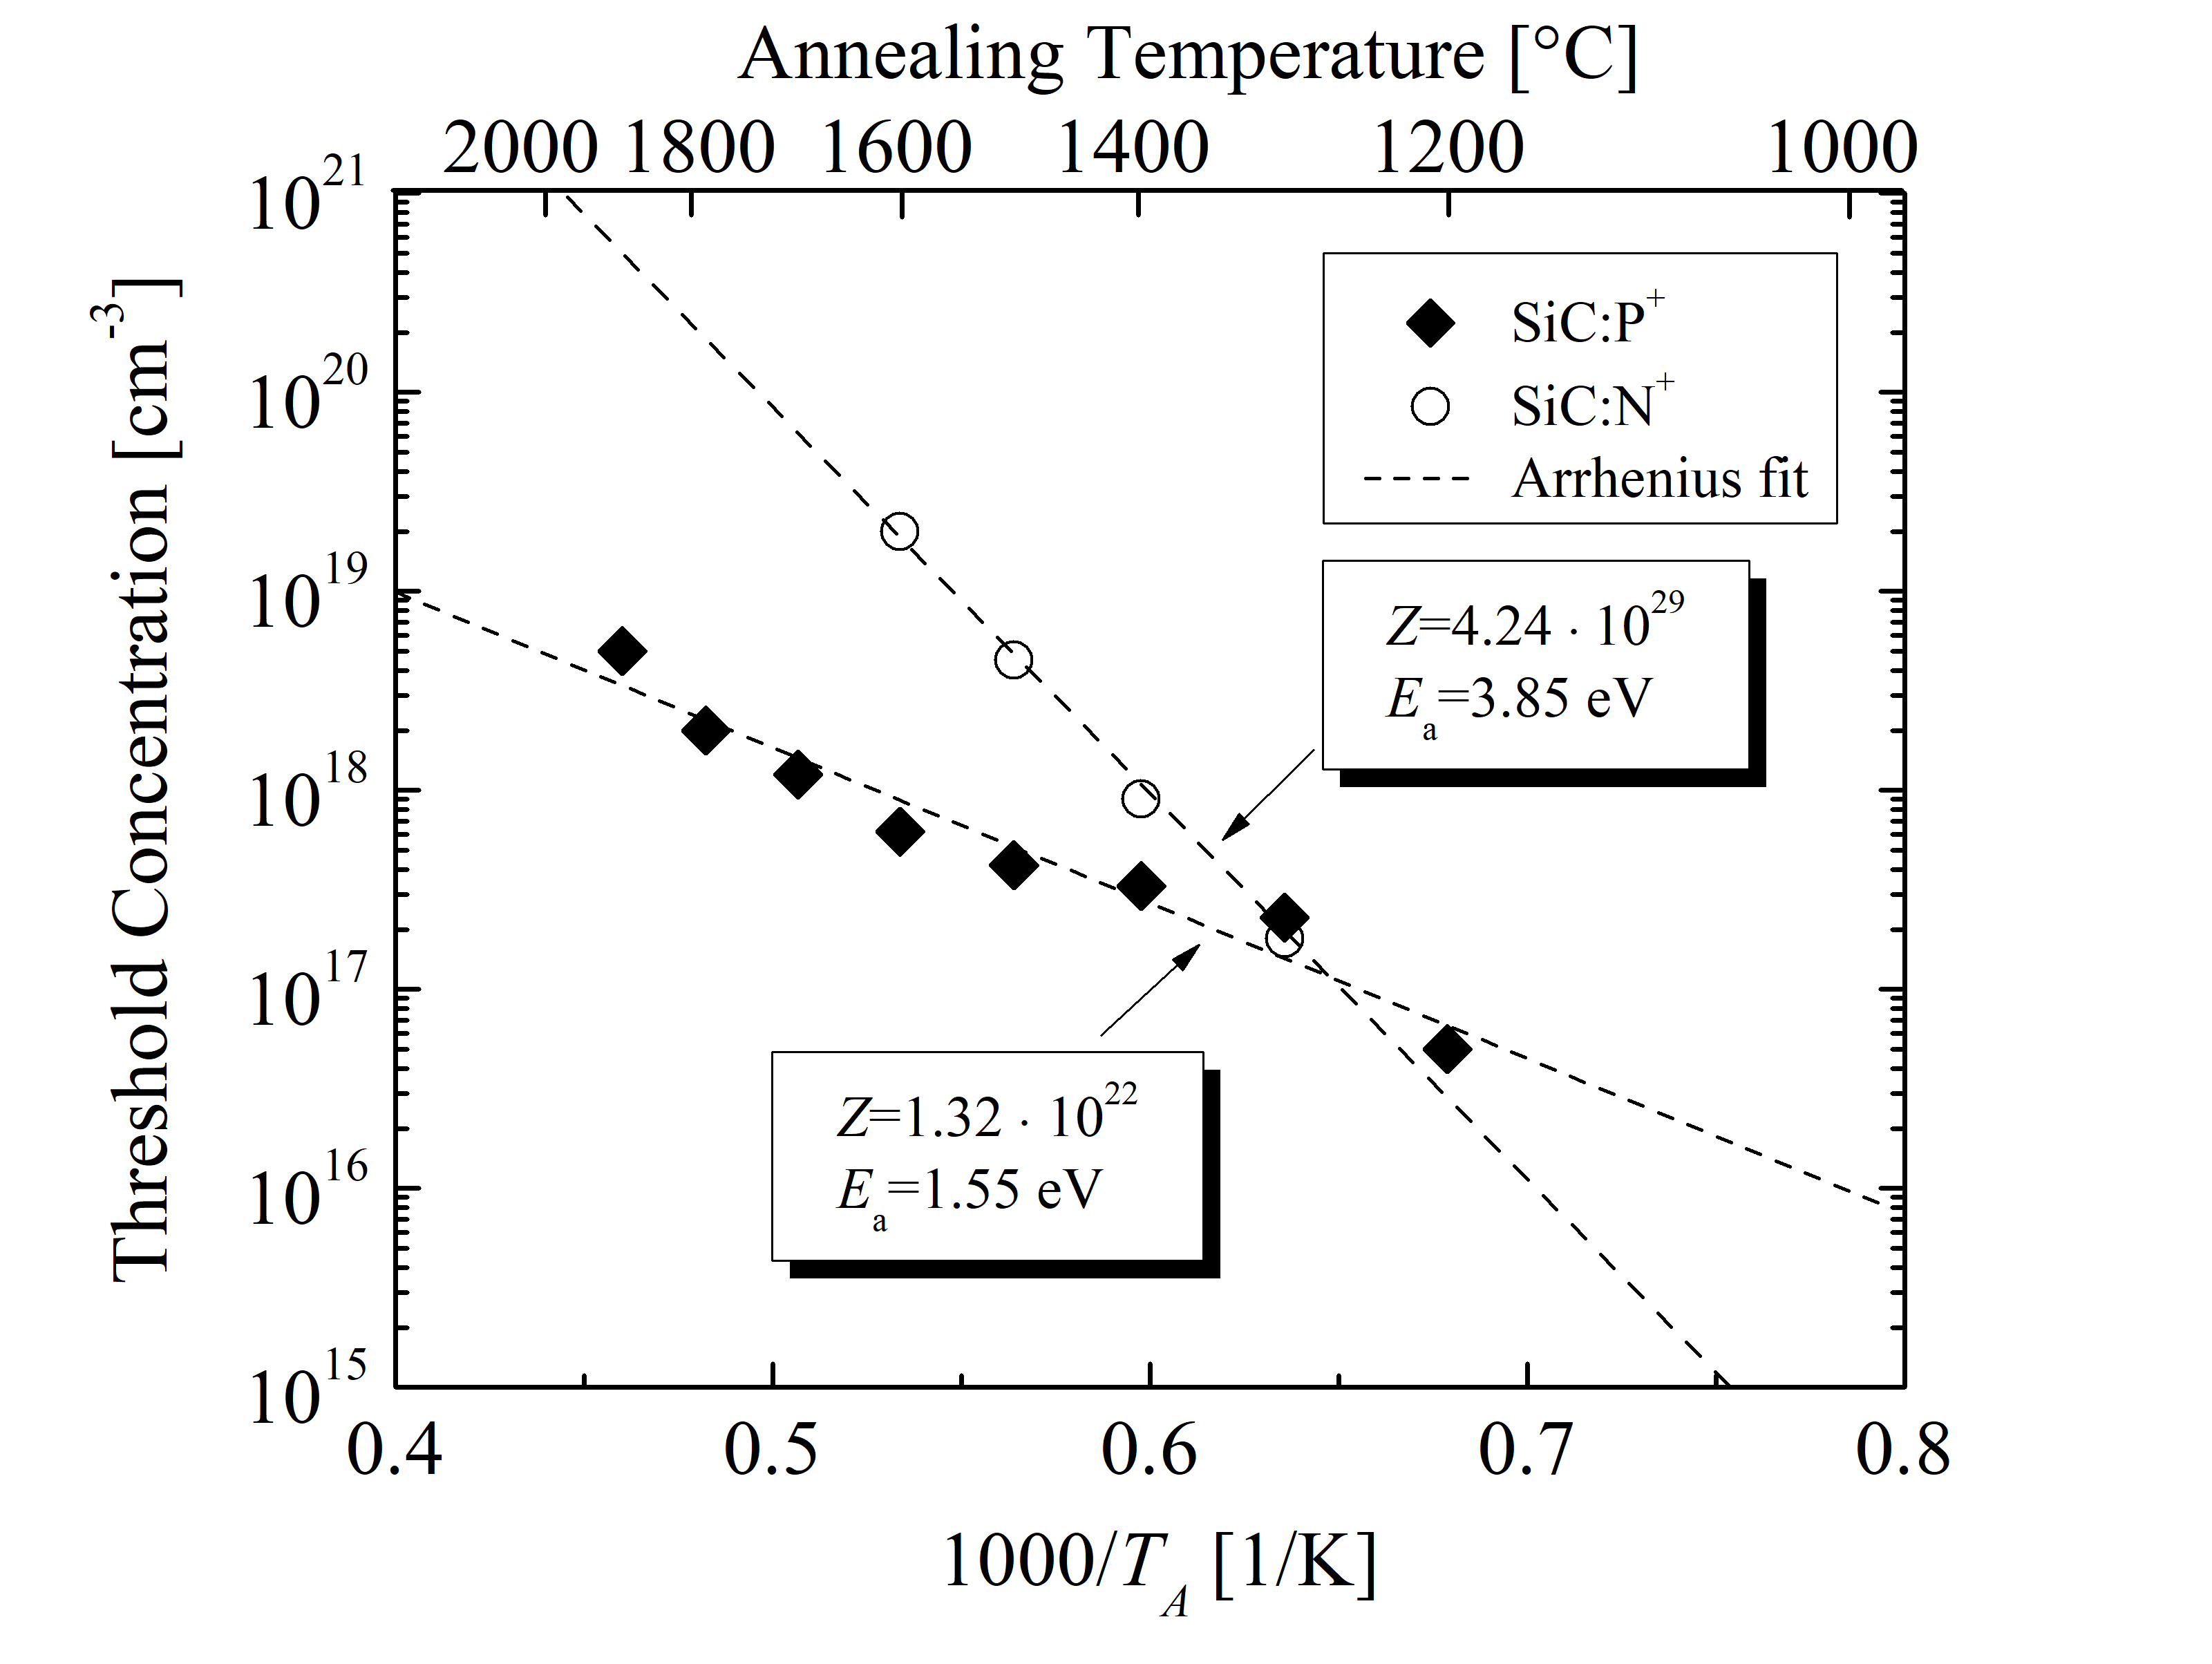
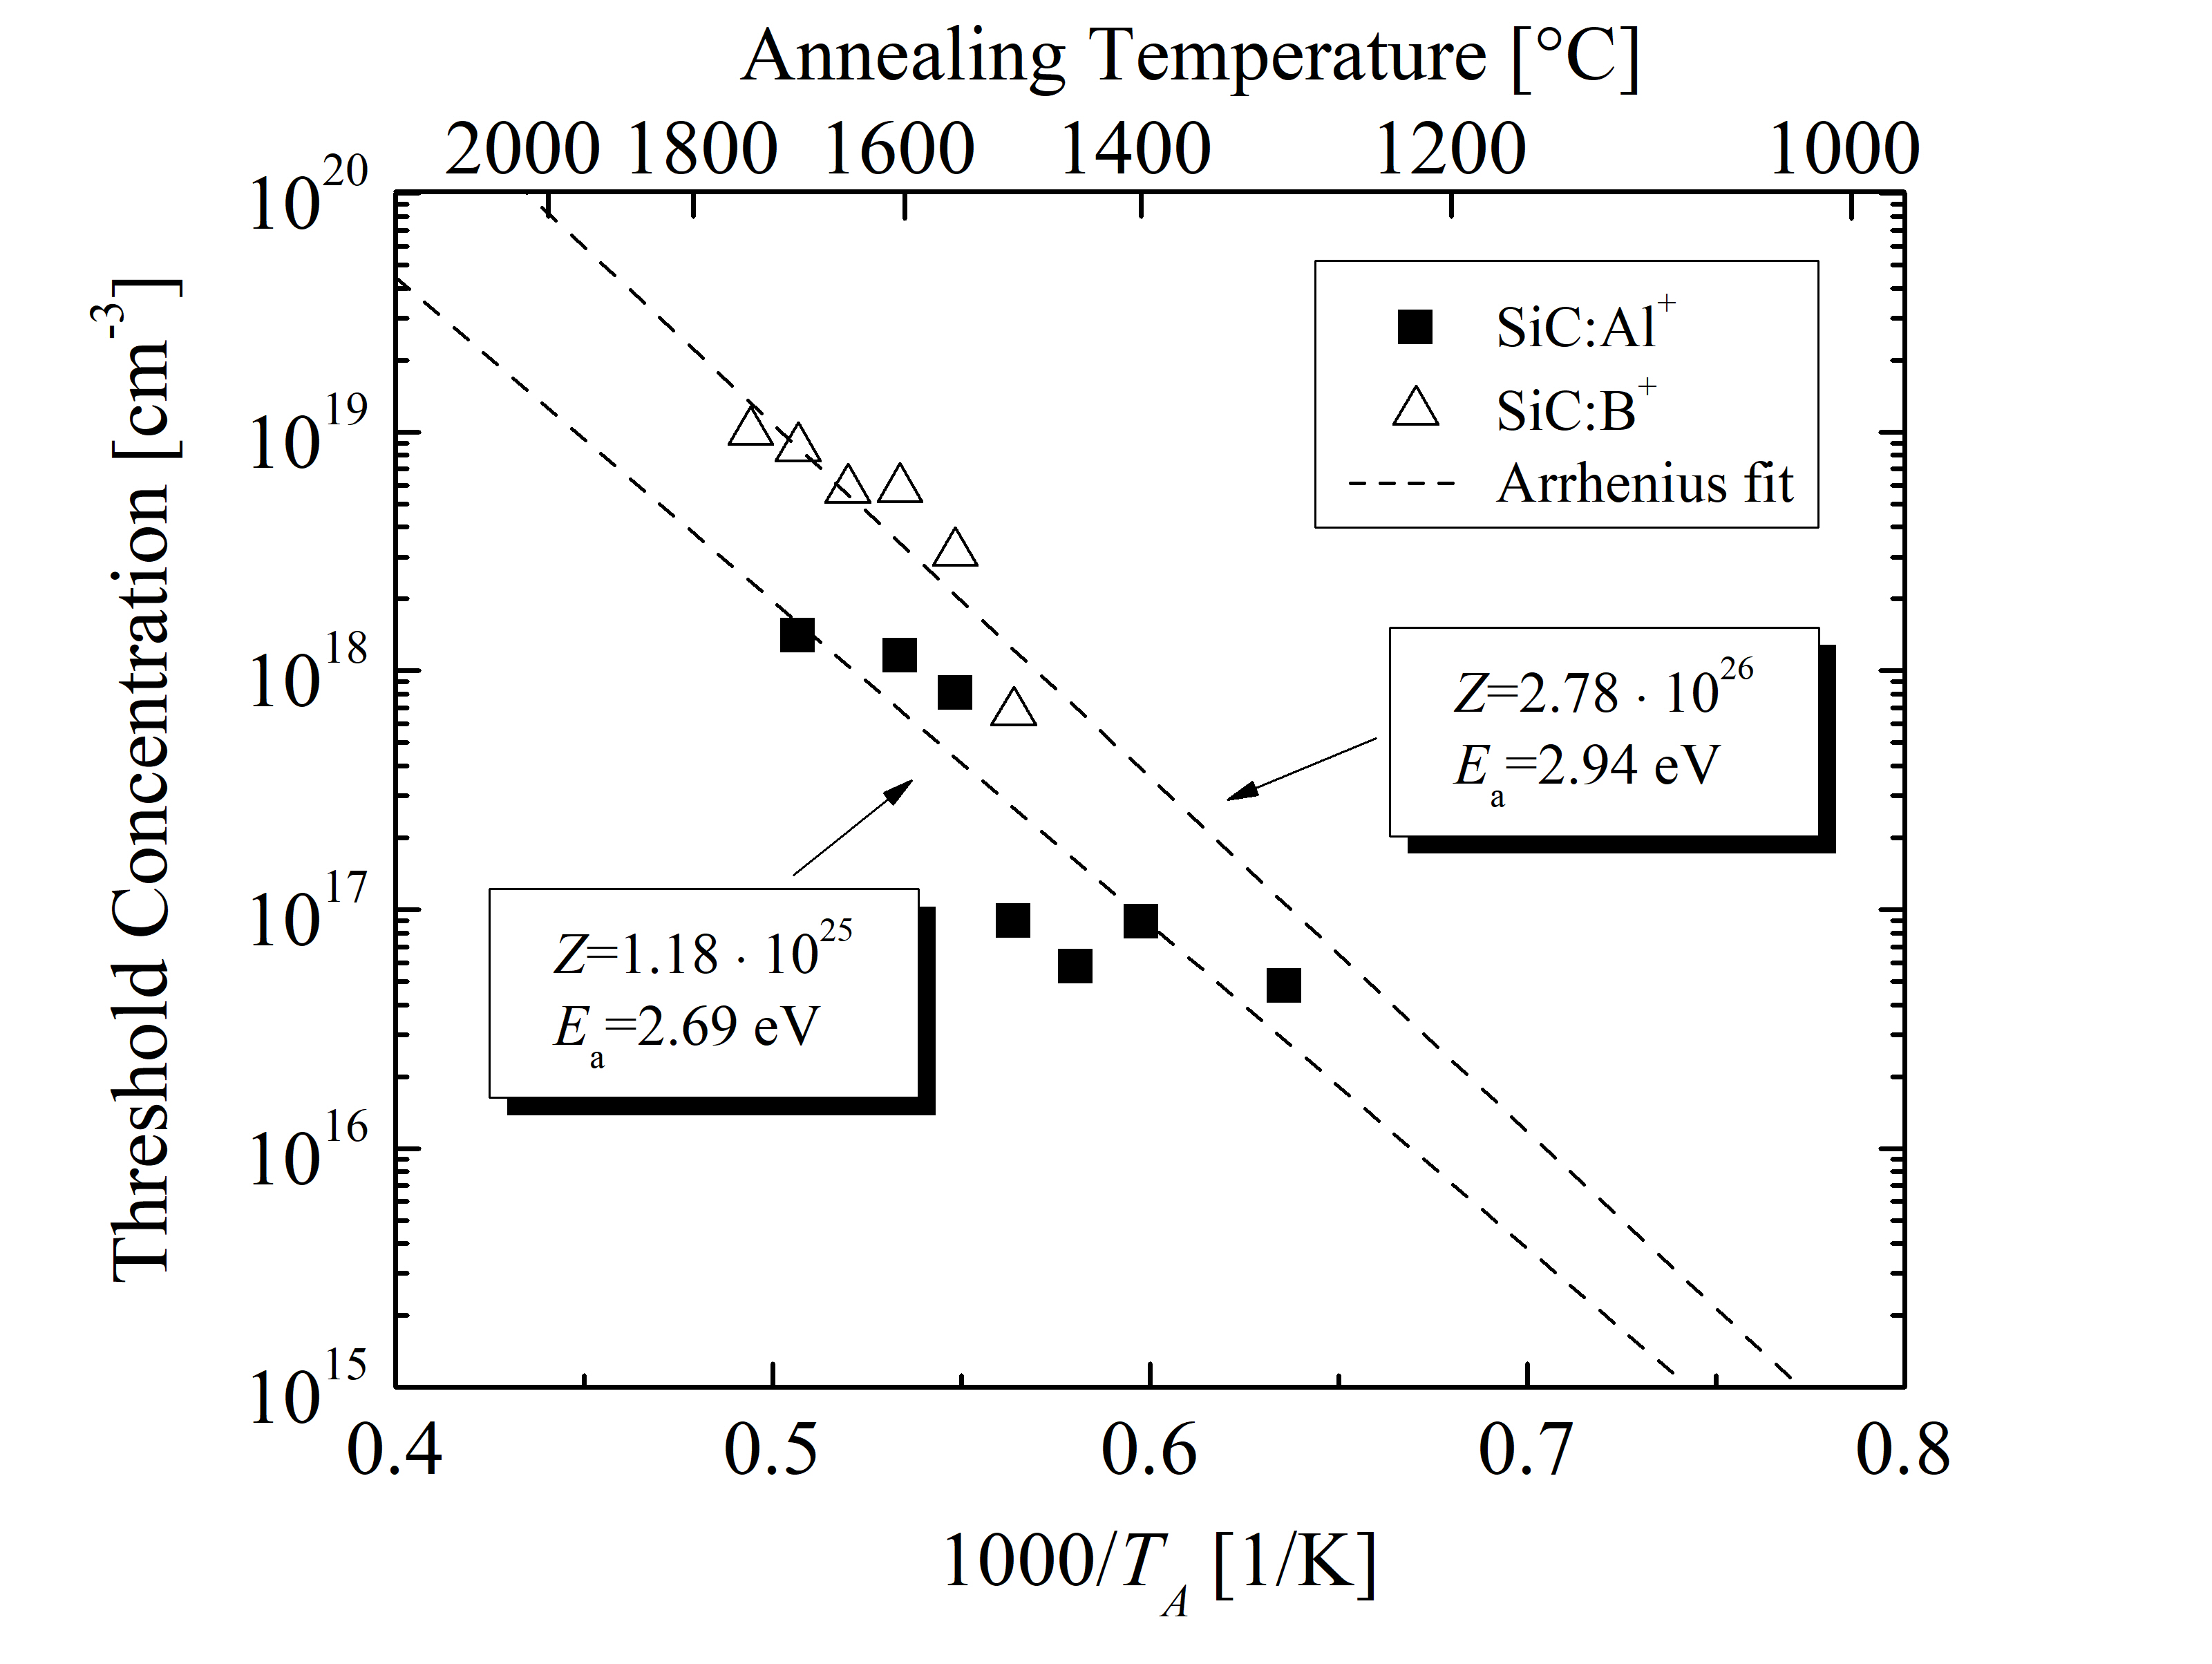
An Arrhenius function is used in order to introduce a continuous temperature dependence of the model parameter. The best fit is achieved with an activation energy Ea = 1.55 eV and a pre-exponential factor Z = 1.32 · 1022 cm-3 for P, Ea = 3.85 eV and Z = 4.24 · 1029 cm-3 for N, Ea = 2.69 eV and Z = 1.18 · 1025 cm-3 for Al, and Ea = 2.94 eV and Z = 2.78 · 1026 cm-3 for B dopants. The Arrhenius parameters of the threshold concentrations for each of the SiC dopants are summarized in Table 3.4.
N donors have by far the highest activation energies of Cth, followed by B and Al acceptors, and finally P donors. Comparing the two donor-type dopants, Cth of N is higher above and lower below 1290°C. This indicates that N dopants achieve 100% activation for higher total concentrations than P dopants at high annealing temperatures. Comparing the two acceptor-type dopants, the threshold of B-implanted SiC becomes significantly larger at high annealing temperatures than the threshold of Al-implanted SiC. This effect is associated with the atomic mass of the dopants, i.e., B ions are lighter than Al ions [143], see Table 3.1.
Table 3.4: Arrhenius parameters of threshold concentration (Cth) for P-, N-, Al-, and B-implanted SiC.
| Dopant | Z [cm-3] | Ea [eV] |
| P | 1.32 · 1022 | 1.55 |
| N | 4.24 · 1029 | 3.85 |
| Al | 1.18 · 1025 | 2.69 |
| B | 2.78 · 1026 | 2.94 |
3.3.3 Characterization
In order to characterize the model’s predictive character and analyze results thoroughly, parameter studies were performed, which are based on > 106 individual simulations to cover a wide range of parameter variations. Each of the simulations must satisfy thermal equilibrium criteria. In the case of the semi-empirical model, the activation is assumed to be instant, therefore, the resulting values correspond to the values in the thermal equilibrium.
The results are collected in phase diagrams, which show the conditions, such as temperature and concentration, at which thermodynamically distinct phases occur and coexist at thermal equilibrium: Results of ion implantation followed by various thermal annealing steps for P- and N-implanted SiC are shown in Figure 3.12 and for Al- and B-implanted SiC in Figure 3.13. The phase diagrams suggest activation regions of the dopants for various doping concentrations and annealing temperatures.
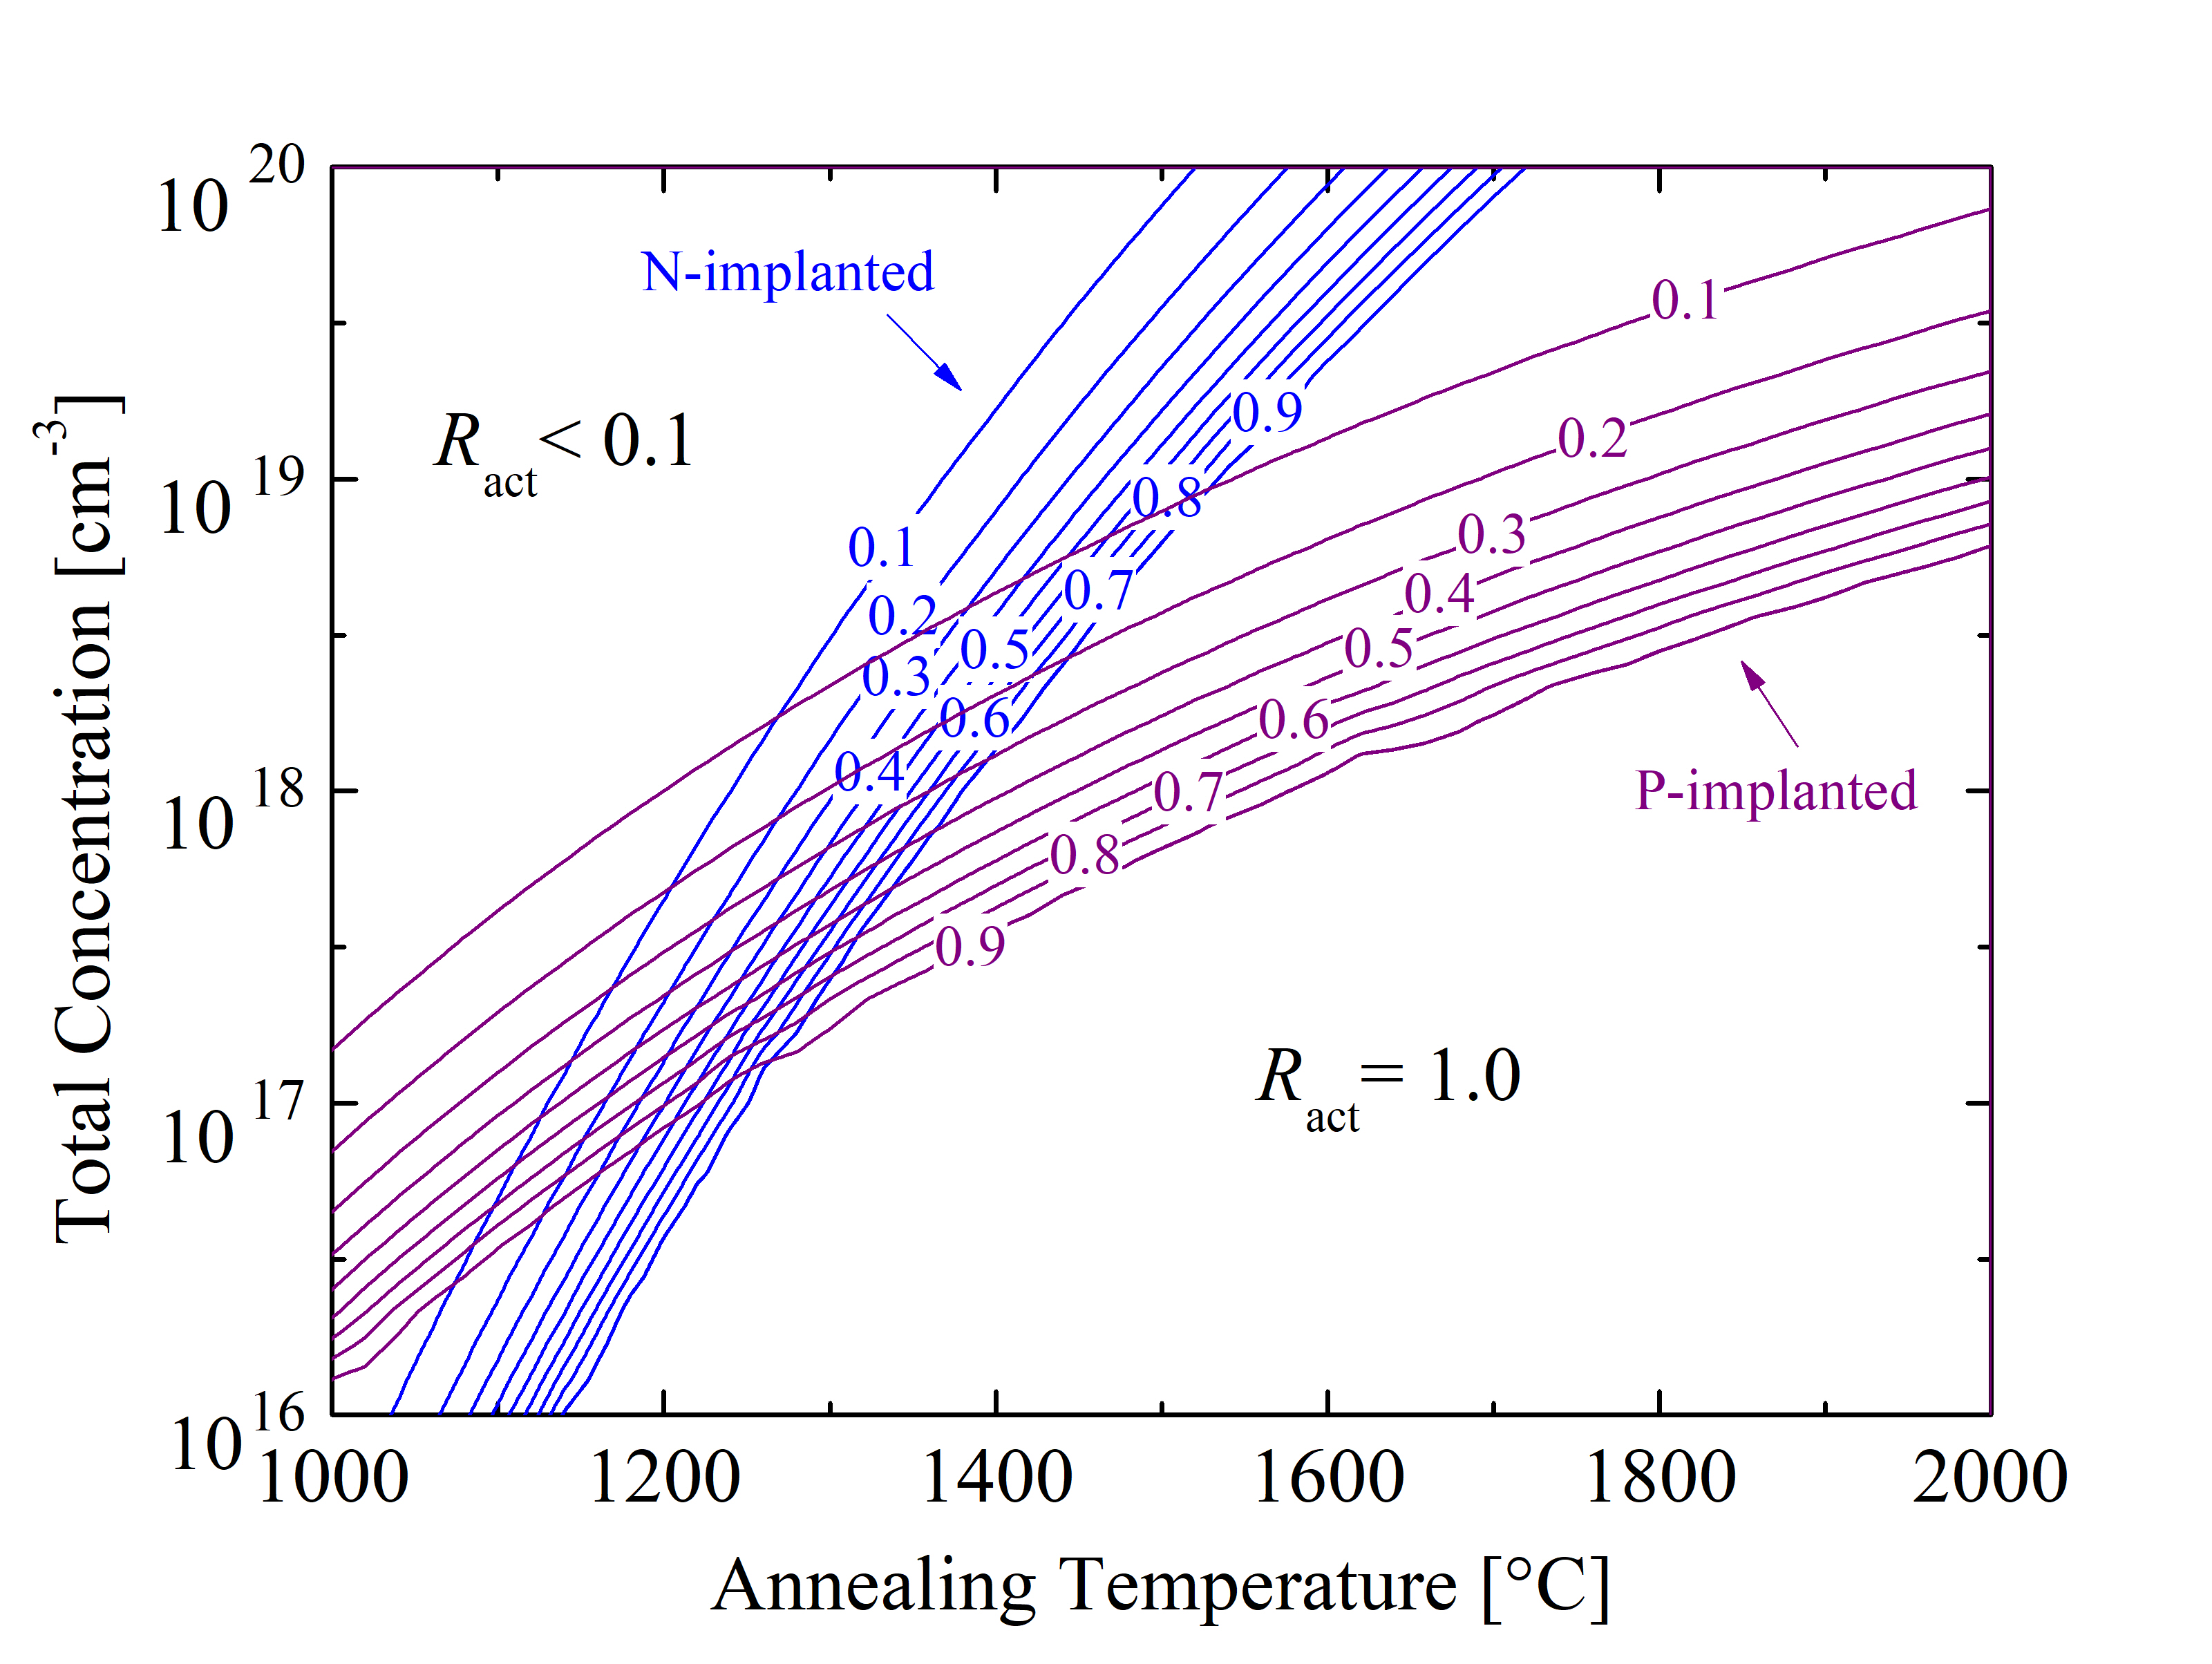
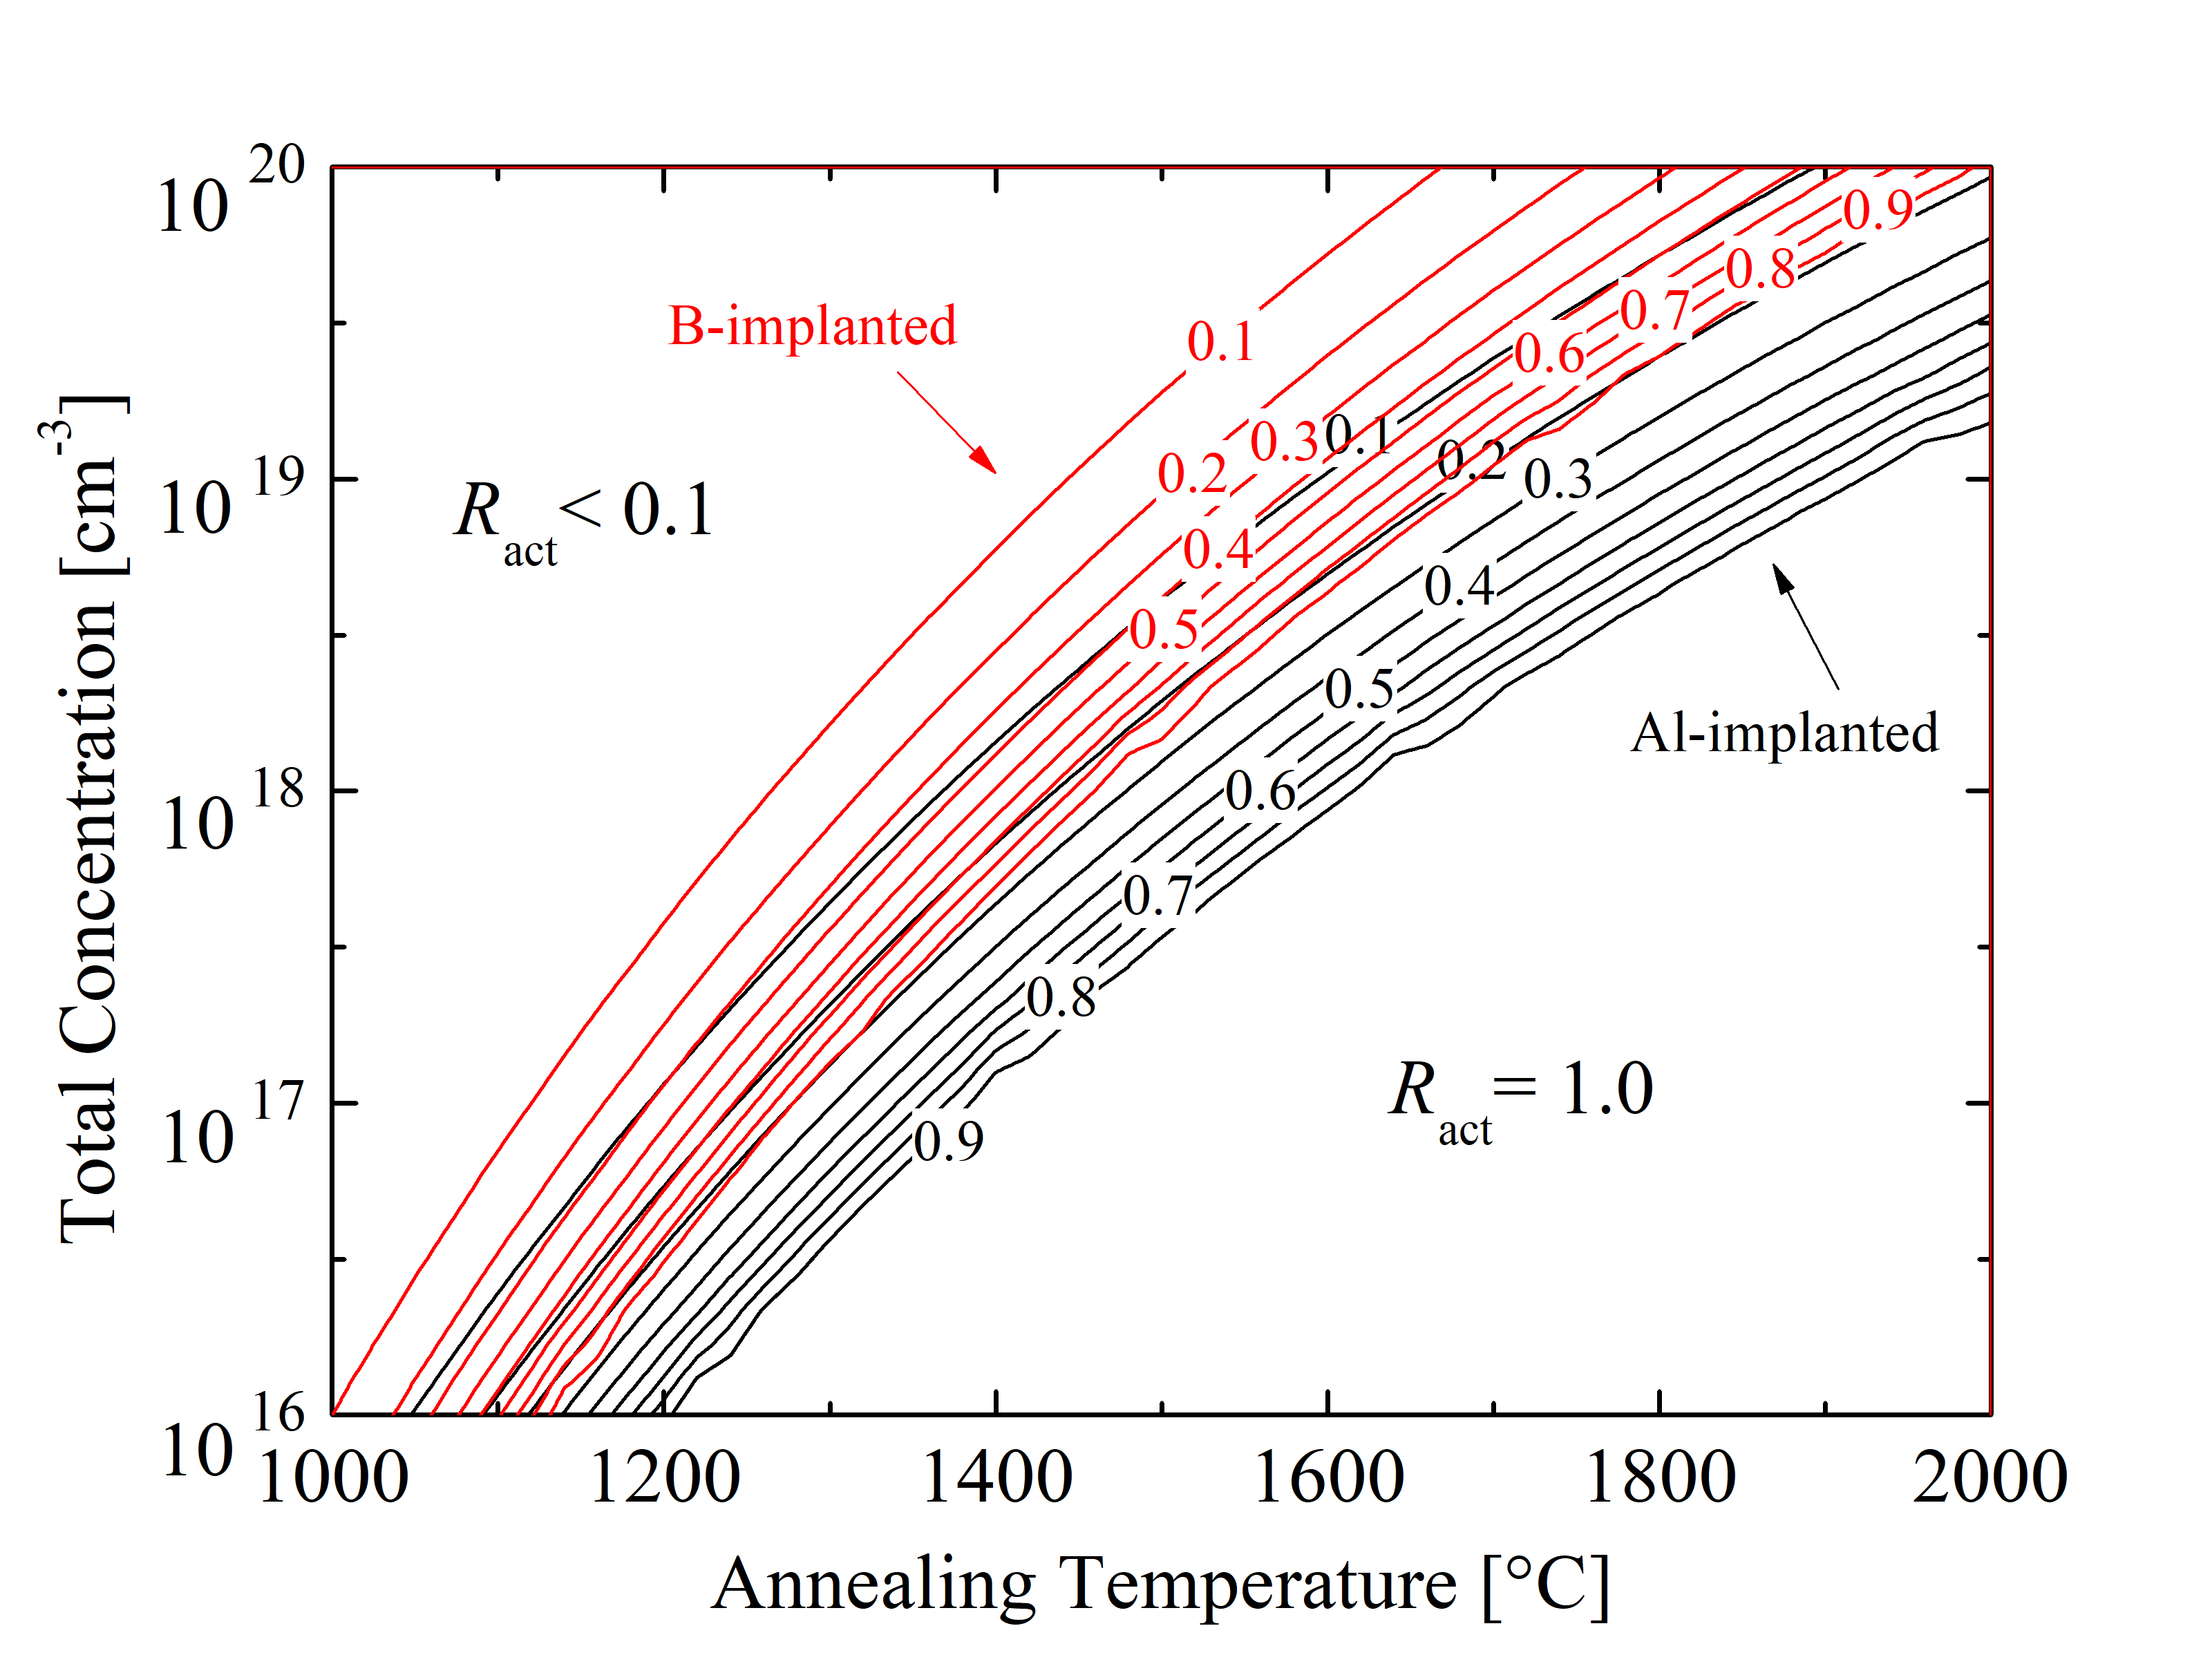
The predicted phase diagrams are crucial to correctly predict parameters for SiC device processing, where the balance between the efficiency of electrical properties and the costs for post-implantation annealing must be carefully considered to optimize fabrication steps. When comparing donor-type dopants it is clear that P implants in general require higher annealing temperatures for successful anneals (i.e., activation above 90%), compared to N implants. For the low-dose implantations, below 1017 cm-3, both of the implants are activated even for TA < 1200°C. However, for high-dose implantation (Ctot = 1.0 · 1020 cm-3), P implants are poorly activated (i.e., Ract < 0.1) even at TA \approx 2000°C, while on the other hand, N implants for the same Ctot are fully activated at TA = 1750°C. Comparing acceptor-type dopants at low-dose implantation, the full activation state (Ract = 1) is achieved at TA = 1070°C for Al-implanted and TA = 1010°C for B-implanted SiC. In contrast, for high-dose implantation the full activation in thermal equilibrium is achieved at TA = 1940°C for Al and TA = 1695°C for B-implanted SiC. This suggests that for low Ctot lower temperatures are sufficient for full activation of Al, compared to B. However, for high Ctot this effect reverses. In addition, for Ctot = 1020 cm-3 the full activation of Al acceptors is not achieved for the investigated annealing temperatures, but in contrast, B acceptors with the identical implantation dose reached full activation at TA = 2010°C.
3.3.4 Simulations
The semi-empirical activation model has been integrated into Silvaco’s Victory Process simulator [53], which now includes calibrated model parameters as discussed in Section 3.3.2. In this section, in order to verify predictions of the semi-empirical model, the results of process simulations are compared to experimental findings. As will be discussed, process simulations include all the steps of typical device fabrication processes, such as implantation, oxidation, and annealing. For the verification of the model numerous simulations of the same device are performed, but with different values of a single parameter involved in a particular simulation step. More concretely, numerous SiC diodes are processed with various annealing temperatures to examine and clarify the effects of the temperature involved in the annealing step.
This section focuses on Al- and B-implanted SiC due to the availability of experimental data with respect to various annealing temperatures. The doping as well as the annealing steps follow the experimental setups of Saks et al. [134] and Troffer et al. [147] in order to enable an elaborate comparison. The implantation steps have been performed with Silvaco’s Victory Process simulator using Monte Carlo ion implantation on (\(0001\)) Si-oriented 4H-SiC. The annealing steps have been performed with the semi-empirical model and parameters, alongside the Fermi diffusion model. An example of the simulated device is shown in Figure 3.14. The simplicity of the simulated devices is vital in order to ensure a proper, focused investigation of the process annealing steps, including the total doping concentration and the annealing temperature.

Figure 3.14: Schematic representation of the doping profile and geometry of the processed device in Silvaco’s Victory Process simulator. The colors (left) refer to different doping regions, the gray region (right) is SiC substrate, and the light rose regions (right) are ohmic contacts, i.e., anode and cathode.
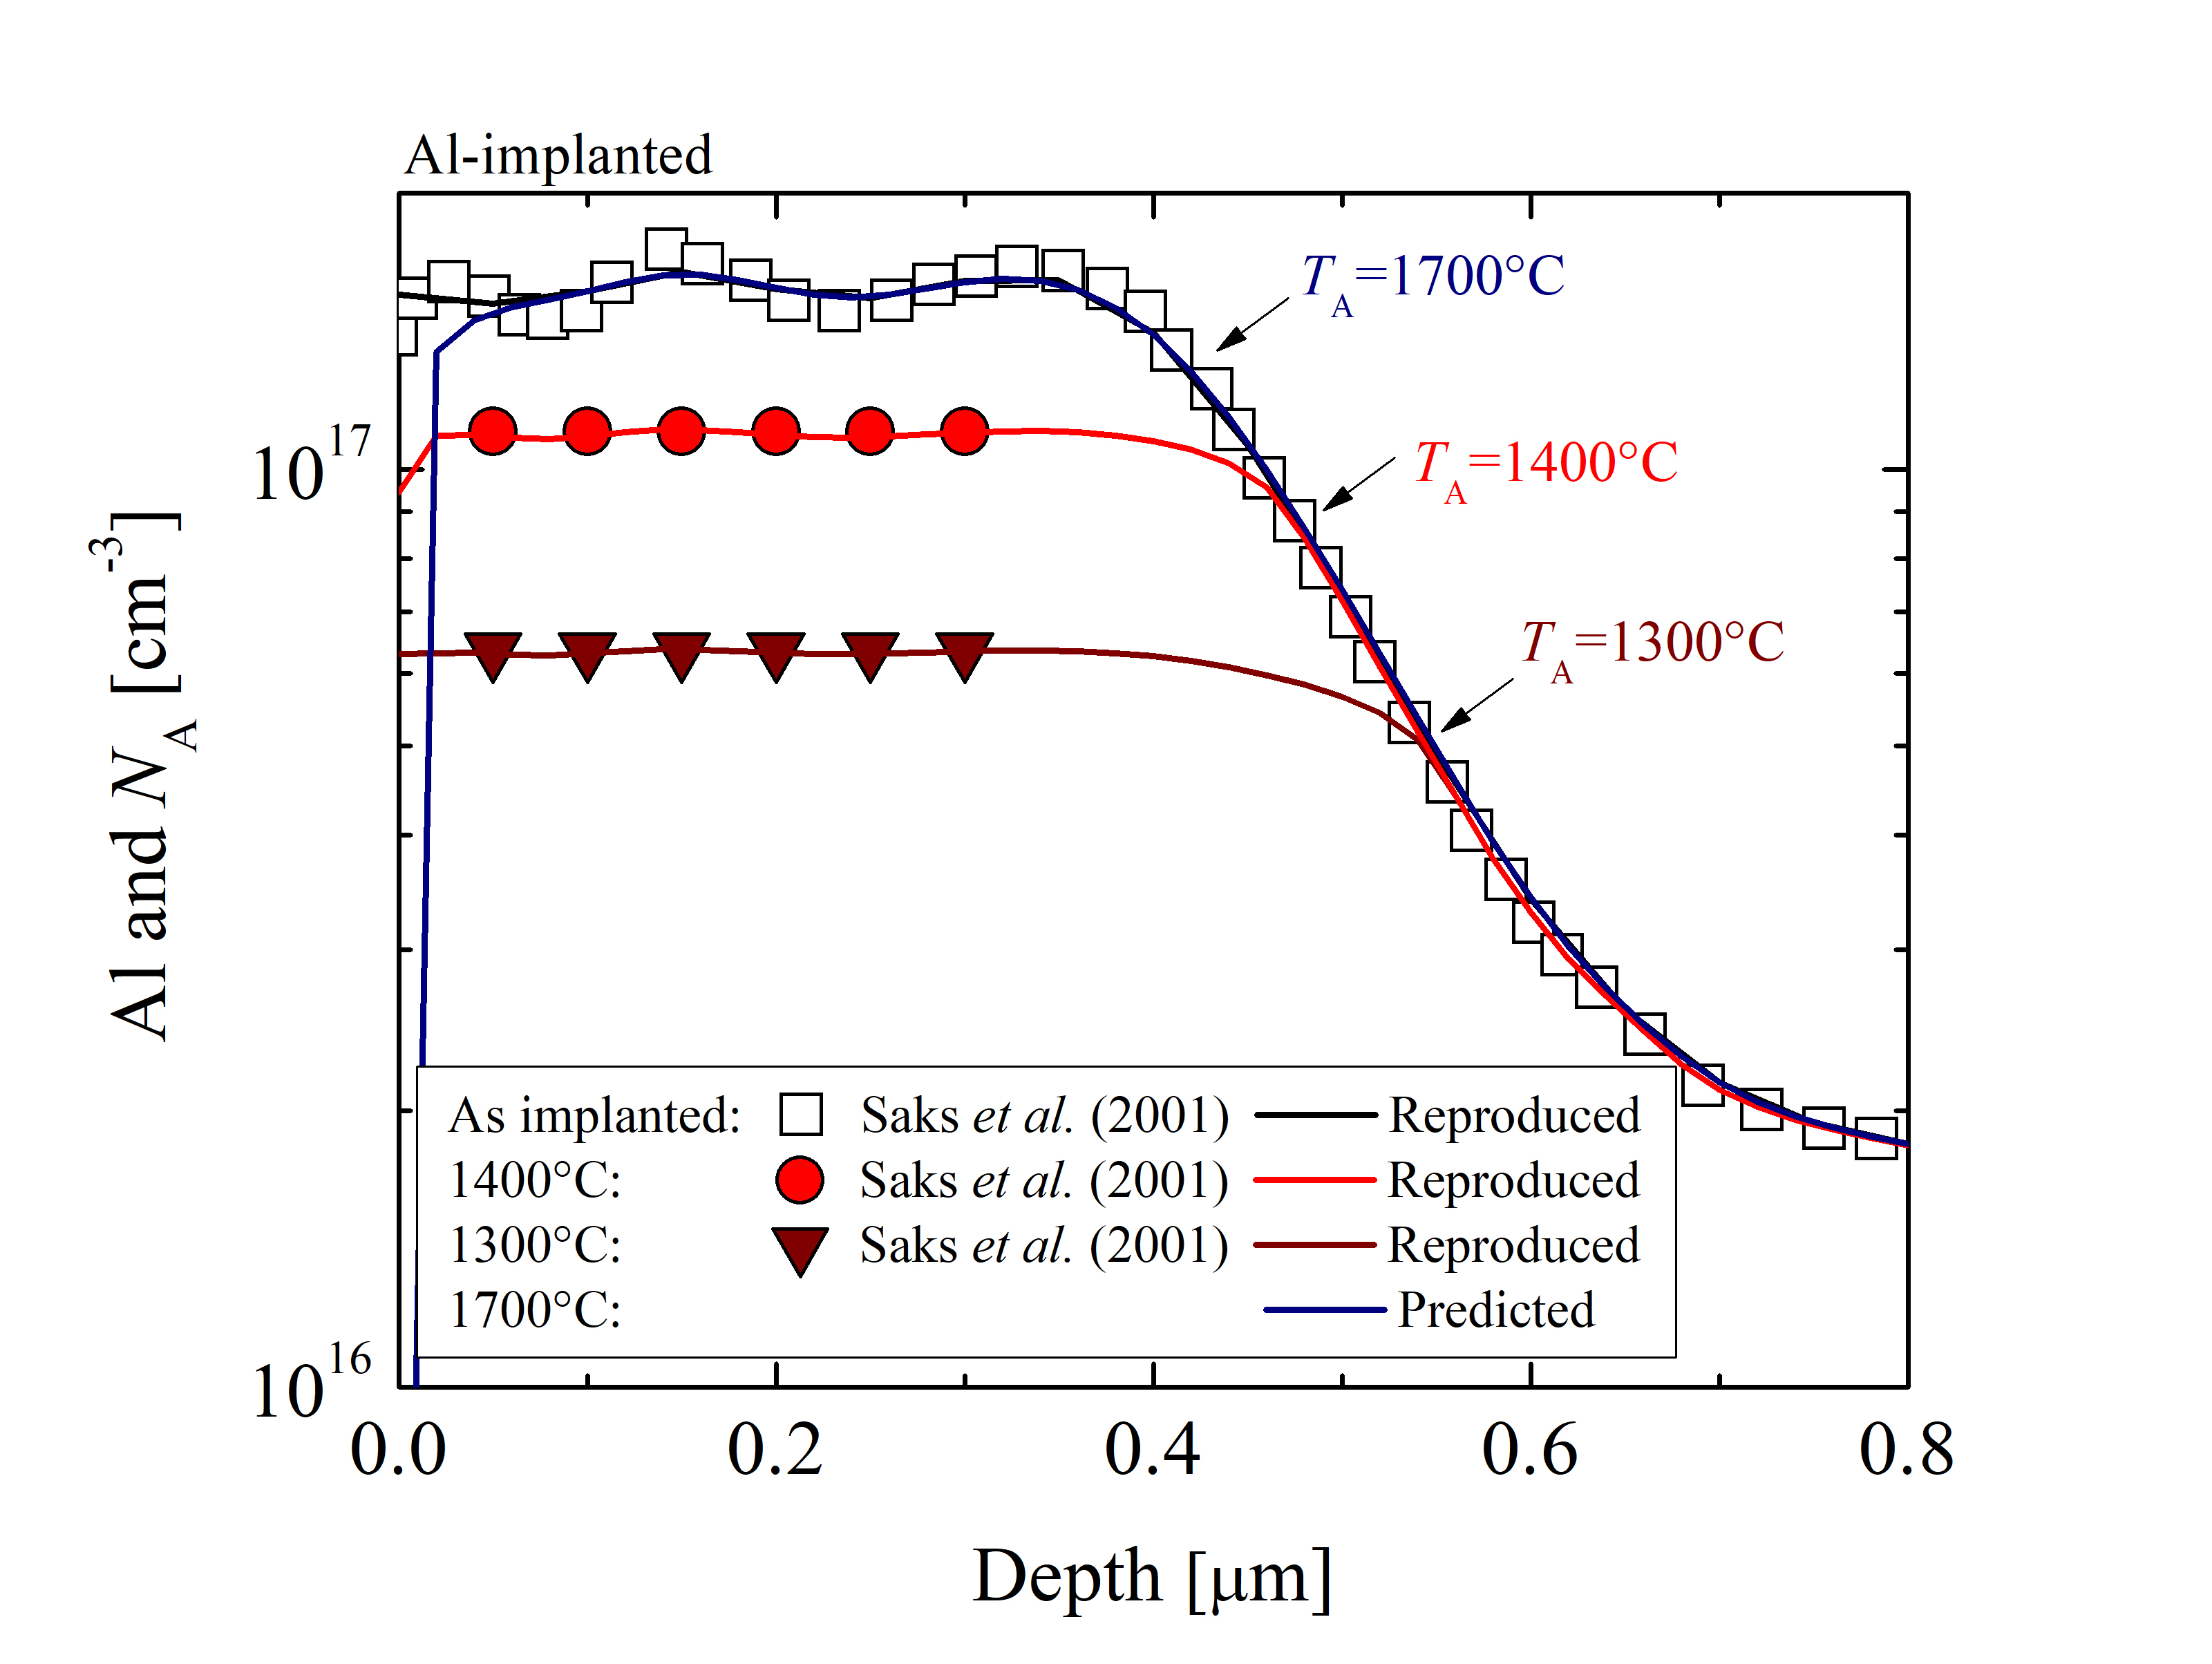
The semi-empirical activation model is evaluated by comparisons between simulations and experiments, shown in Figure 3.15. The first simulation setup (Figure 3.15a) follows the experimental setup of Saks et al. [134], which consists of an N-doped, n-type SiC wafer with a compensation concentration of ≈ 5 · 1015 cm-3, followed by several Al-implantations generating a rectangular profile with a mean concentration of ≈ 1017 cm-3. The annealing steps are 12 h at TA = 1300°C, 1 h at TA = 1400°C, and 10 min at TA = 1500°C. The time of the thermal treatment influences the diffusion, but does not enter the proposed activation model. The second simulation setup (Figure 3.15b) follows the experimental setup of Troffer et al. [147], which consists of a N-doped, n-type SiC wafer with a compensation concentration of ≈ 1.5 · 1016 cm-3, followed by several B-implantations generating a rectangular profile with a mean concentration of ≈ 1019 cm-3. The annealing steps are 30 min at TA = 1500°C, 30 min at TA = 1600°C, and 30 min at TA = 1700°C.
The depth profiles of both p-type dopants are reproduced with an average variation σ < 3% for all of the implantation and annealing steps. This confirms that the semi-empirical model predicts acceptor concentrations very accurately in the temperature range of TA > 1200°C and TA < 1800°C and total implanted concentration range of Ctot > 1016 cm-3 and Ctot < 1020 cm-3. Outside of these limitations the model extrapolates predictions according to Arrhenius fits.
In addition to the verification by comparison with experimental data, various simulations to predict a minimal required temperature for the full activation of the implants are performed. In the first case of 1.0 · 1017 cm-3 Al-implanted SiC, an activation ratio Ract = 1 is achieved for the thermal treatments above TA = 1700°C. In the case of 1.0 · 1019 cm-3 B-implanted SiC, Ract = 1 is achieved for the annealing steps above TA = 1750°C. The annealing steps of B-implanted SiC additionally show a high diffusion of B ions over the entire implanted region. However, the diffusion of Al ions is negligible and evident only at the surface, i.e., depth < 0.05 μm. These findings are consistent with the conclusions of Saks et al. [134].
(a)
(b)
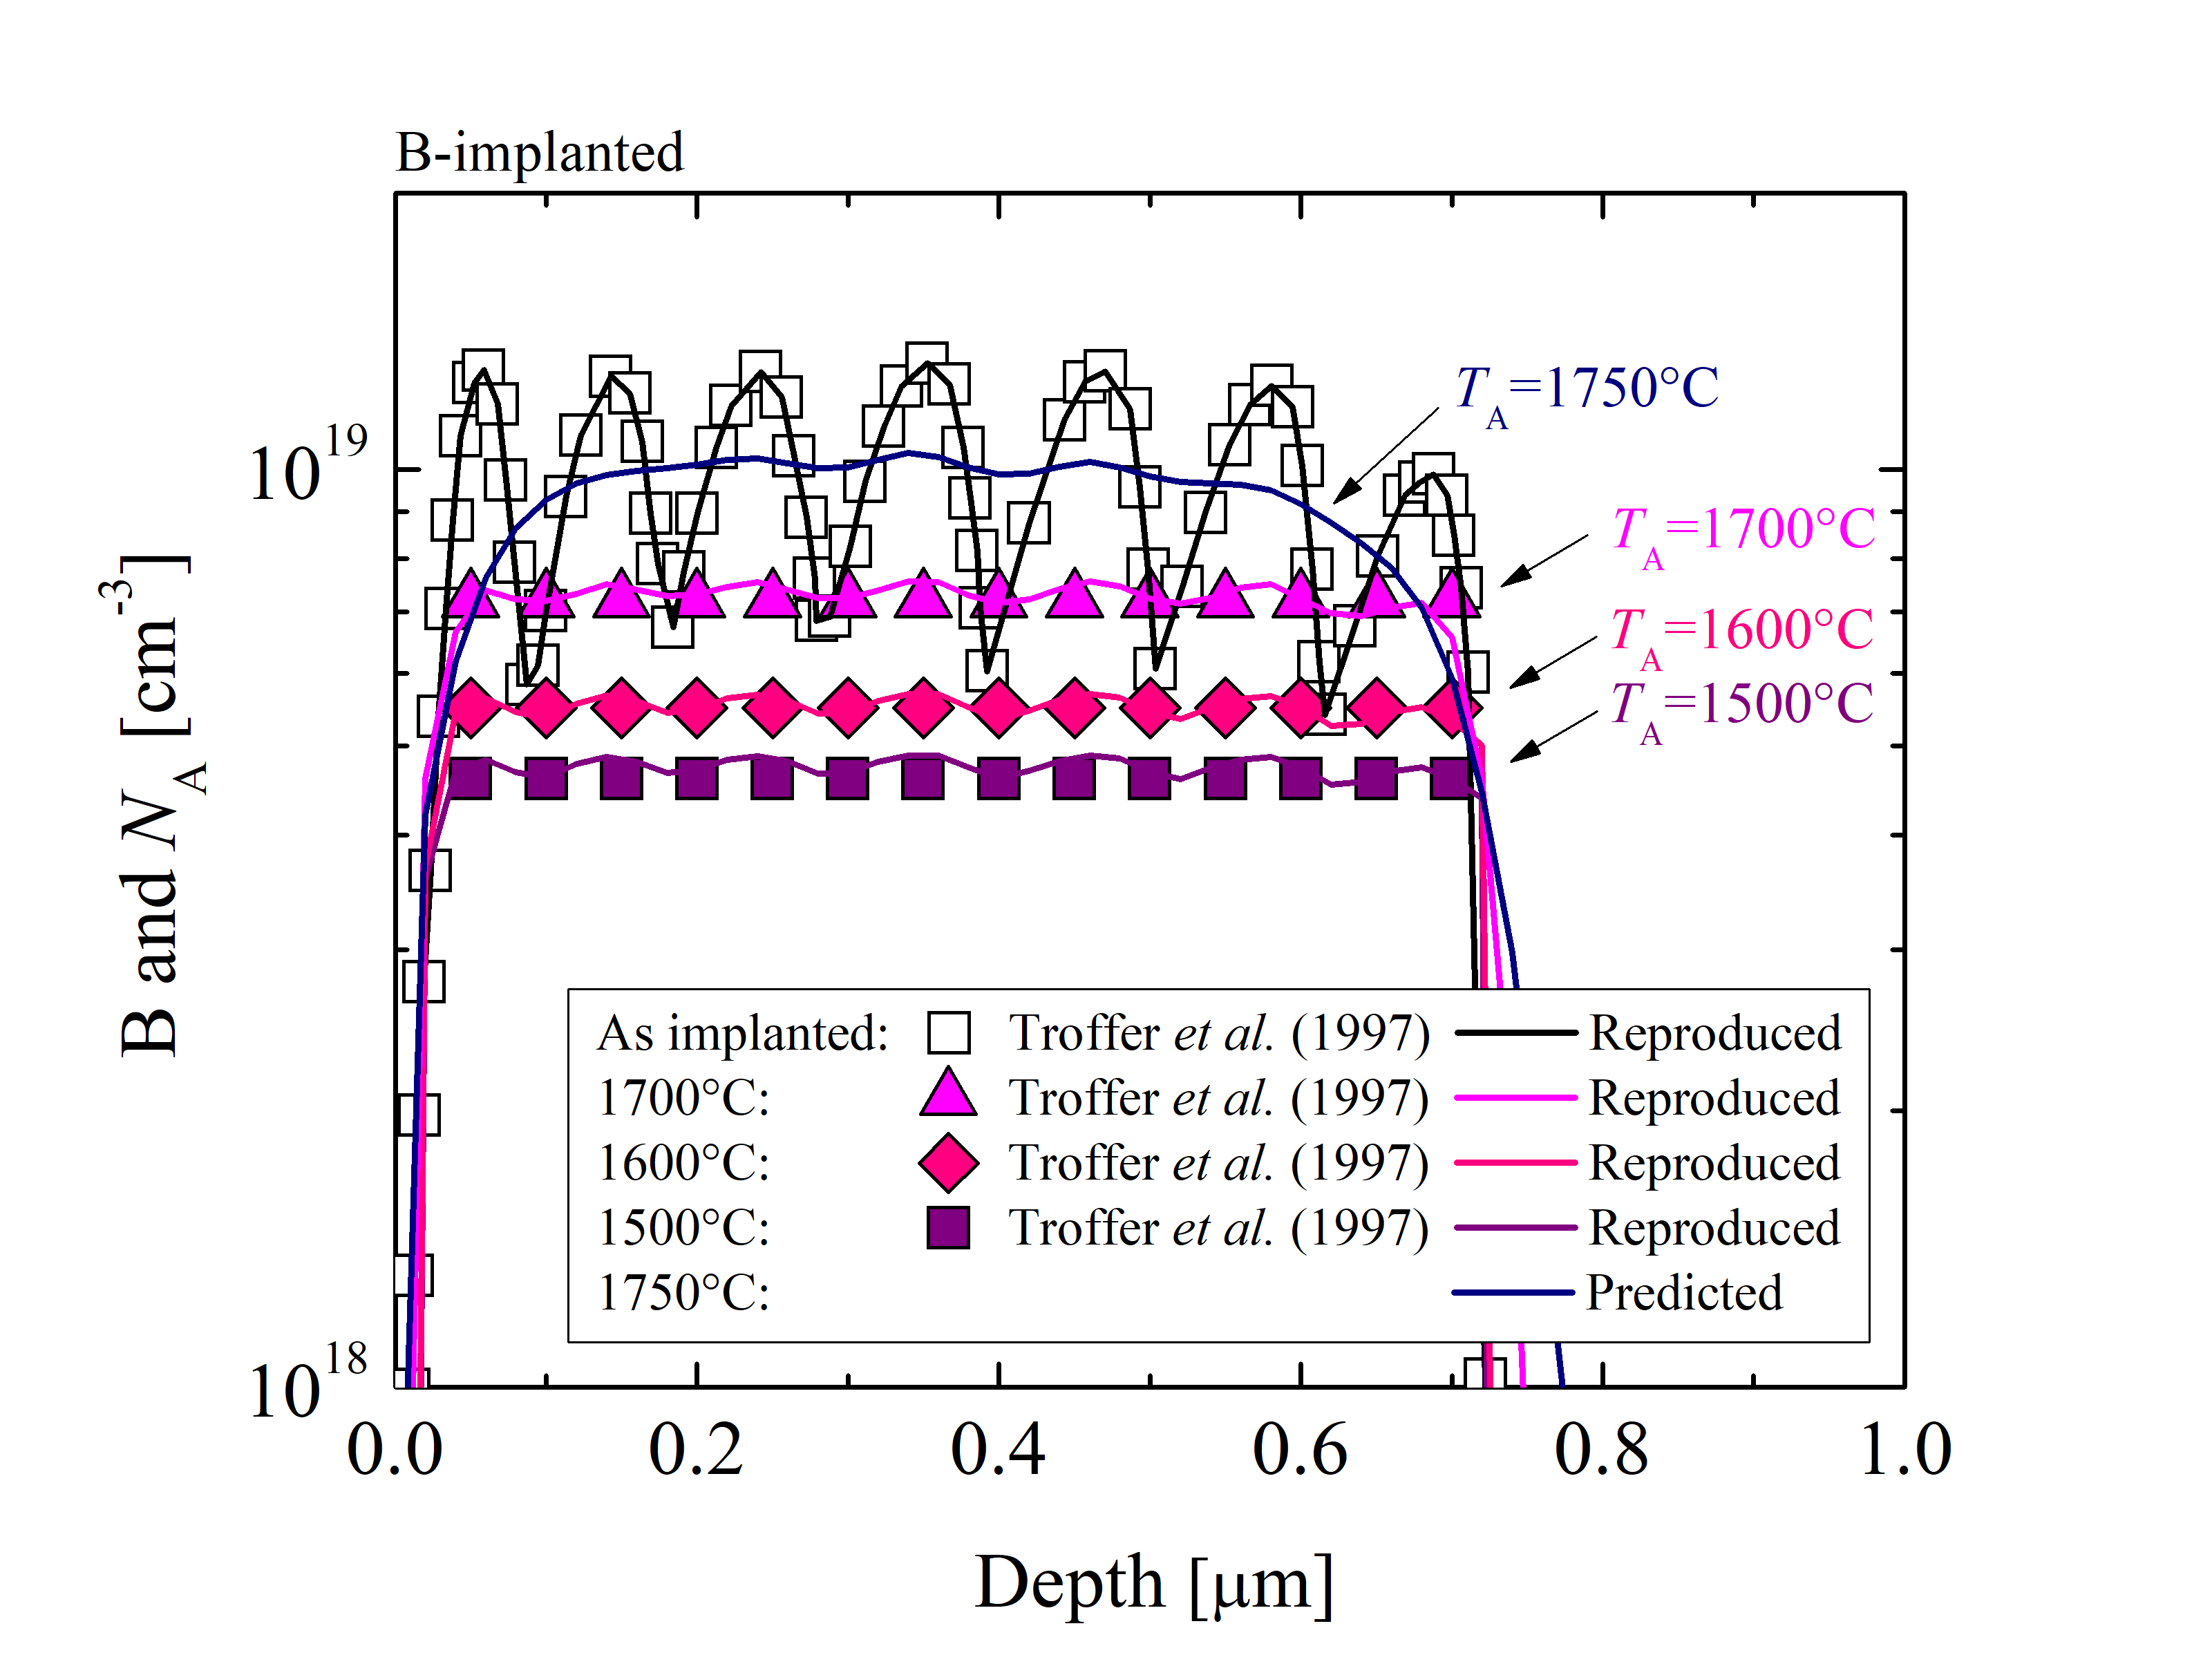
Figure 3.15: Depth profiles of implanted dopant and annealed acceptor concentrations of (a) Al- and (b) B-implanted SiC. The open symbols refer to the implanted profiles, colored symbols refer to the experimental data of average concentrations from Saks et al. [134] and Troffer et al. [147], and the solid lines refer to the reproduced and predicted results obtained in this study. The simulations have been performed with Silvaco’s Victory Process simulator using Monte Carlo ion implantation, the Fermi diffusion model, and the here presented semi-empirical activation model.
To further corroborate the predictability of the semi-empirical model, device simulations of the processed Al-implanted SiC diodes are performed. The third simulation setup follows the experimental setup of Nipoti et al. [156], which consists of an n-type SiC wafer with a compensation concentration of ≈ 3 · 1015 cm-3, followed by several Al-implantations generating a rectangular profile with a mean concentration of ≈ 1020 cm-3. The annealing steps are 30 min at TA = 1500°C, 30 min at TA = 1600°C, 30 min at TA = 1700°C, and 1 min at TA = 1950°C. The mean concentration of this setup exceeds the mean concentrations of the data considered for the model calibration, therefore, these simulations reflect model predictions based on the extrapolation of the model parameters. The resistivity of the variously processed devices, i.e., different annealing temperatures, is shown in Figure 3.16. The simulations show excellent agreement with the experimental data, which indicates that the model correctly predicts the device properties outside of the calibrated regions as well. The figure in addition confirms the importance of the post-implantation annealing steps, which can be seen by the four times decrease in resistivity. This further underlines the importance of the proposed activation model, as a 100% activation for high-dose implantation cannot be assumed, but must be accurately predicted, because this critically affects device performance.
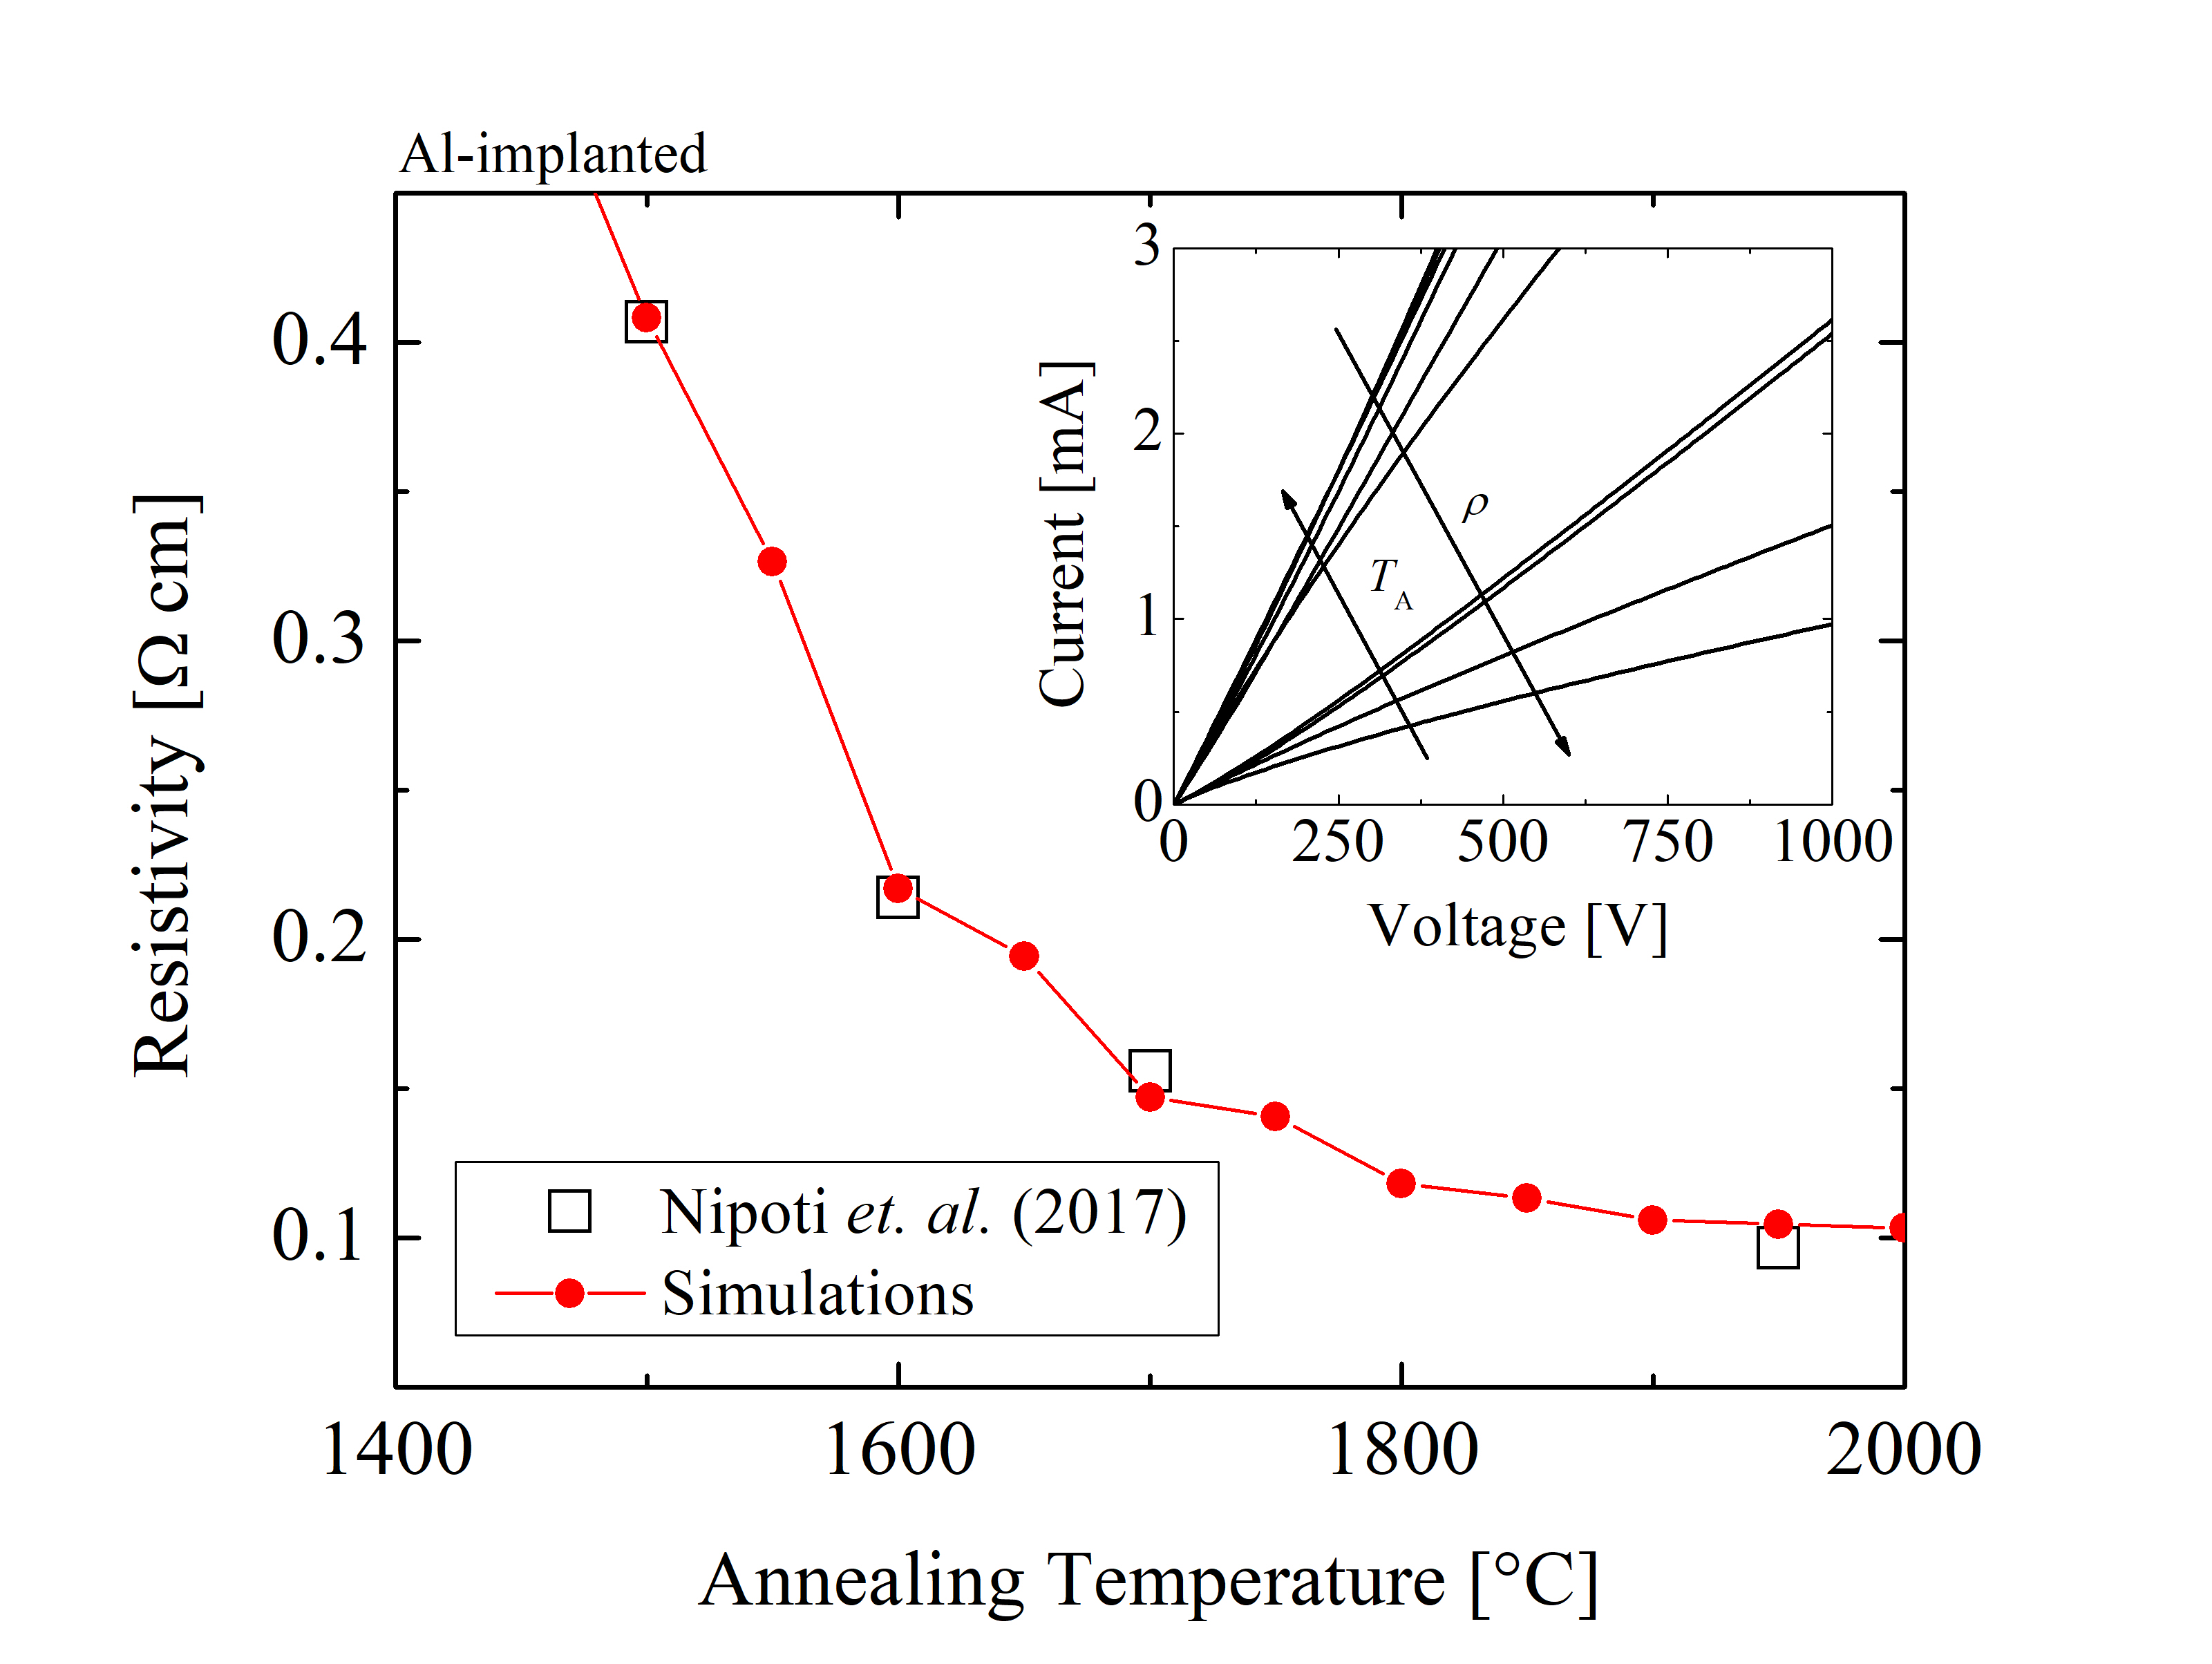
Figure 3.16: Resistivity of the Al-implanted SiC as a function of the annealing temperature. The open squares refer to the experimental data from Nipoti et al. [156] and the closed symbols refer to the resistivity calculated from the simulations. The inset figure shows simulation results, i.e., current as a function of voltage for samples annealed at various annealing temperatures.