2.6 Orientation-Dependent Oxidation Model
Considering the above discussed Massoud’s model (cf. Section 2.3.2), the calibrated oxidation growth rates (cf. Section 2.4.2), and the developed 3D interpolation method (cf. Section 2.5), the full expression of the orientation-dependent oxidation model is written as
\( \seteqsection {2} \) \( \seteqnumber {62} \)
\begin{equation} \frac {dX(x, y, z)}{dt} = \frac {B}{A^\mathrm {3D} + 2 X} + C^\mathrm {3D} e^{-\frac {X}{L^\mathrm {3D}}} \mathrm {, with } \end{equation}
\( \seteqsection {2} \) \( \seteqnumber {63} \)
\begin{equation} B = D_{0} e^{\left (-\frac {E_\mathrm {a}^\mathrm {SD}}{k_\mathrm {B} T}\right )} \mathrm { } \mu \mathrm {m}^2 \mathrm { min}^{-1}, \end{equation}
\( \seteqsection {2} \) \( \seteqnumber {64} \)
\begin{equation} \begin {split} A^\mathrm {3D} &= \frac {B}{B/A} = \\ & = B \Bigg [ Z_\mathrm {B/A}^\mathrm {a-face} e^{\left (-\frac {E_\mathrm {a, B/A}^\mathrm {a-face}}{k_\mathrm {B} T}\right )} \\ & + \left (Z_\mathrm {B/A}^\mathrm {m-face} e^{\left (-\frac {E_\mathrm {a, B/A}^\mathrm {m-face}}{k_\mathrm {B} T}\right )} - Z_\mathrm {B/A}^\mathrm {a-face} e^{\left (-\frac {E_\mathrm {a, B/A}^\mathrm {a-face}}{k_\mathrm {B} T}\right )}\right ) f(x,y) \\ & + \left (Z_\mathrm {B/A}^\mathrm {Si-face} e^{\left (-\frac {E_\mathrm {a, B/A}^\mathrm {Si-face}}{k_\mathrm {B} T}\right )} - Z_\mathrm {B/A}^\mathrm {a-face} e^{\left (-\frac {E_\mathrm {a, B/A}^\mathrm {a-face}}{k_\mathrm {B} T}\right )}\right ) z^2 \Bigg ]^{-1} \text { for } z \geq 0 \mathrm { or} \\ & + \left (Z_\mathrm {B/A}^\mathrm {C-face} e^{\left (-\frac {E_\mathrm {a, B/A}^\mathrm {C-face}}{k_\mathrm {B} T}\right )} - Z_\mathrm {B/A}^\mathrm {a-face} e^{\left (-\frac {E_\mathrm {a, B/A}^\mathrm {a-face}}{k_\mathrm {B} T}\right )}\right ) z^2 \Bigg ]^{-1} \text { for } z < 0 , \end {split} \end{equation}
\( \seteqsection {2} \) \( \seteqnumber {65} \)
\begin{equation} \begin {split} C^\mathrm {3D} &= Z_\mathrm {C}^\mathrm {a-face} e^{\left (-\frac {E_\mathrm {a, C}^\mathrm {a-face}}{k_\mathrm {B} T}\right )} \\ & + \left (Z_\mathrm {C}^\mathrm {m-face} e^{\left (-\frac {E_\mathrm {a, C}^\mathrm {m-face}}{k_\mathrm {B} T}\right )} - Z_\mathrm {C}^\mathrm {a-face} e^{\left (-\frac {E_\mathrm {a, C}^\mathrm {a-face}}{k_\mathrm {B} T}\right )}\right ) f(x,y) \\ & + \left (Z_\mathrm {C}^\mathrm {Si-face} e^{\left (-\frac {E_\mathrm {a, C}^\mathrm {Si-face}}{k_\mathrm {B} T}\right )} - Z_\mathrm {C}^\mathrm {a-face} e^{\left (-\frac {E_\mathrm {a, C}^\mathrm {a-face}}{k_\mathrm {B} T}\right )}\right ) z^2 \text { for } z \geq 0 \mathrm { or} \\ & + \left (Z_\mathrm {C}^\mathrm {C-face} e^{\left (-\frac {E_\mathrm {a, C}^\mathrm {C-face}}{k_\mathrm {B} T}\right )} - Z_\mathrm {C}^\mathrm {a-face} e^{\left (-\frac {E_\mathrm {a, C}^\mathrm {a-face}}{k_\mathrm {B} T}\right )}\right ) z^2 \text { for } z < 0 , \end {split} \end{equation}
\( \seteqsection {2} \) \( \seteqnumber {66} \)
\begin{equation} \begin {split} L^\mathrm {3D} &= Z_\mathrm {L}^\mathrm {a-face} e^{\left (-\frac {E_\mathrm {a, L}^\mathrm {a-face}}{k_\mathrm {B} T}\right )} \\ & + \left (Z_\mathrm {L}^\mathrm {m-face} e^{\left (-\frac {E_\mathrm {a, L}^\mathrm {m-face}}{k_\mathrm {B} T}\right )} - Z_\mathrm {L}^\mathrm {a-face} e^{\left (-\frac {E_\mathrm {a, L}^\mathrm {a-face}}{k_\mathrm {B} T}\right )}\right ) f(x,y) \\ & + \left (Z_\mathrm {L}^\mathrm {Si-face} e^{\left (-\frac {E_\mathrm {a, L}^\mathrm {Si-face}}{k_\mathrm {B} T}\right )} - Z_\mathrm {L}^\mathrm {a-face} e^{\left (-\frac {E_\mathrm {a, L}^\mathrm {a-face}}{k_\mathrm {B} T}\right )}\right ) z^2 \text { for } z \geq 0 \mathrm { or} \\ & + \left (Z_\mathrm {L}^\mathrm {C-face} e^{\left (-\frac {E_\mathrm {a, L}^\mathrm {C-face}}{k_\mathrm {B} T}\right )} - Z_\mathrm {L}^\mathrm {a-face} e^{\left (-\frac {E_\mathrm {a, L}^\mathrm {a-face}}{k_\mathrm {B} T}\right )}\right ) z^2 \text { for } z < 0 , \end {split} \end{equation}
and
\( \seteqsection {2} \) \( \seteqnumber {67} \)
\begin{equation} f(x,y)=\left ( 2(x^2+y^2)^3 - (x^2 + y^2)^4 - x^2 (x^2 - 3 y^2)^2 \right ). \end{equation}
x, y, and z are vector coordinates for the desired direction of oxidation. The subscripts B/A, C, and L refer to Massoud’s model parameters. This modified oxidation model enables to fully simulate thermal oxidation of arbitrary 2D and 3D structures with a high precision in all crystal directions. The orientation-dependent oxidation model (i.e., the calibrated parameters and the interpolation method) was implemented into Silvaco’s Victory Process simulator [53] and is evaluated in the following section based on 3D simulations of SiC thermal oxidation for various simulation setups.
2.6.1 Process Simulations
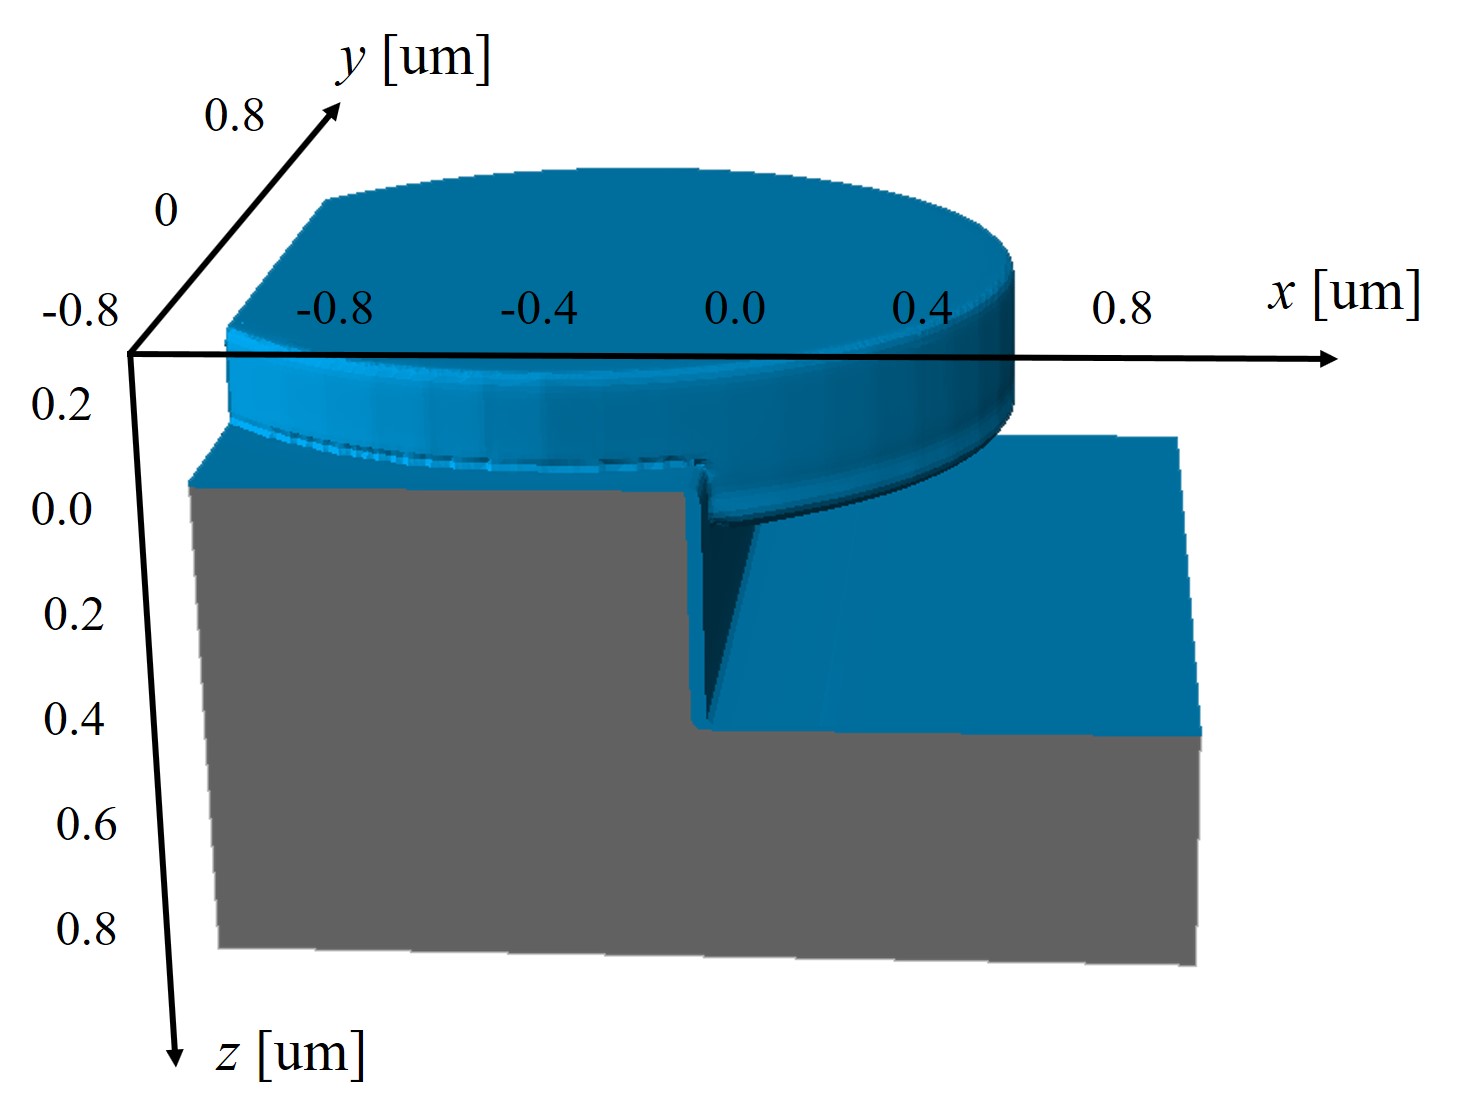
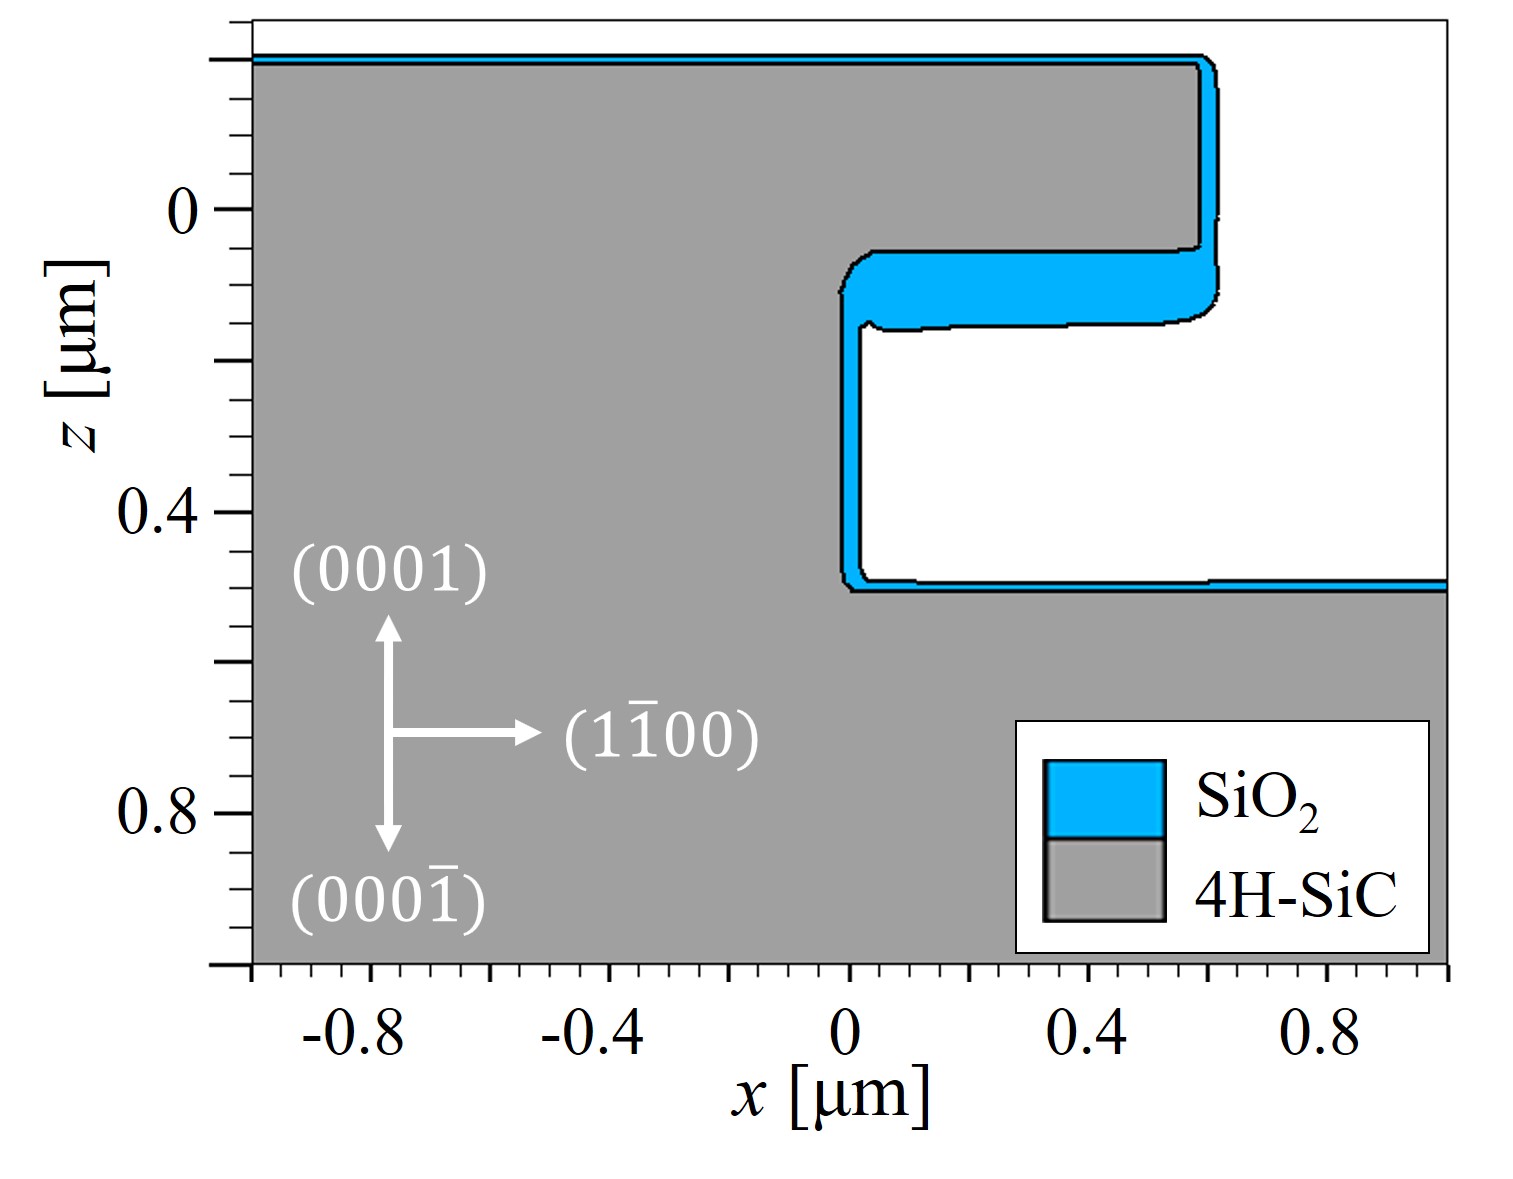
An exemplary 3D simulation of the thermal oxidation of an arbitrary SiC structure is shown in Figure 2.20 and its 2D cross-sections in Figure 2.21. The simulation results clearly demonstrate that the oxide thickness on the C-face is the thickest and the oxide on the Si-face is the thinnest. The oxide in the x direction, i.e., m-face, is approximately 10% thicker than the oxide in the y direction, i.e., a-face. Despite the fact that the thickness difference of the m- and the a-face seems negligible, the small variations in the oxide thicknesses still play a significant role in the design of MOS devices, in particular for non-planar devices such as U-MOSFET [107], due to the high oxide thickness-dependent device characteristics.
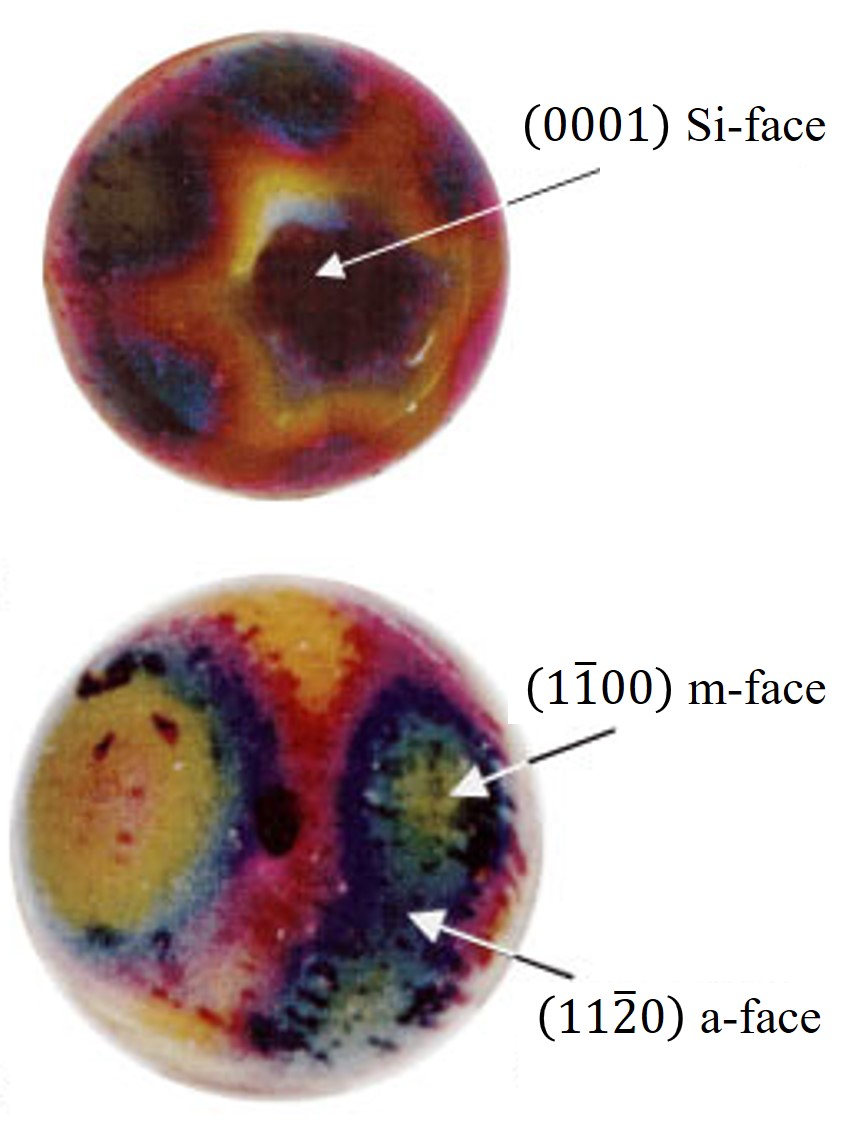
Figure 2.22 depicts additional 3D simulations by using a sphere-shaped plot for direct comparison with measurement results [88]. The shown optical micrographs have been obtained with Rutherford backscattering spectrometry (RBS). The SiO2 thickness is determined based on the width of the RBS spectrum corresponding to Si atoms in SiC and O atoms in SiO2. The experimental results show a remarkable anisotropic coating with SiO2, which can be seen from the optical micrographs, i.e., spheres.
(a)
(b)
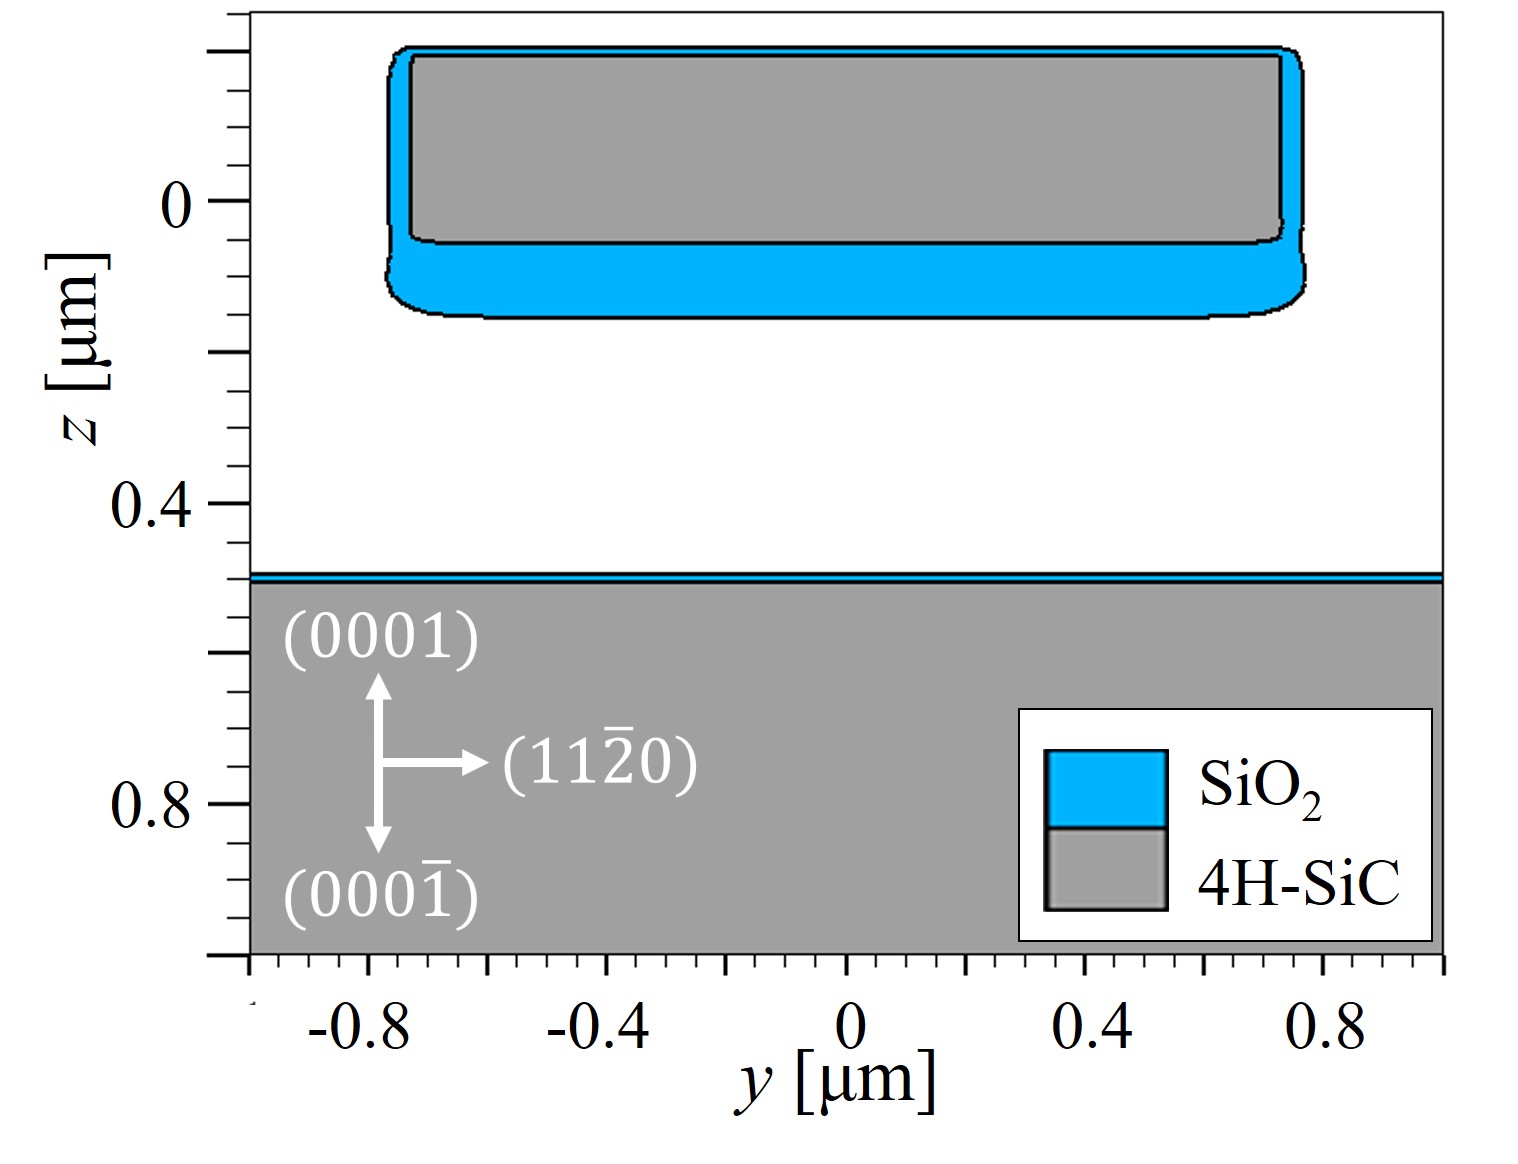
Figure 2.21: 2D cross-sections of the conducted 3D simulations of dry thermal oxidation (cf. Figure 2.20). (a) x-z cross section at y = 0.0 μm and (b) y-z cross section at x = 0.2 μm. Note the different oxide thicknesses based on different directions.
(a)
(b)
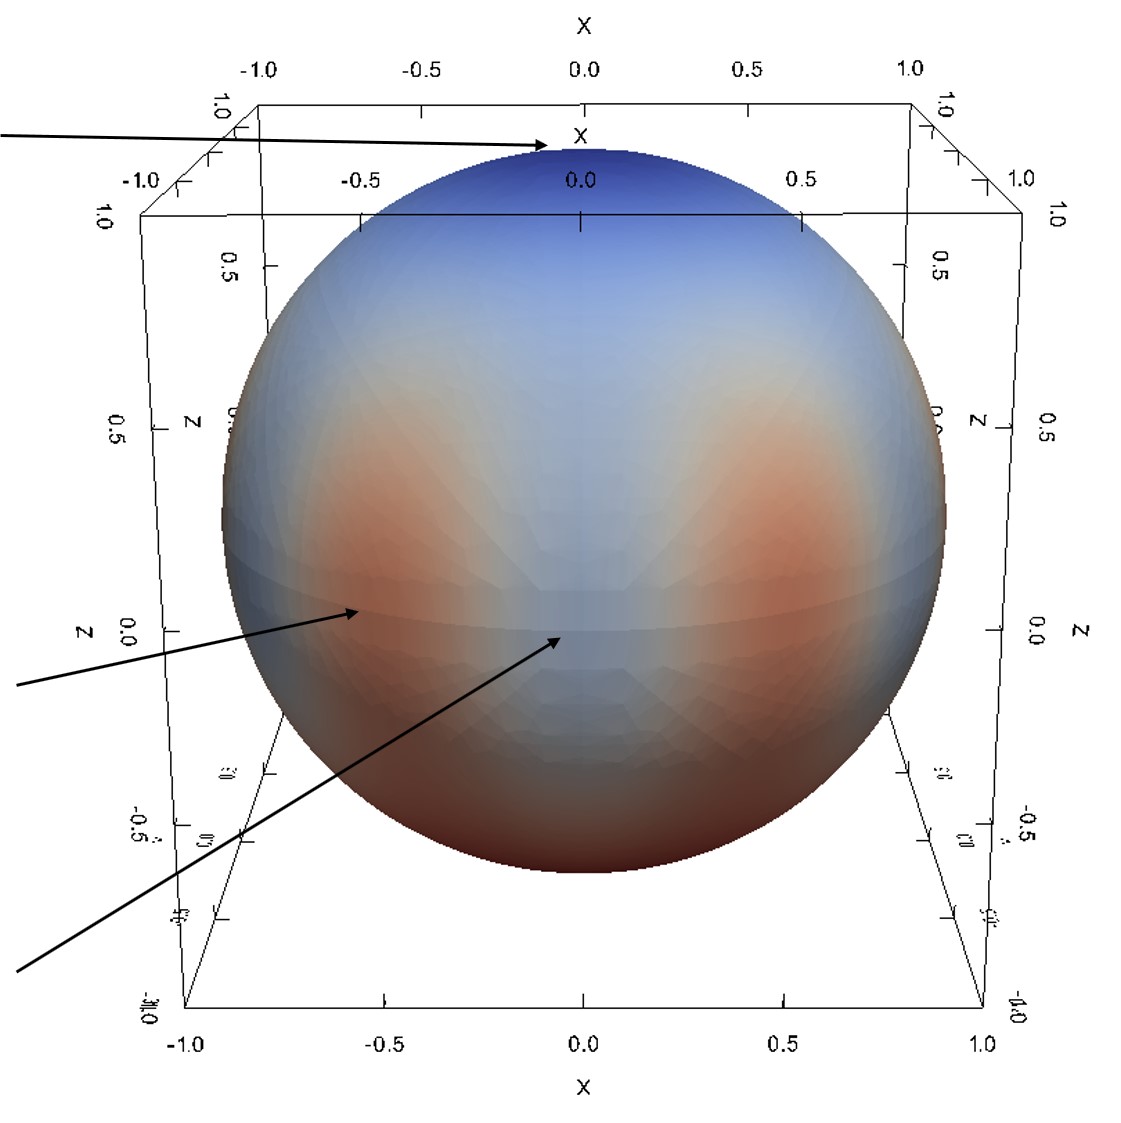
Figure 2.22: (a) Measurement results (optical micrographs) of an oxidized SiC from Christiansen et al. [88]. The contrast of colors is due to the light interference with the different oxide thickness. (b) The sphere of SiC oxide thicknesses obtained with the developed interpolation-based modeling method. The colors represent calculated thicknesses towards corresponding crystal directions. The simulations have been performed for \((0001)\) Si-face at T = 1100°C for 720 min.
The experimental study has thus identified the two polar regions (assigned to the Si- and C-face) and an equatorial zone, which shows six maxima and six minima. It was determined that the maximum of the oxide thickness corresponds to the m-face and the minimum to the a-face. Therefore, a six-fold symmetry yields a star-shaped directional dependence. This observation indicates that the initial assumption of the interpolation method, i.e., a symmetric star shape in the x-y plane and a tangent-continuous union of two half-ellipses in z direction, are equitable.
Another analysis evaluates a step-like shape of a SiC substrate, which is reproduced from the experimental work of Hosoi et al. [108] to establish a frame of reference. The experimental research utilized atomic force microscopy (AFM) to measure the SiC surface thickness before and after oxidation. The thermal oxidation, in both experiment and simulation, is performed for the most common industry-related SiC oxidation setup, i.e., a \((0001)\) Si-face substrate with 4° off-axis angle in a dry ambient at 1100°C, shown in Figure 2.23.
It is clearly seen from the results that the oxidation in the direction of the a-face is stronger than in the direction of the Si-face. The time evolution confirms that the SiC/SiO2 interface is heavily influenced by oxidation mechanisms [109], i.e., the interface is deformed and moves towards inside the substrate for ≈ 0.15 μm within 720 min.
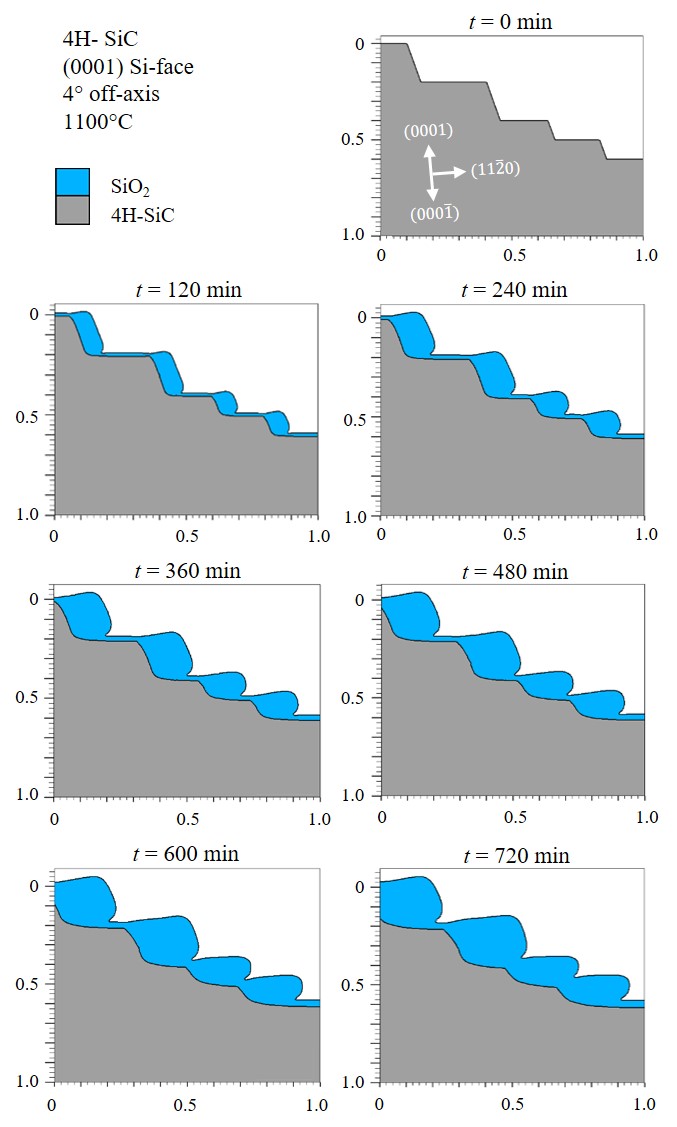
Figure 2.23: Simulations of thermal oxidation of a step-like shaped 4H-SiC. The simulation is performed for a \((0001)\) Si-face 4° off-axis substrate at T = 1100°C. The results show the time evolution of the SiC oxidation for every 120 min. The gray and the blue shapes refer to the 4H-SiC and SiO2, respectively.
Comparing the simulation results with the measurement results [108] demonstrates a very good agreement, justifying the importance of the calibrated oxidation growth rate parameters and the discussed multi-dimensional interpolation method.
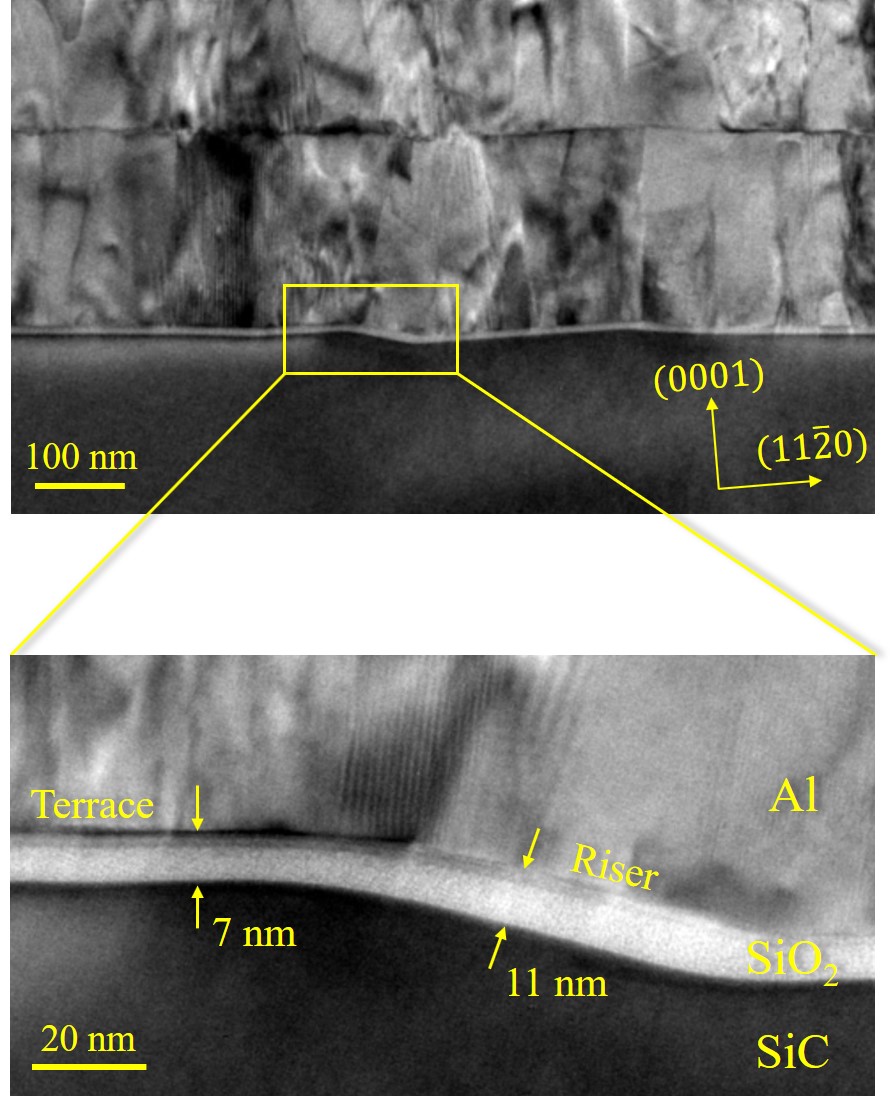
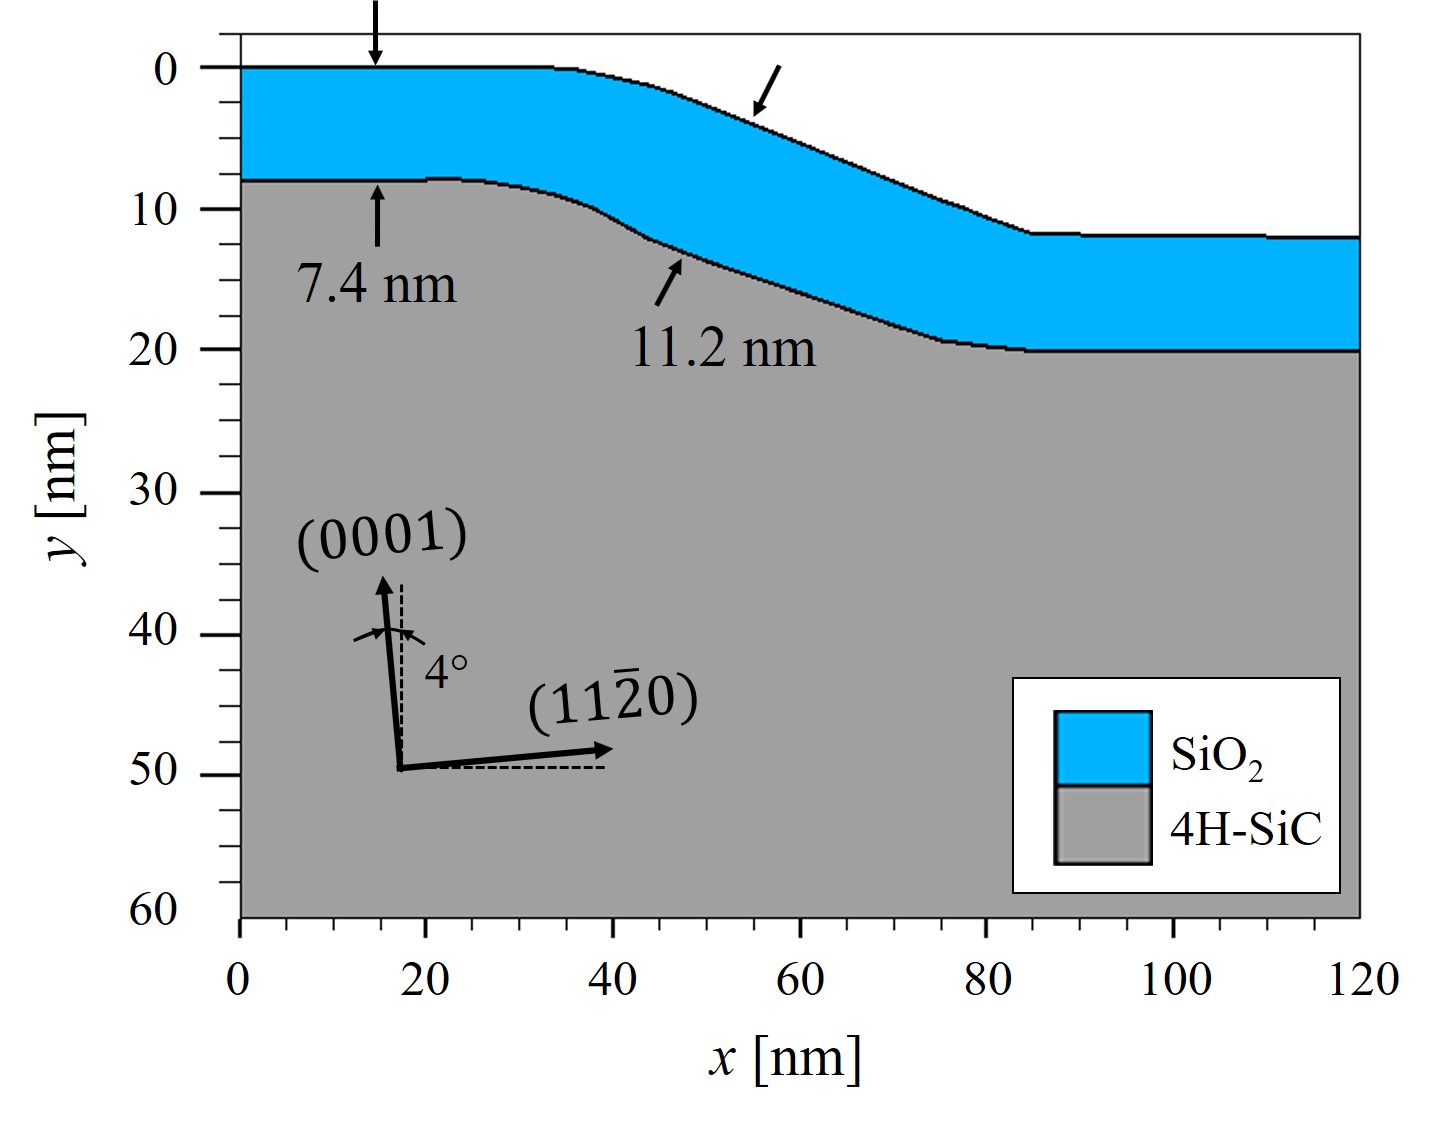
The final verification is based on transmission electron microscopy (TEM) measurements of a macrostep at the SiO2/SiC interface from Woerle et al. [110]. Epitaxial layers formed by step-controlled epitaxial growth are an important example of a surface requiring a substrate cut, which is several degrees off-angle for high-purity epitaxies [111]. At the same time, however, this growth technique can lead to the formation of several nanometer high macrosteps [112, 113] with faces perpendicular to either the \((0001)\) or \((11\bar {2}0)\) direction. The TEM image of the SiO2/SiC interface and the corresponding results from simulations are shown in Figure 2.24.
A TEM analysis of 4° off-axis \((0001)\) Si-face 4H-SiC with a 5 μm thick n-type epitaxial layer has been performed. The substrate has been first cleaned and then oxidized in dry ambient at 1050°C for 4 hours. In order to protect the SiO2 during lamella preparation, a 500 nm thick aluminium layer has been deposited on the oxide before the focused ion-beam treatment. The TEM lamella has been oriented along \((11\bar {2}0)\) direction, perpendicular to the step-flow of the epitaxial layer and taken from a region of the sample where isolated macrosteps were present. From the TEM image, the oxide thickness at the terrace and riser were determined to be 7 nm and 11 nm, respectively.
In parallel to the experimental investigation, the oxidation growth process has been simulated using the developed modeling approach and the Victory Process simulator. The results predict the oxide thickness at the terrace and riser to be 7.54 nm and 11.2 nm, respectively: These results are in good agreement, in particular at the riser (cf. Figure 2.24). Finally, the experimental results suggest that variations in the oxide thickness due to the surface morphology of off-axis 4H-SiC epilayers must be considered for a complete picture of the reliability-limiting factors of thermally grown oxides on SiC [110].