4.4 Atomic Layer Deposition of Al2O3 from TMA and Water
To validate the proposed reactive transport model and, furthermore, to extract chemical insight from its parameters, experimental topographies must be considered. As previously discussed, the ALD of
Al2O3 from H2O and TMA, represented in Eqs. (4.1) and (4.2), has emerged as a paradigmatic system due to its near-ideal chemical characteristics [142, 146]. Therefore, there are multiple experimental studies reported for this process.
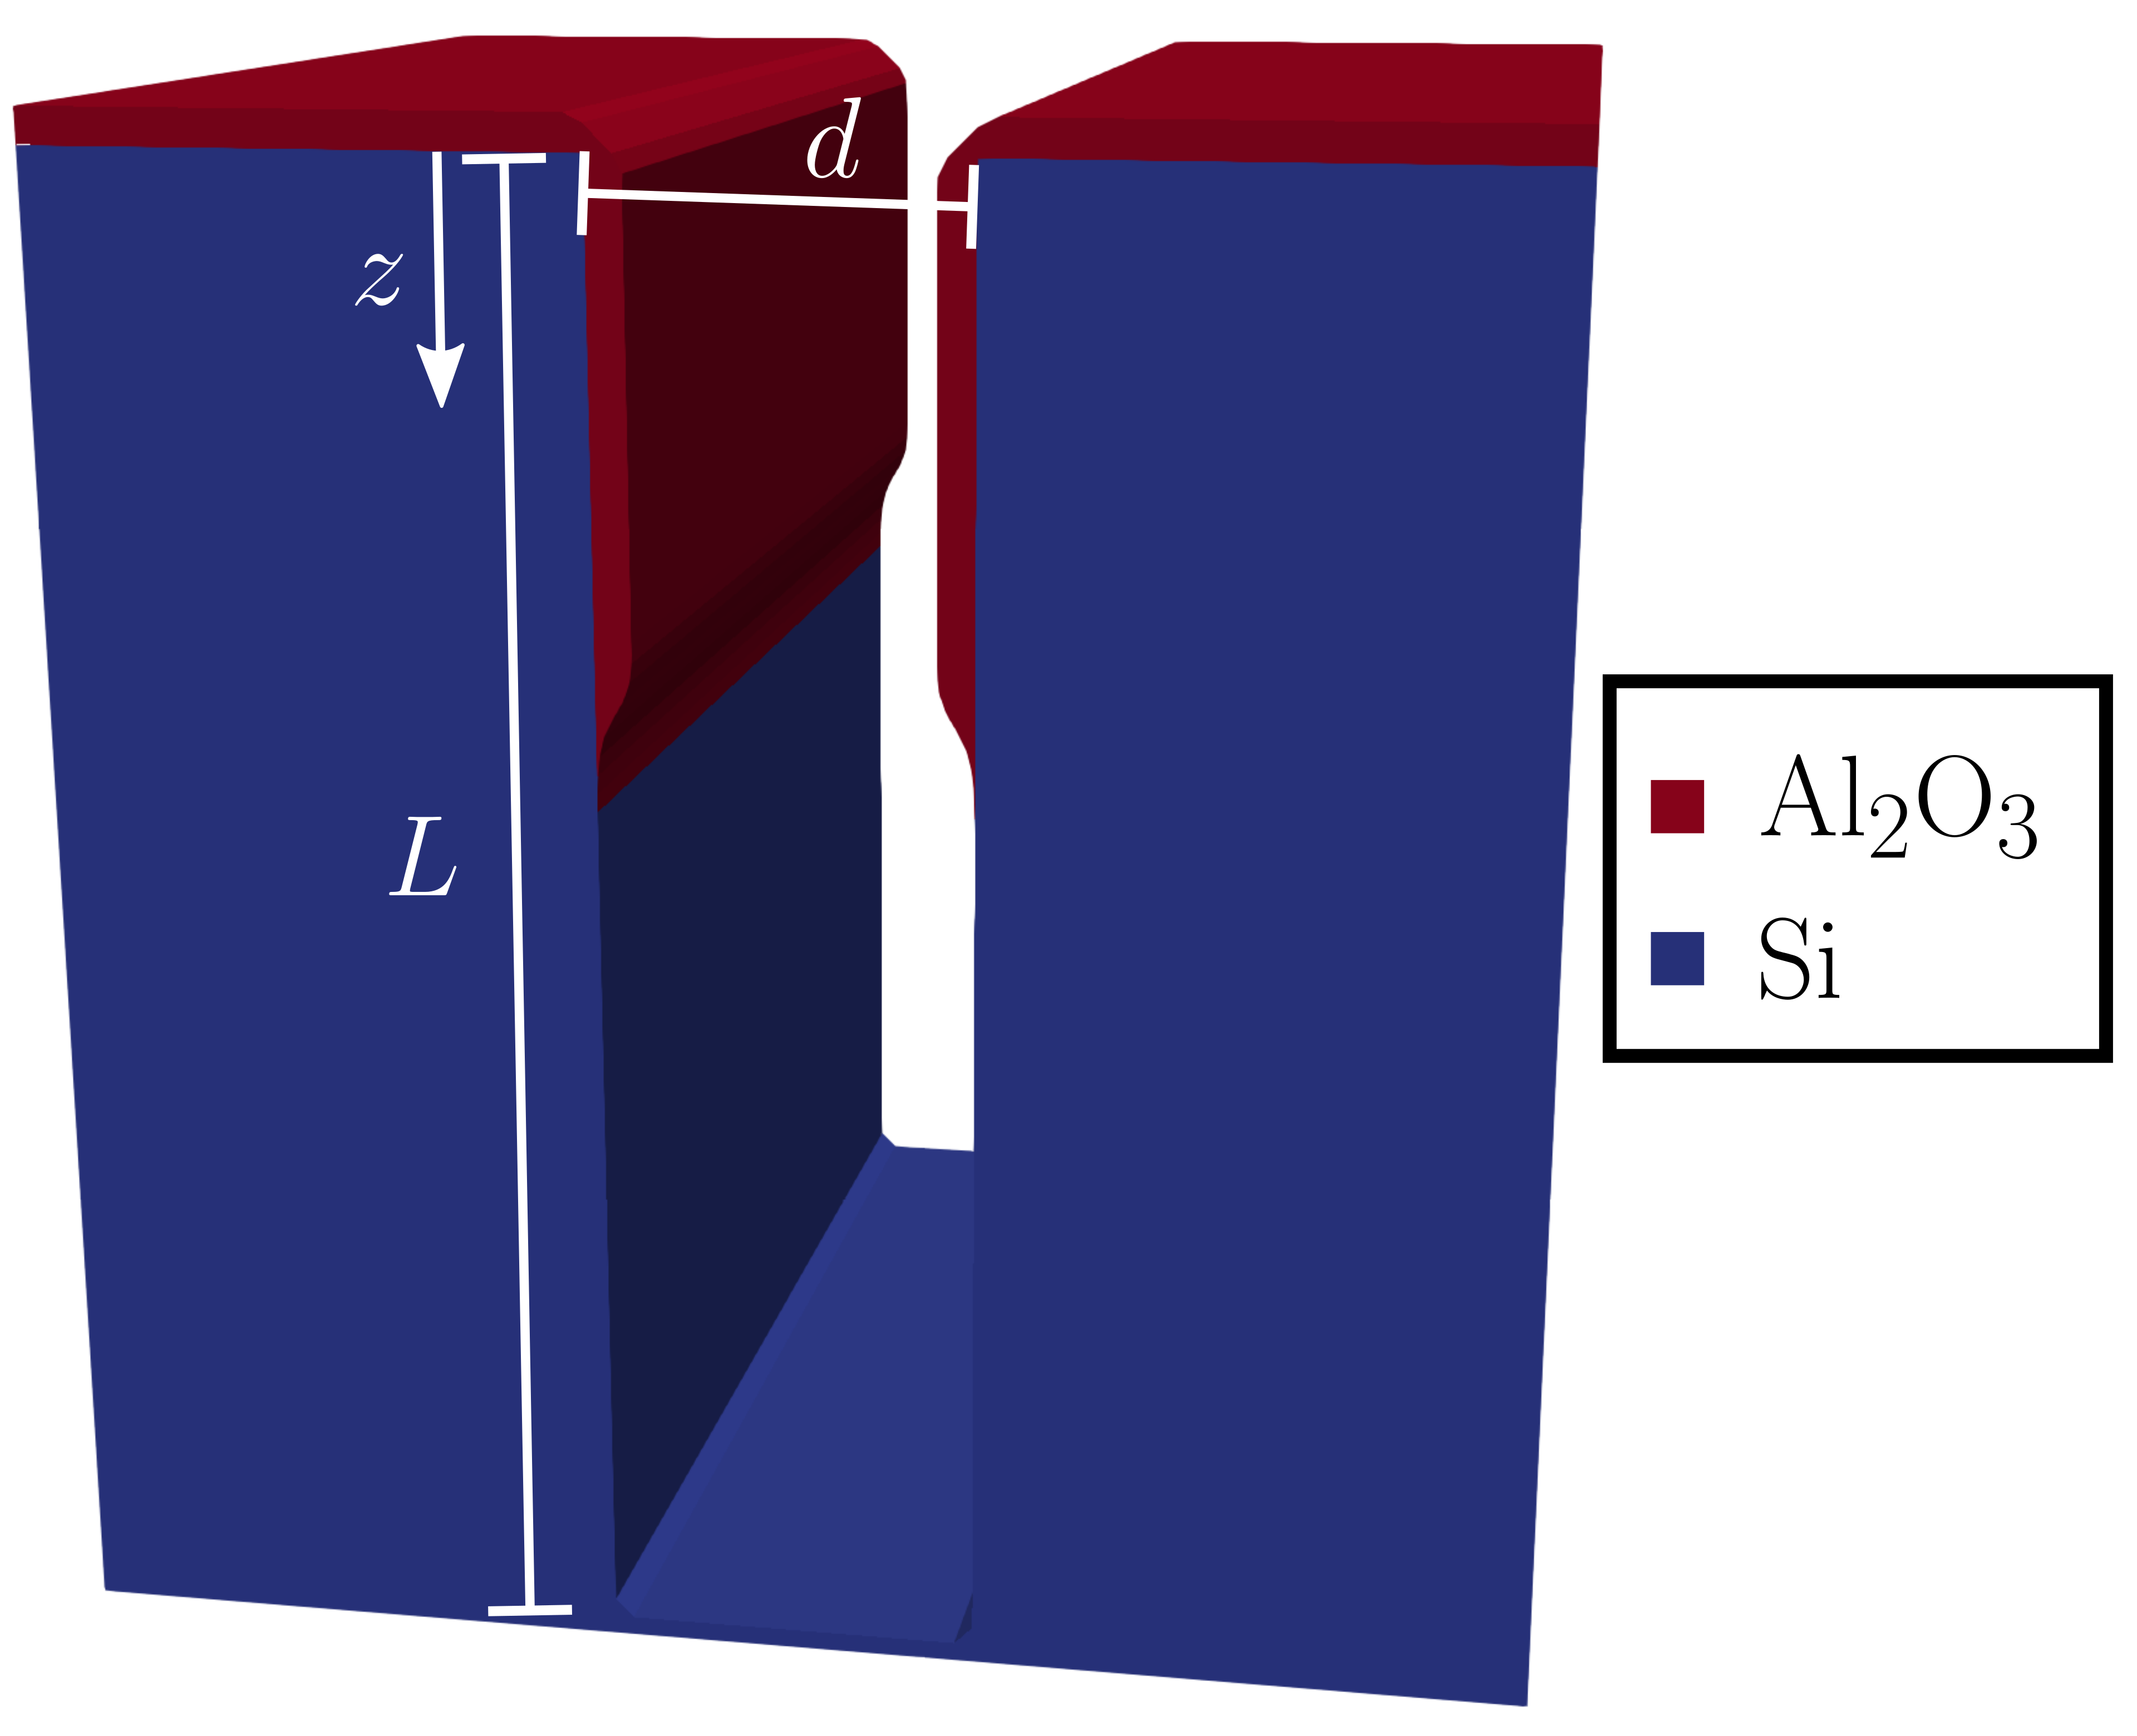
Ultimately, the goal is to simulate film deposition profiles in trenches, as illustrated in Fig. 4.4, and thus calibrate and analyze the model parameters with support from reported
experimental data.
In addition to the investigations of the surface chemistry of this ALD process [159], there has been increased attention in deliberately exploring the reactive transport in the transport-controlled regime. Gao et al.
developed a silicon (Si)-based lateral high AR structure tailored for film conformality analyses [160] which was quickly adopted by several research groups. By suspending a polycrystalline Si membrane over an array of pillars,
a lateral trench with very high AR is obtained. Since the involved transport processes are isotropic, this lateral cavity is equivalent to the vertical trench with initial opening \(d\) represented in Fig. 4.4. In addition, since this membrane can be peeled off using adhesive tape, the film thickness analyses can proceed with conventional optical profilometry instead of costly and complex
electron micrography.
The following Sections 4.4.1 and 4.4.2 compare the proposed model to reported experimental film thickness for the
H2O-limited [161] and TMA-limited [109, 161, 162] regimes, respectively, in similar lateral high AR trenches (\(d=\SI {0.5}{\micro \meter }\), except where noted, and \(L>\SI {1000}{\micro
\meter }\)). For each regime, the reactive transport is modeled with a single particle which is assumed to be the limiting chemical species. All relevant physical parameters are taken directly from the original publications.
However, some physical parameters are not reported, thus they are estimated as follows. For Arts et al. [161], the H2O pulse time is estimated to be \(\SI {0.1}{\second }\) and the TMA pulse time
to be \(\SI {0.4}{\second }\). In Ylilammi et al. [109], the unreported TMA partial pressure is estimated to be \(\SI {325}{\milli \torr }\). Finally, for Yim et al. [162] the TMA partial
pressure is assumed to be \(\SI {160}{\milli \torr }\). These assumptions are reasonable since they fall well within the range of possible values in the reported reactor conditions, as well as that they mostly impact the
experimentally reported penetration depth.
Only Knudsen diffusion is considered, except where otherwise indicated. To use the standard Knudsen diffusivity equation from Eq. (3.24) in Eq. (4.11), the simulated geometry must
be mapped to an equivalent long cylinder. To that end, the hydraulic diameter approximation from Eq. (3.33) is applied. However, from the
discussion in Section 3.3, it must be remarked that this approximation is not rigorously justified. Thus, the calibrations discussed in the following are only valid for similar
geometries and reactor conditions. Fortunately, even though the experimental results are obtained from several research groups, they all use very similar trenches and operate in similar vacuum conditions. Therefore, the use of the
hydraulic diameter approximation is justified.
4.4.1 Temperature dependence of the H2O step
Due to its inherent complexity, the metal-organic TMA has received more research attention. Also, its higher molar mass naturally causes a lower thermal speed and, therefore, it is usually the transport-limiting species. Recently,
however, Arts et al. reported an experiment to investigate the sticking probability of H2O using a simplified Knudsen diffusion method by deliberately engineering an H2O-limited
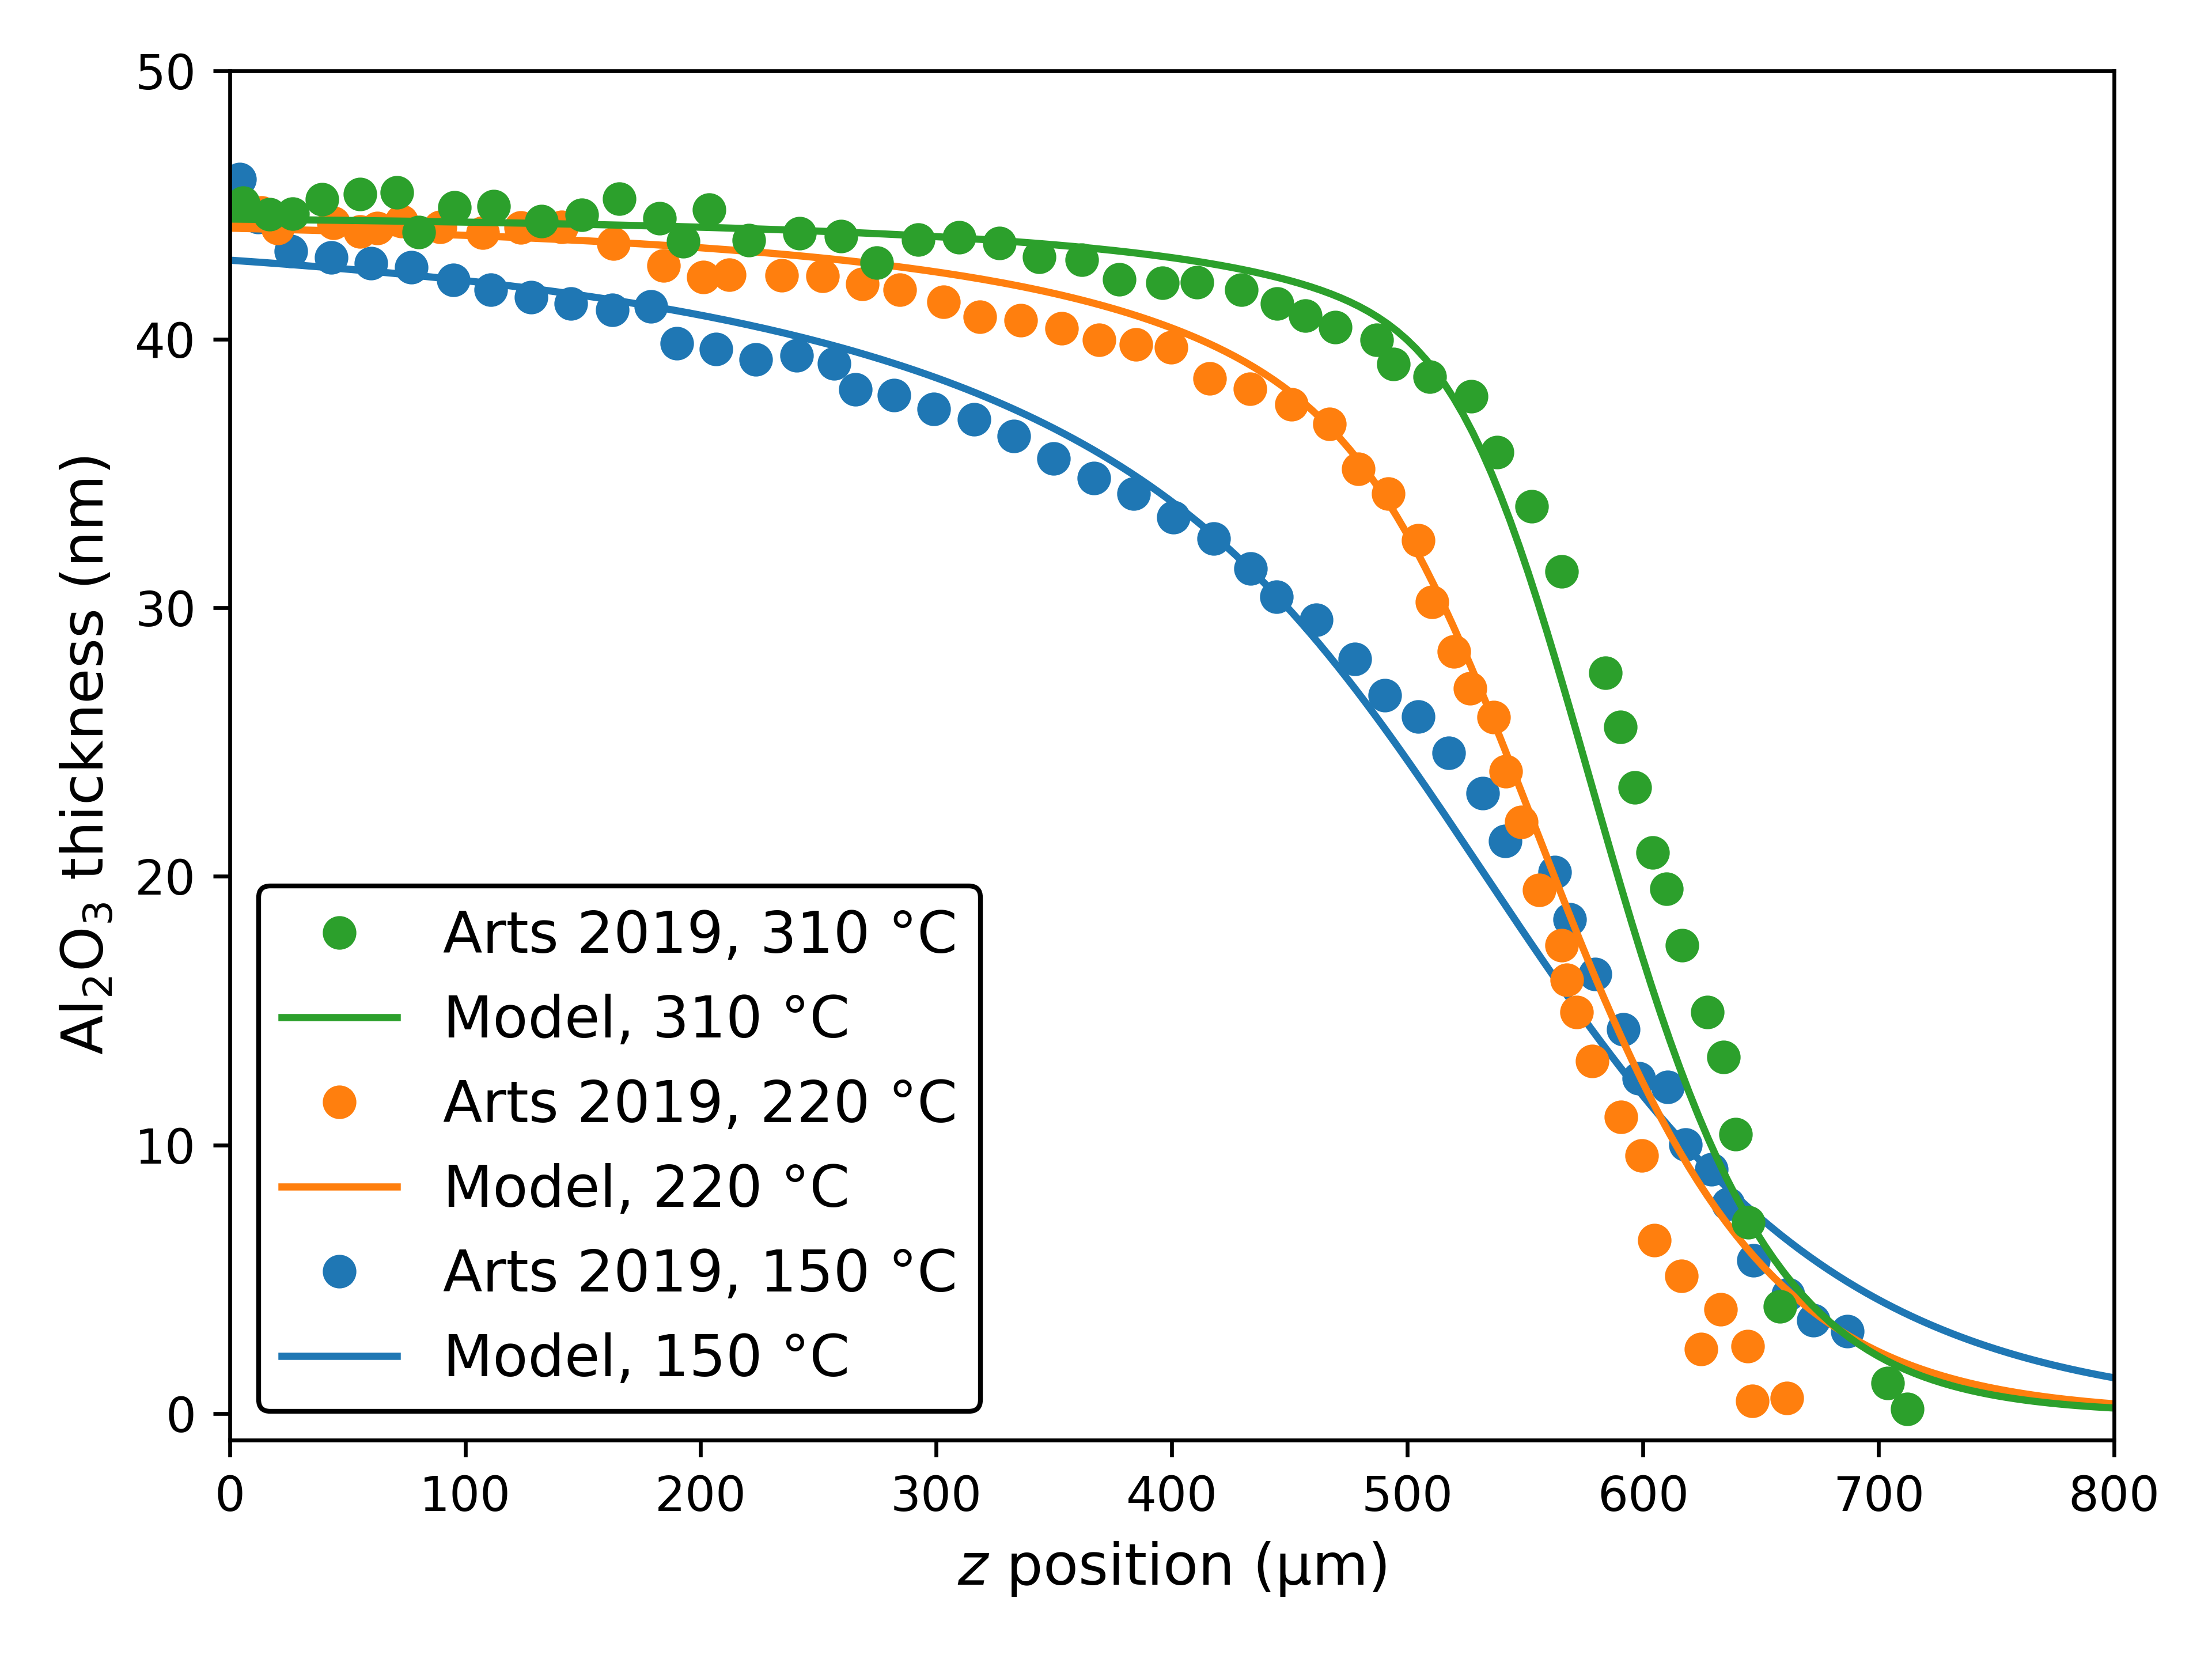
regime [161]. In addition to their estimates of \(\beta _0\), they also report different Al2O3 film thickness profiles for three calibrated substrate temperatures: \(\SI {150}{\celsius }\), \(\SI
{220}{\celsius }\), and \(\SI {310}{\celsius }\). These profiles are reproduced with the proposed reactive transport model integrated with LS based topography simulation, shown in Fig. 4.5. The calibrated parameters are manually obtained, and they are shown in Tab. 4.1.
The simulated thickness profiles from Fig. 4.5 show good agreement with experimental data. It is important to note that such agreement was not possible by assuming irreversible
reactions (i.e., \(\Gamma _\mathrm {ev}{=}0\)) which is strong evidence that reversibility plays a key role. The estimated values of \(\beta _0\) are generally consistent with those estimated in the original publication which is
expected since their methodology is also based on Knudsen diffusion and first-order Langmuir kinetics. However, their approach assumes irreversible reactions and only considers the slope of the thickness curve at \(50\%\) height.
This is likely the reason for the discrepancy for the value of \(\beta _0\) at \(\SI {150}{\celsius }\), since it is the configuration with a higher calibrated value of \(\Gamma _\mathrm {ev}\).
Table 4.1: Phenomenological model parameters for the H2O step of ALD of Al2O3 calibrated to reported experimental profiles by Arts et al. [161], including their estimates for
\(\beta _0\).
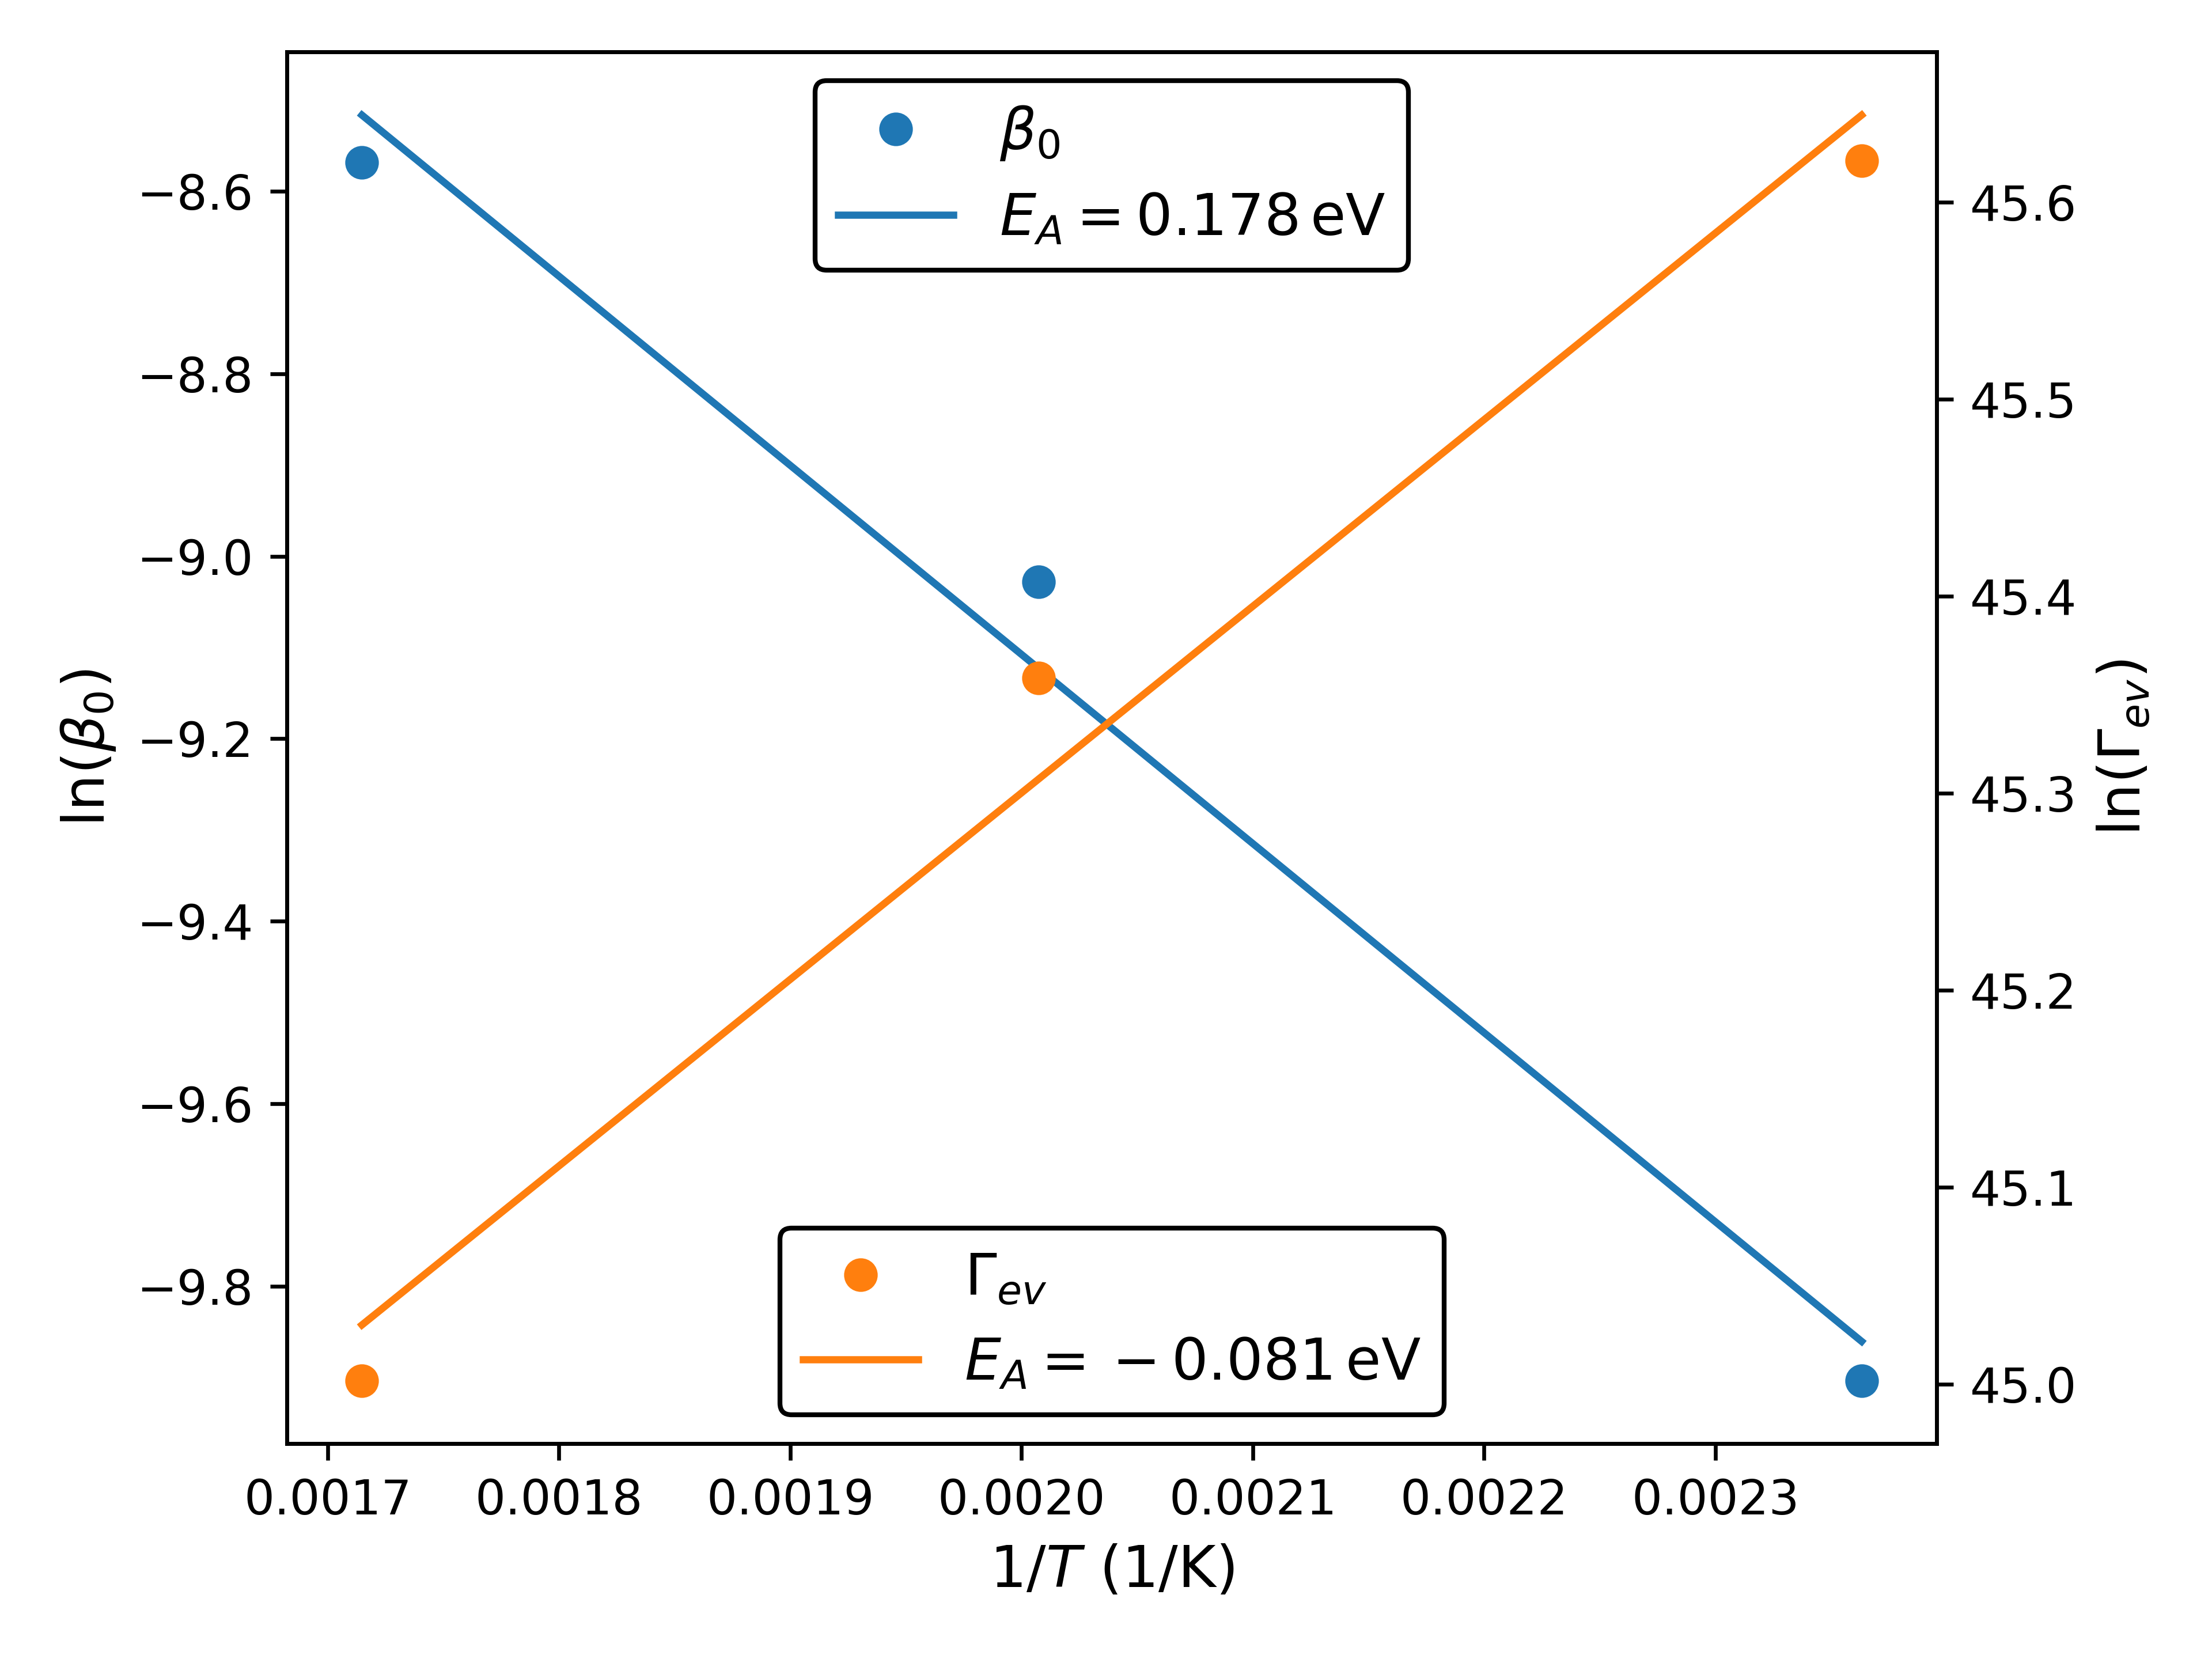
Since the parameters were extracted for three different temperatures, it is possible to perform an indicative Arrhenius analysis. This is present in Fig. 4.6, where the increase in
\(\beta _0\) and decrease of \(\Gamma _\mathrm {ev}\) with higher \(T\) is made clear. This is evidence that, as temperature increases, permanent adsorption becomes more thermodynamically favorable. In addition, the fitted
activation energy \(E_A = \SI {0.178}{\electronvolt }\) of \(\beta _0\) can be interpreted as the reaction activation energy for a pristine surface. The fitted value is lower than what is suggested by first-principle
studies [163], however, it is consistent with recent experimental studies. Sperling et al. report an experimental analysis using in situ infrared spectroscopy, extracting an activation energy of \(\SI
[separate-uncertainty = true]{0.166 \pm 0.020}{\electronvolt }\) for a two-stage reaction [159].
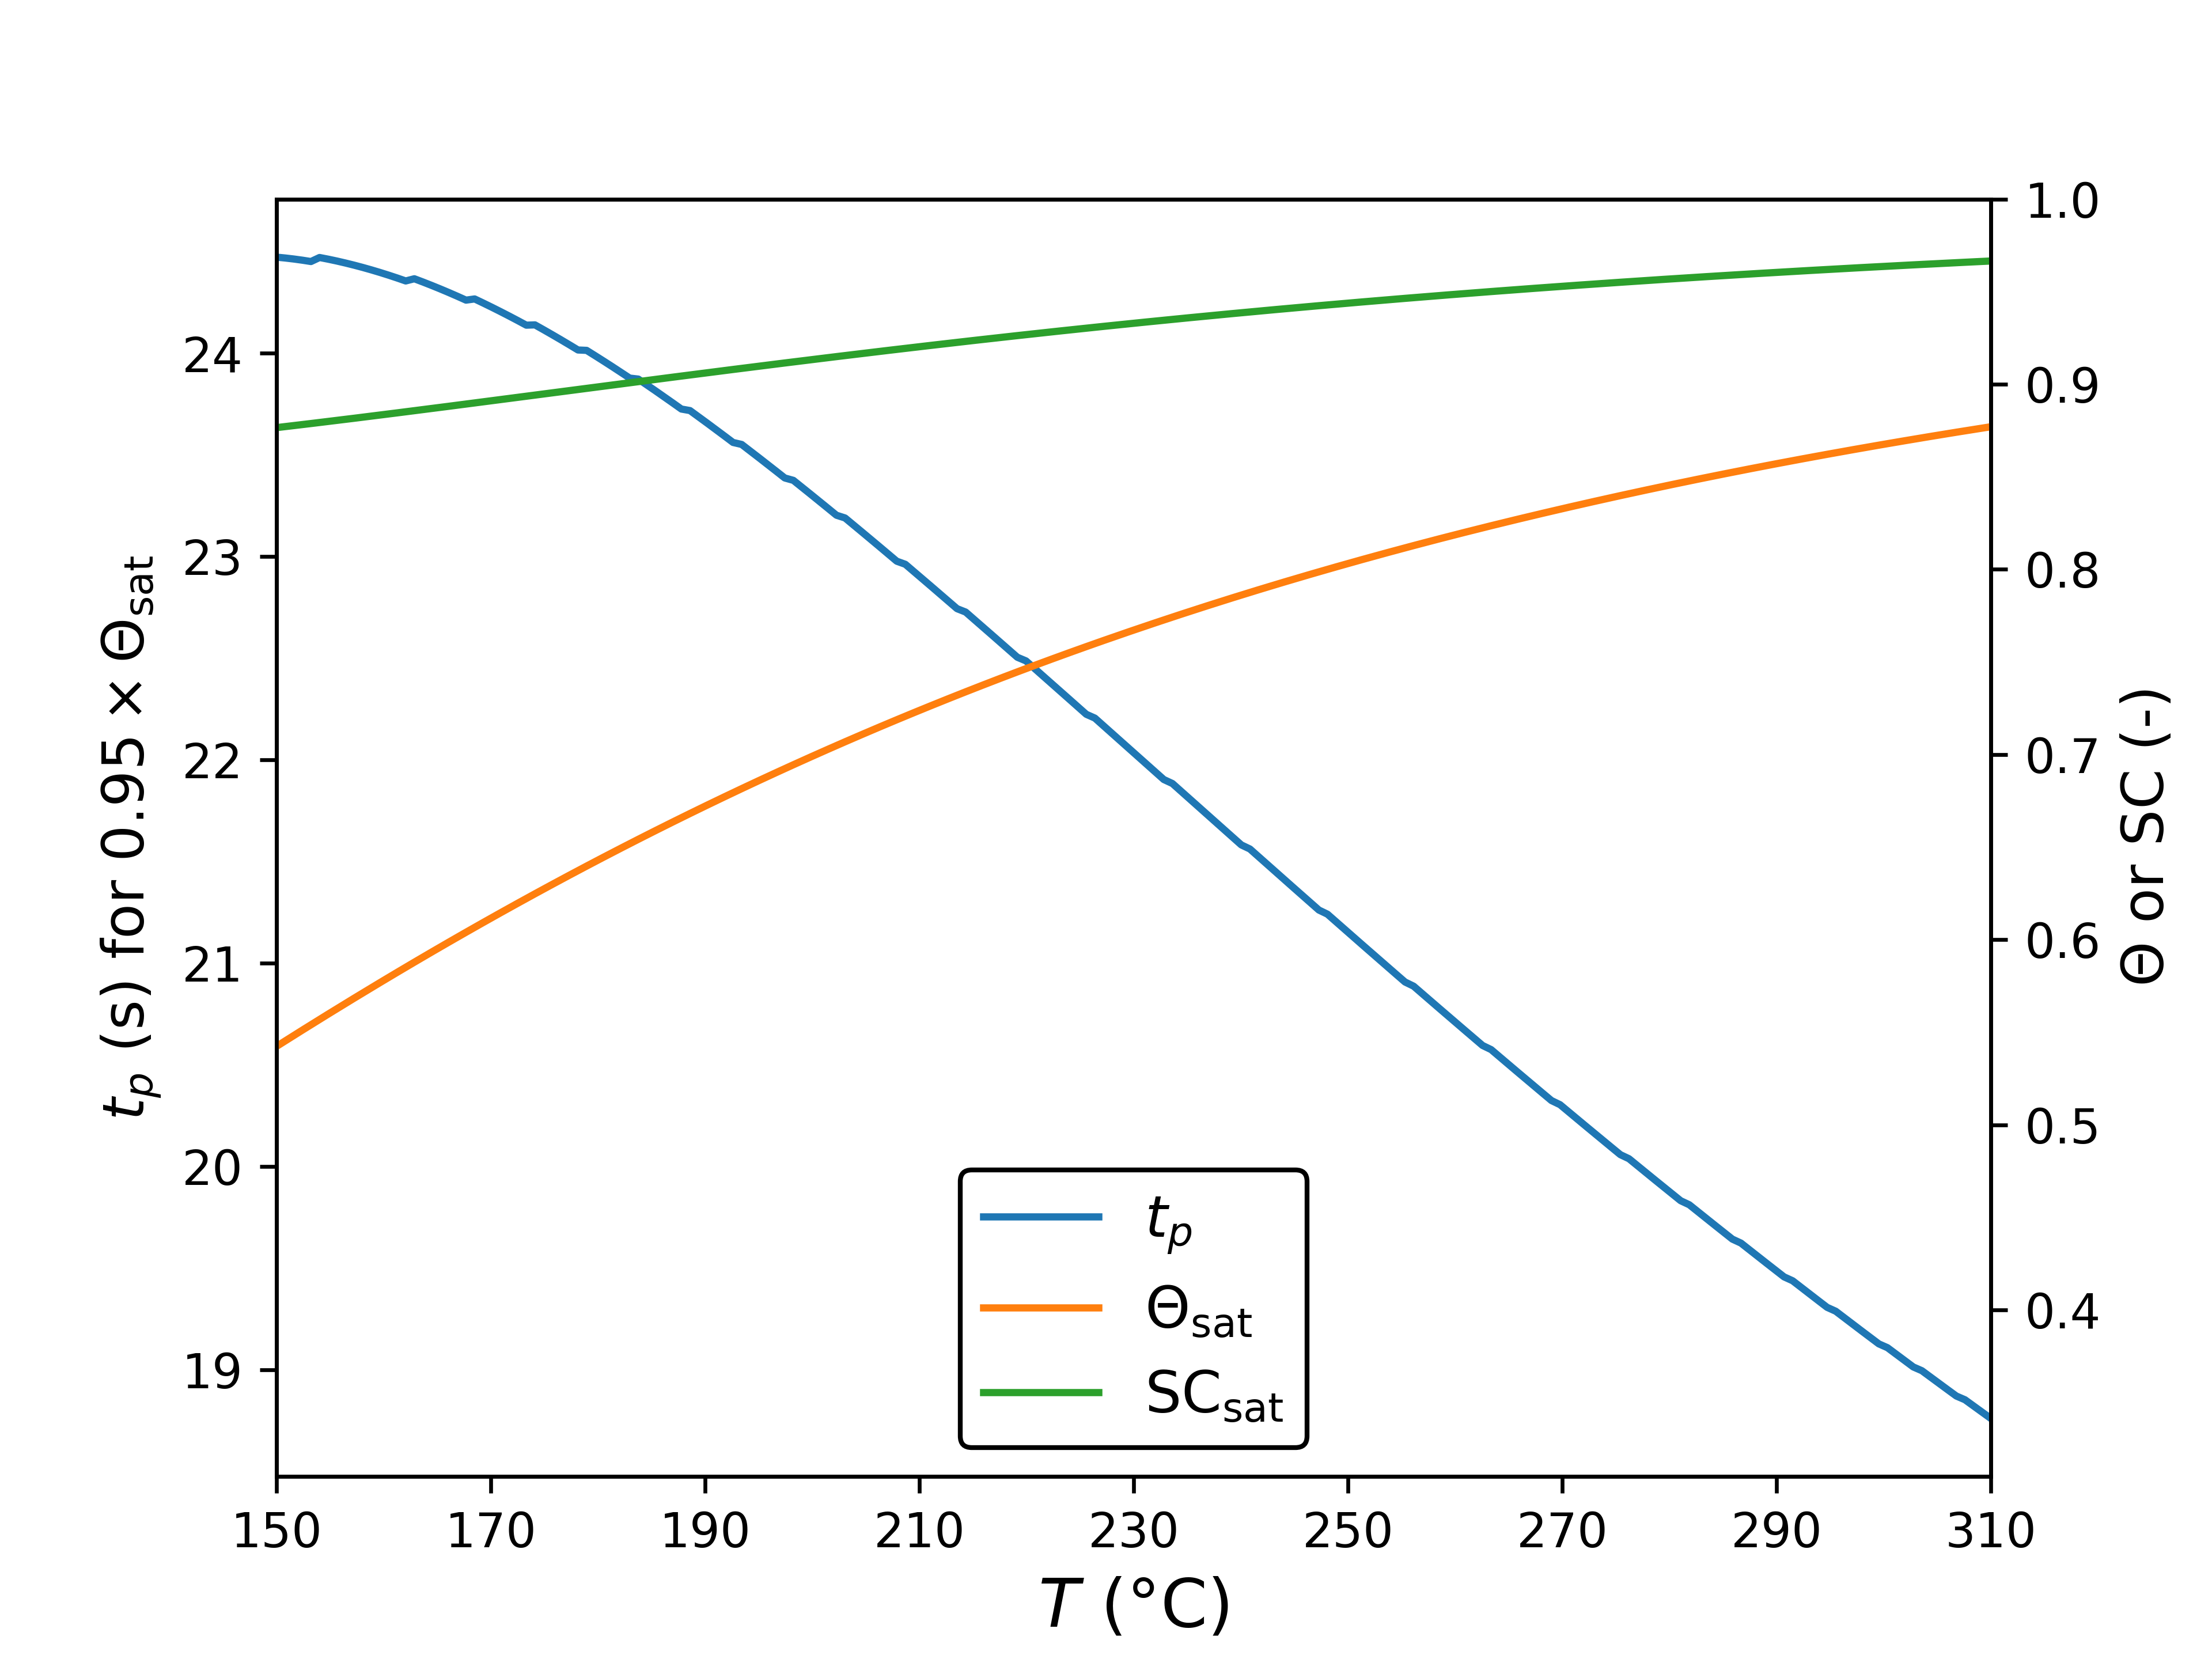
Having obtained an Arrhenius expression of the form \(Ae^{\frac {-E_A}{k_BT}}\) for both model parameters, they can now be expressed in terms of a single physical variable: \(T\). Therefore, the parameter analysis from
Fig. 4.3 reduces from three to two dimensions which is shown in Fig. 4.7. As expected from a more
thermodynamically favored reaction, the \(\Theta _\mathrm {sat}\) increases and the required \(t_p\) to reach \(95\,\%\) of \(\Theta _\mathrm {sat}\) decreases with temperature. In practice, however, \(\Theta _\mathrm
{sat}\) is not always experimentally accessible. Alternatively, the step coverage \(\mathrm {SC}\), defined as the ratio of film thickness at \(z{=}L\) to that of a fully exposed plane, is commonly measured.
The proposed reactive transport model enables the estimation of the saturation step coverage from the steady-state limit of Eq. (4.5) as
\(\seteqnumber{0}{4.}{15}\)
\begin{align}
\label {eq::saturation_SC} \mathrm {SC_{sat}} = \frac {\Theta _\mathrm {sat}(z=0)}{\Theta _\mathrm {sat}(z=L)}\, .
\end{align}
This quantity is also calculated in Fig. 4.7 and, interestingly, it is almost constant and near unity through the entire \(T\) range. This is an indication that, even
though low temperatures enable conformal films according to the \(\mathrm {SC}\) metric, the film quality might be low. The low \(\Theta _\mathrm {sat}\) is an indication of possible defects such as voids and vacancies which
is supported by the experimental observation that film deposited at lower temperatures require more energy to crystallize [164].
4.4.2 Geometric analysis of the TMA step
As previously indicated, the TMA step has received more research attention, therefore, multiple research groups report TMA-limited Al2O3 profiles using similar lateral high AR
structures [109, 161, 162]. However, as shown in Fig. 4.7, film quality tends to increase with temperature, therefore, the TMA-limited studies all fall in a
restricted reactor temperature range (\(\SI {275}{\celsius }\) for [161] and \(\SI {300}{\celsius }\) for [109, 162]). These temperatures are all near the upper stability limit of TMA of \(\approx \SI {300}{\celsius
}\) [146]. Thus, to investigate the robustness of the model parameters with respect to reactor temperature, all reported profiles are reproduced with the same parameters which are shown in Tab. 4.2. The comparison of the experimental profiles to simulation is given in Fig. 4.8.
The original publications provide their own estimates of \(\beta _0\), also condensed in Tab. 4.2. The reported values are broadly consistent with the estimate using the proposed
reactive transport model which is expected since all methods consider similar diffusive transport processes. However, both Arts et al. [161] and Yim et al. [162] assume irreversible reactions, whereas
Ylilammi et al. consider reversible kinetics albeit with a different calculation methodology for the Knudsen diffusive process [109, 165]. This leads to Ylilammi et al. achieving the more similar estimate of
\(\beta _0\).
Table 4.2: Calibrated phenomenological model parameters for the TMA step of ALD of Al2O3 to multiple reported experimental profiles [109, 161, 162], including the estimates of \(\beta _0\) from
the original publications.
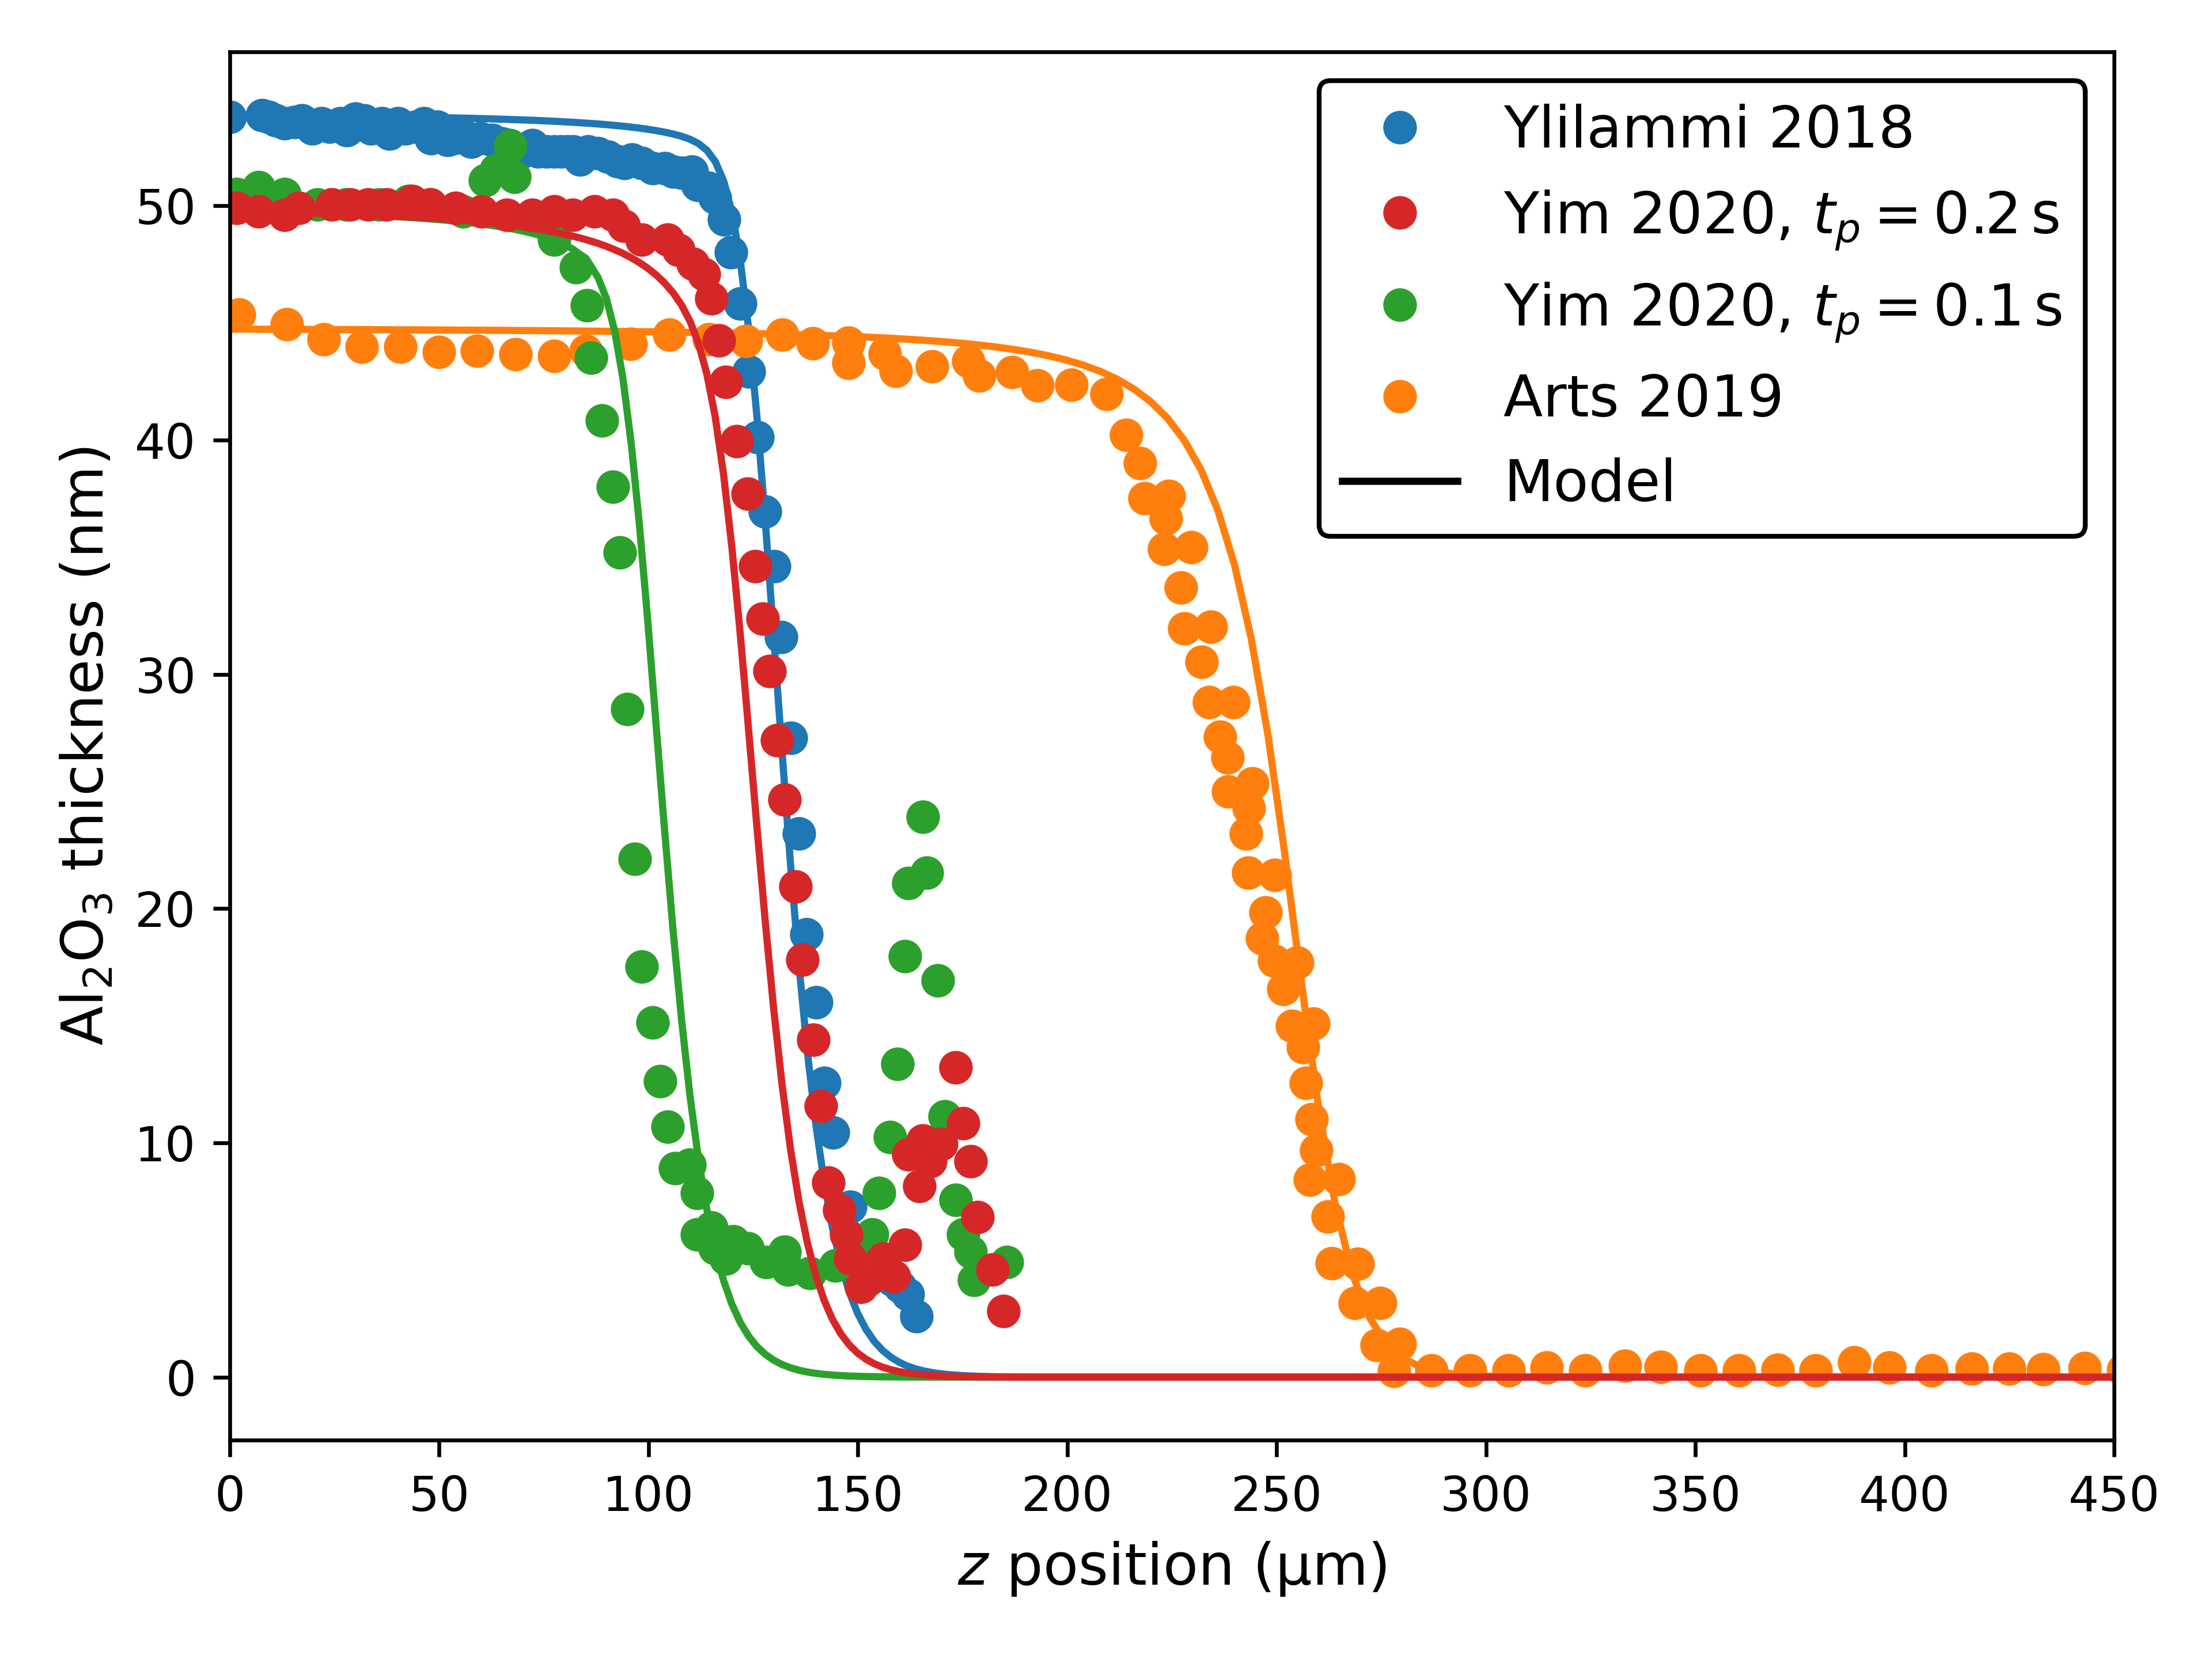
Figure 4.8 shows that a single parameter set is sufficient to adequately simulate the experimental profiles obtained from separate research groups using different ALD reactors. This
strongly supports the hypothesis that not only the phenomenological model adequately captures the most relevant chemical aspects, but also that the model parameters are fixed by the chemical and reactor conditions, most
importantly the reactor \(T\). Furthermore, the larger deviation with respect to the simulation is that for the profile reported by Arts et al. [161] which was obtained using a slightly lower reactor temperature of
\(\SI {275}{\celsius }\). This indicates that a similar temperature dependence of \(\beta _0\) could be present, however, more data would be required to evaluate this claim. The secondary peaks in the experimental data
from Yim et al. are reported to be spurious interactions of the measurement technique with the remaining sustaining pillars [162] and are, therefore, disregarded.
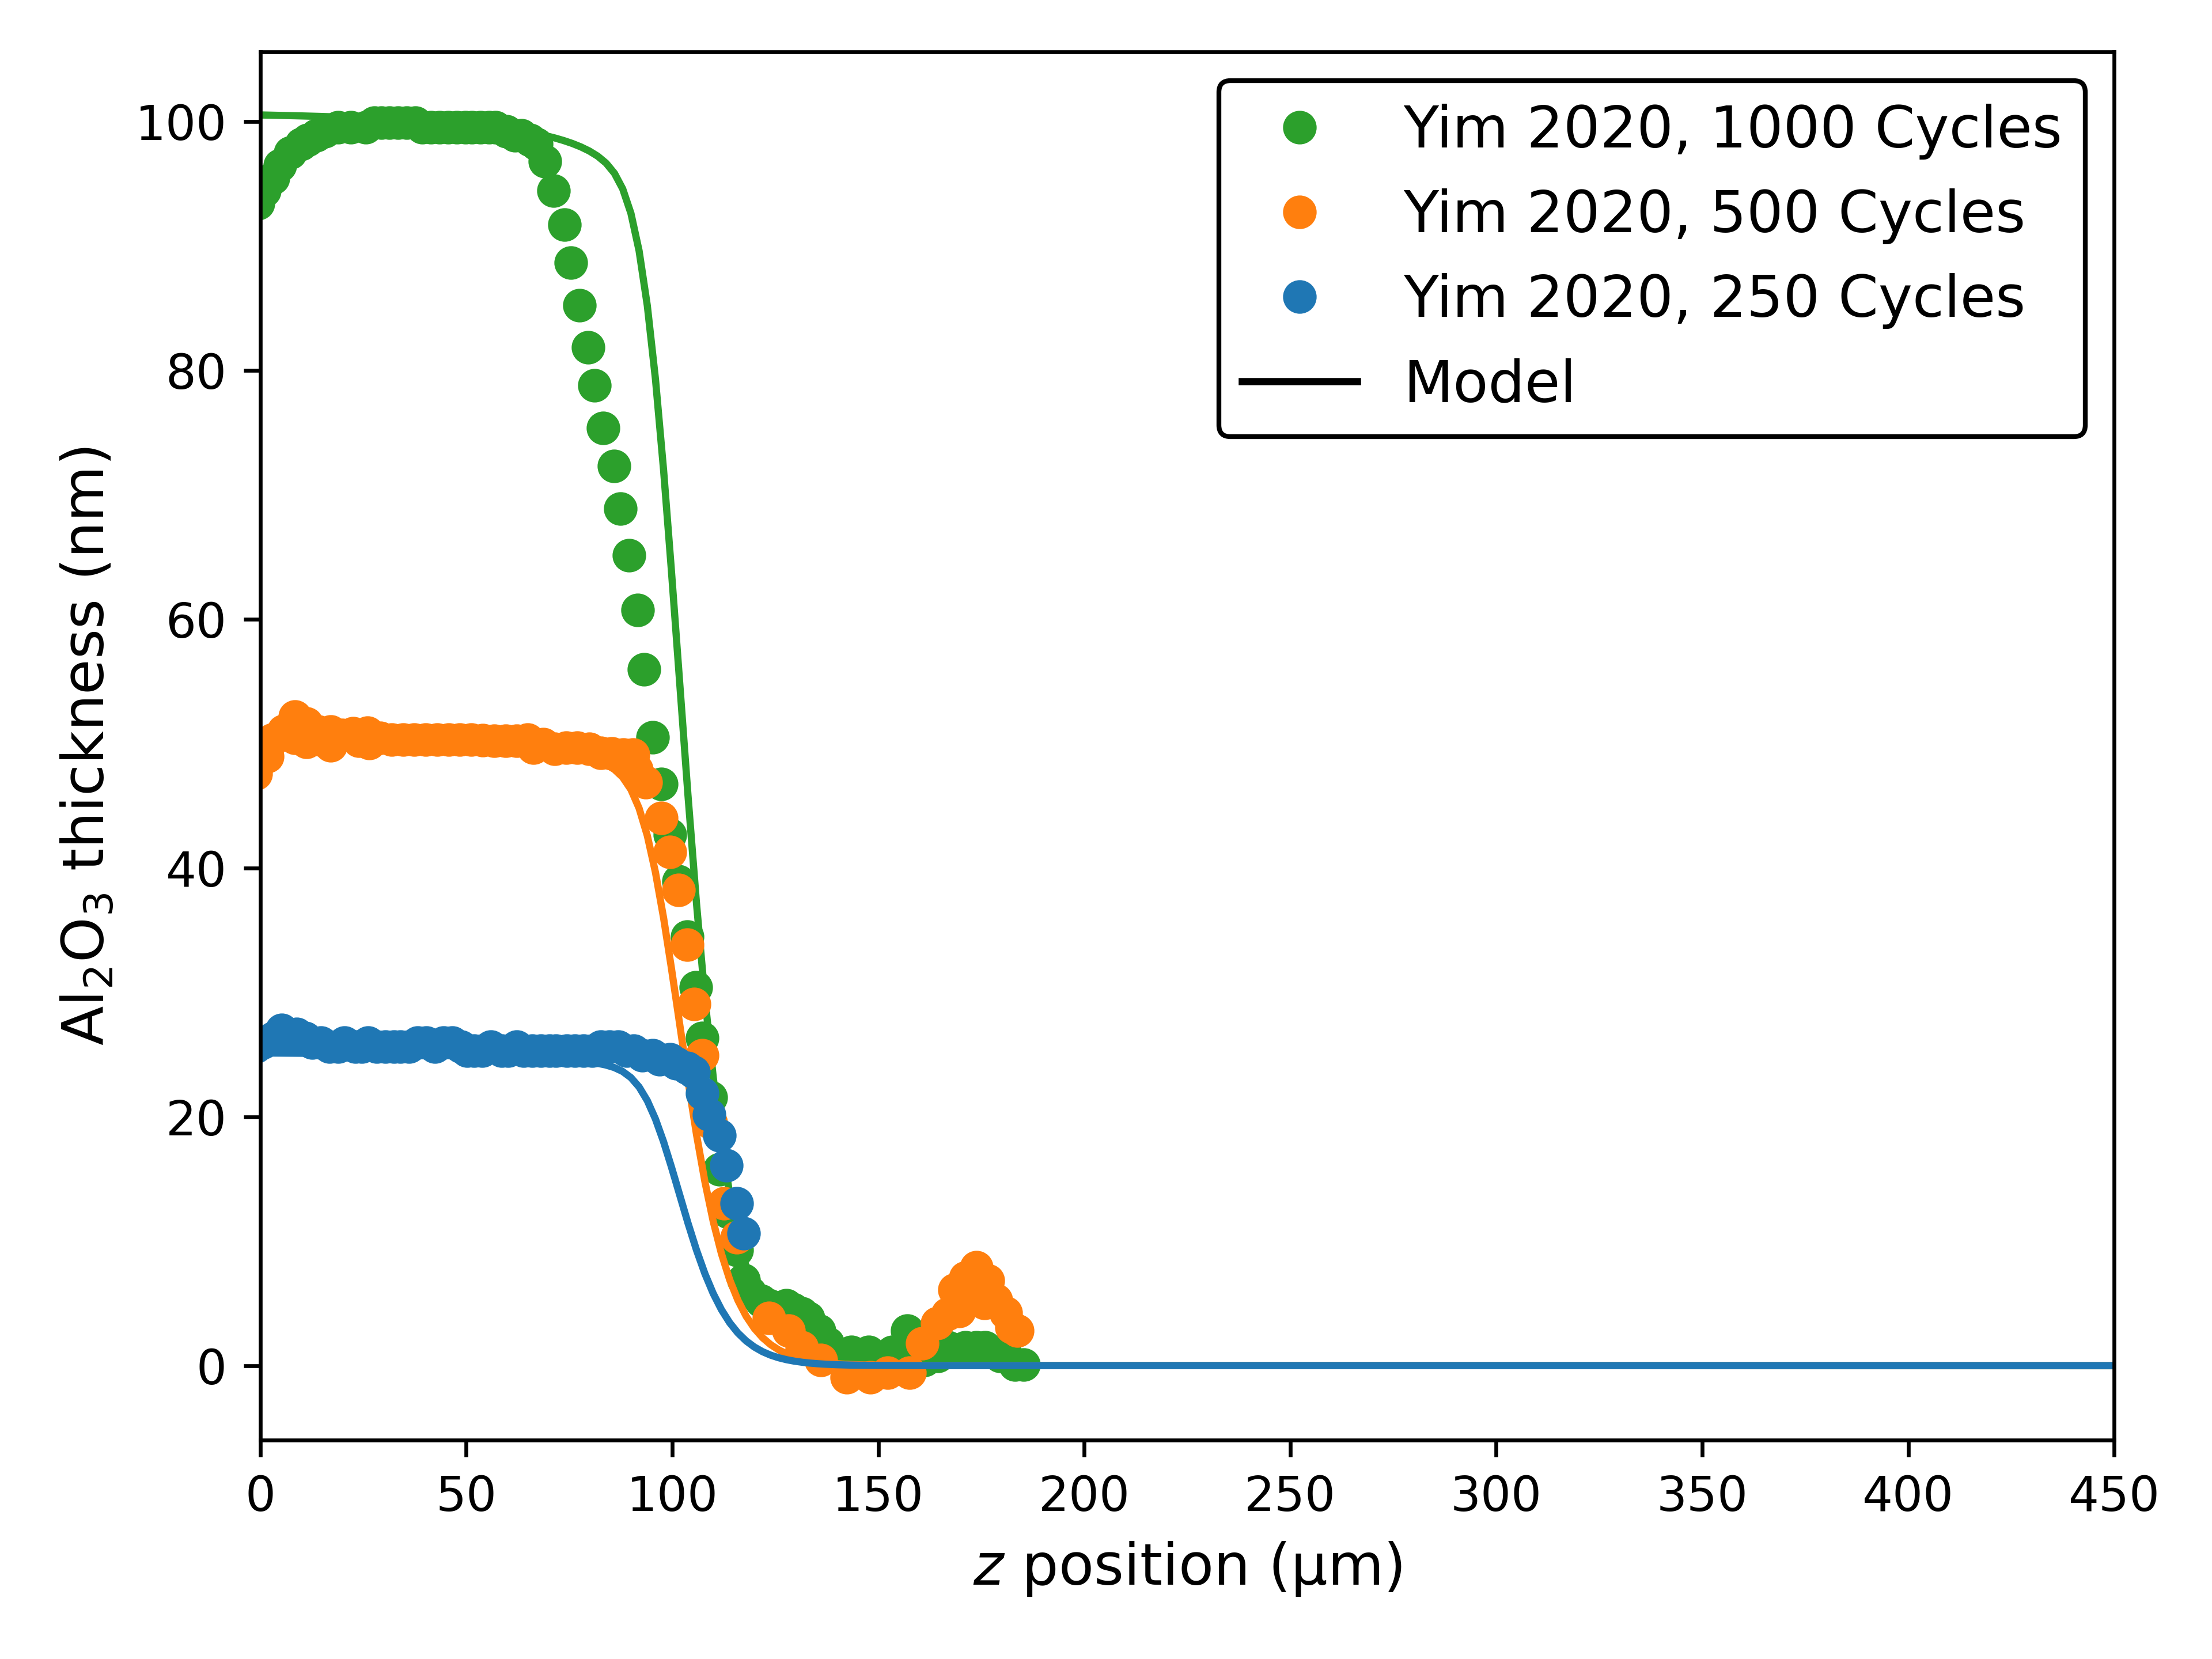
Yim et al. report additional experiments where the \(N_\mathrm {cycles}\) is varied between \(250\) and \(1000\) cycles. The simulated geometries, obtained with the same parameters from Tab. 4.2, are compared to the experimental profile in Fig. 4.9. The lowest number of cycles shows good qualitative agreement. The
penetration depth is slightly underestimated which could simply indicate that the estimate for the partial pressure should be adjusted. However, for \(N_\mathrm {cycles} = 1000\) the disagreement is more pronounced also in
the profile slope.
This is likely due to the lateral structure being over \(40\,\%\) constricted in this case, since the same \(\SI {100}{\nano \meter }\) growth also occurs on the removed membrane. Therefore, the approximation that the entire
geometry can be modeled by a single representative trench width \(d\) fails. Additionally, this severe constriction changes the Knudsen number which, as discussed for Eq. (3.40), affects the validity of the hydraulic diameter approximation.
Figure 4.9: Comparison of deposited Al2O3 film thickness profiles with varying number of ALD cycles reported by Yim et al. [162] to simulations using the parameters from Tab. 4.2.
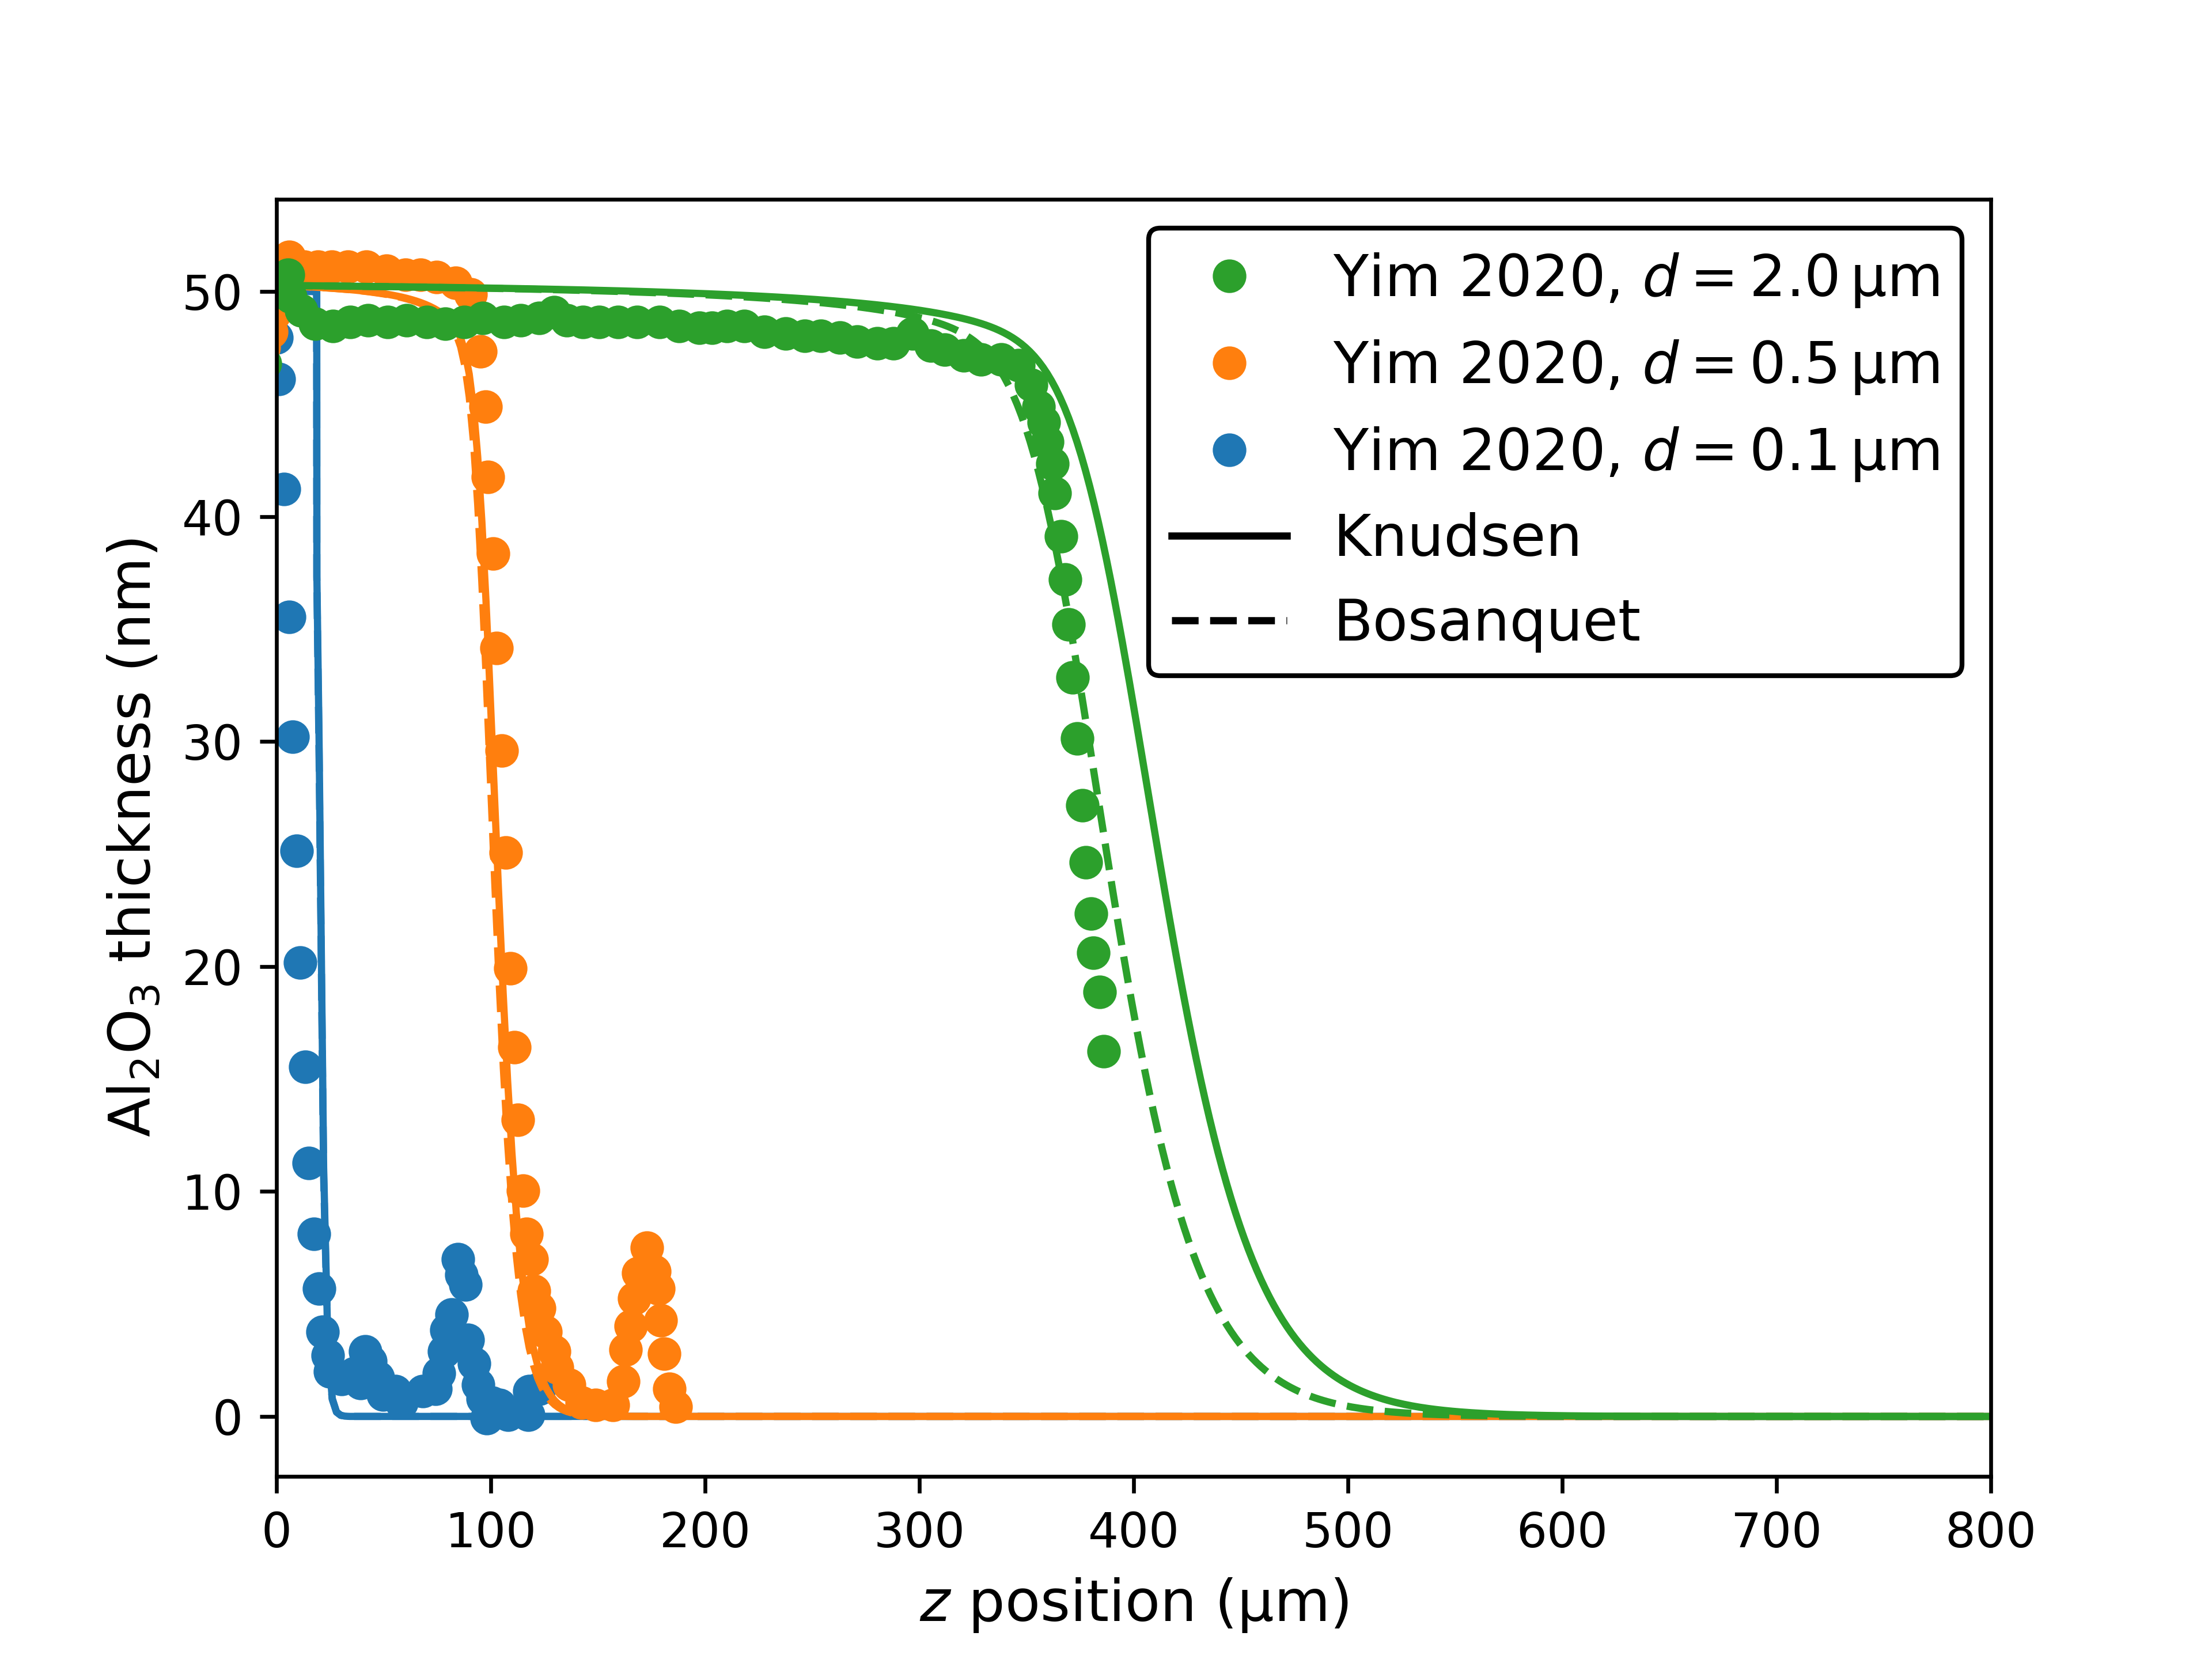
Additionally, Yim et al. report profiles obtained with lateral high AR structures with different trench openings [162]. These trenches are simulated with the parameters from Tab. 4.2 and shown in Fig. 4.10 with the label "Knudsen". The simulation shows good agreement for the trench with \(d=\SI {0.5}{\micro
\meter }\), however, the trench with \(d=\SI {0.1}{\micro \meter }\) shows a slight deviation. This is due to the trench becoming completely constricted, similarly to the discussion for Fig. 4.9.
The simulation for the largest trench with \(d=\SI {2.0}{\micro \meter }\) also deviates from the experimental data. As the width increases, the Knudsen number decreases according to Eq. (2.6), and is estimated to be \(\mathrm {Kn} \approx 8.9\) in this case. Therefore, the flow is in the transitional regime and the impact of molecule-molecule collisions cannot
be disregarded. To improve accuracy, the Bosanquet interpolation formula [116] from Eq. (3.44) is applied, with \(D_\mathrm {gas}\) calculated
from Chapman-Enskog diffusivity [120] using the hard-sphere molecule diameters [109] \(d_\mathrm {TMA} = \SI {591}{\pico \meter }\) for TMA and \(d_\mathrm {N_2} = \SI {374}{\pico \meter }\) for
nitrogen gas (N2), the carrier gas. The simulation with improved accuracy is also shown in Fig. 4.10 with label "Bosanquet".