As previously indicated, 3D simulations are necessary to differentiate between cylindrical holes and rectangular trenches. Since they have the same cross-section, they are identical from the point of view of a 2D model, even though
they might have substantially different particle fluxes distributions. Section 3.3 discusses this challenge in the context of Knudsen transport, highlighting that problems can arise
if the mapping between trenches and cylinders is performed haphazardly. However, the top-down approach on a 3D simulation domain, shown in Section 5.2 to be the most
suitable for low-bias SF6 plasma etching of Si, handles this issue natively. While cylindrical holes can be directly simulated, long rectangular trenches require restricting the simulation domain to small lateral section
and applying reflective boundary conditions to obtain an infinite trench.
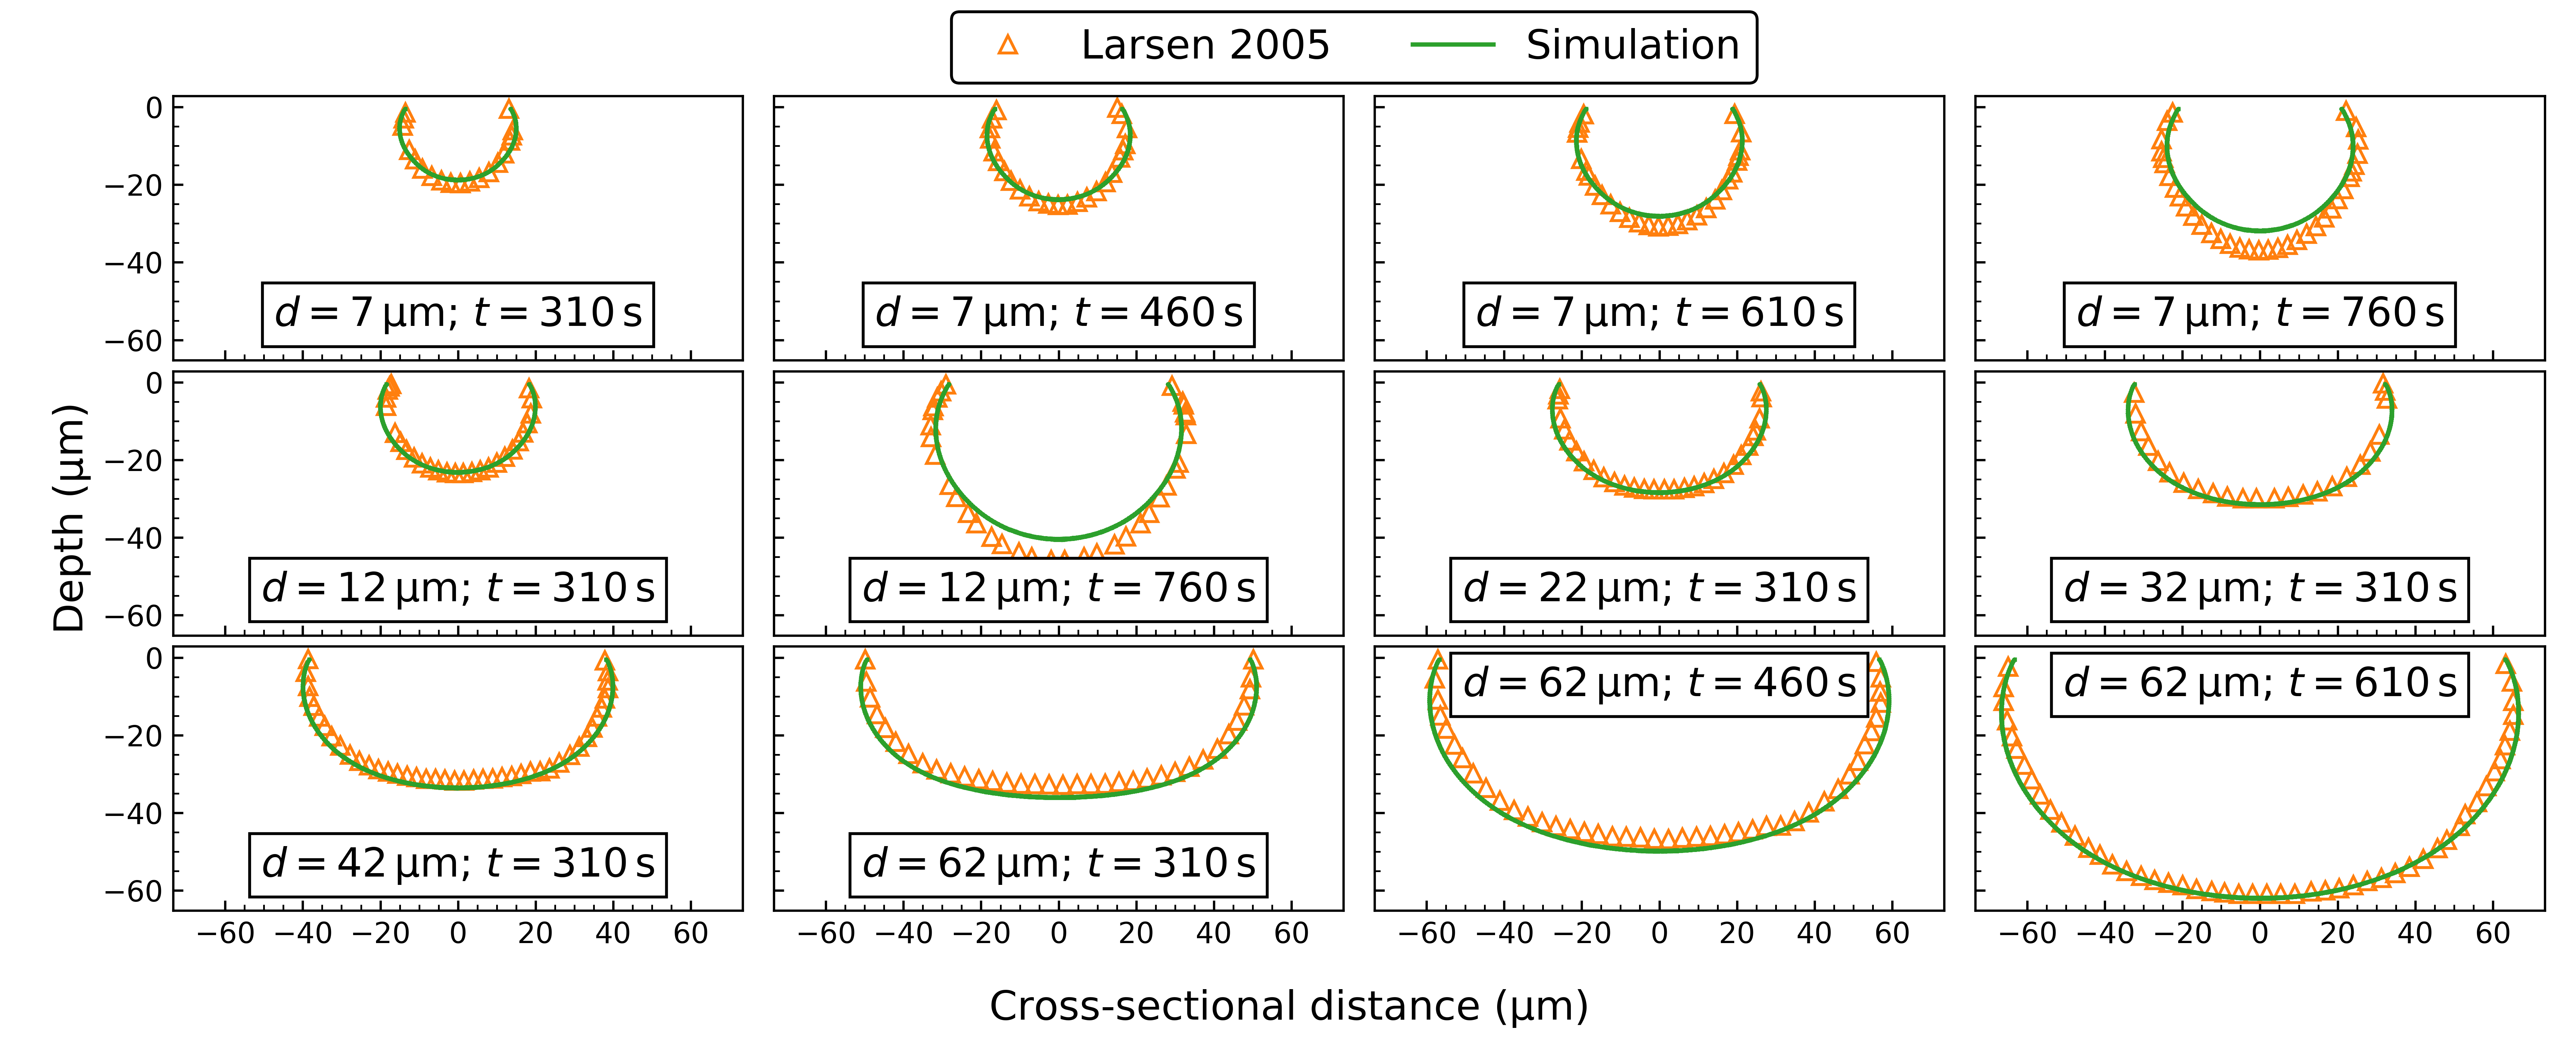
Therefore, the same 3D top-down approach, first evaluated for a cavity with cylindrical symmetry, can be applied to etched trenches reported in the literature. In their seminal work proposing two-step low-bias SF6
etching of Si in the context of microlens fabrication, Larsen et al. report scanning electron micrography (SEM) characterizations of multiple trenches after the first, masked, etch step [49]. These trenches were
obtained using different initial photoresist openings (\(d\)) and etch times (\(t\)), as the original intent was to thoroughly describe the first etch step. The employed reactor conditions are given in Tab. 5.1. The etching on the trenches is simulated starting from an initial geometry consisting of the reported photoresist height (\(\SI {1.5}{\micro \meter }\)) and opening \(d\) over a
Si slab of \(\SI {140}{\micro \meter }\times \SI {40}{\micro \meter }\) and reflective boundary conditions. All trenches are simulated with the same parameter set, shown in Tab. 5.5, obtaining the cross-sectional fits in Fig. 5.4.
Figure 5.4 shows excellent agreement between the simulation and the experimental data for trenches with \(t < \SI {610}{\second }\). The likely source of the
discrepancy for larger etch times is the reported photoresist bending in those scenarios [49]. Effectively, the photoresist opening is increased by approximately \(\SI {1}{\micro \meter }\) which is not captured by the
simulation thus leading to a slight underestimation of the etch rates. This is supported by this discrepancy being smaller for the trench with \(d=\SI {62}{\micro \meter }\), since the effective increase in the opening is small in
comparison to \(d\). Nonetheless, the remarkable agreement for widely different trenches and etch times strongly support the top-down approach for this process.
.
Parameter
Calibrated value
\(\mathit {PWR}_{\mathrm {Si}}\)
\(\SI {7.80}{\micro \meter \per \minute }\)
\(\mathit {PWR}_{\mathrm {resist}}\)
\(\SI {0.00}{\micro \meter \per \minute }\)
\(\beta _{\mathrm {Si}}\)
\(35\,\%\)
\(\beta _{\mathrm {resist}}\)
\(6.1\,\%\)
Table 5.5: Top-down model parameters manually calibrated to etched trench SEM profiles reported by Larsen et al. [49].
This is further supported by calibrating the simulation to trenches characteristics reported by Panduranga et al. [171]. Other than the different hardmask initial opening geometry, the experimental configuration is
the same as that reported for the high loading regime in Section 5.3 and Tab. 5.1. The simulations are performed using the same
parameter set for all reported trenches with different initial hardmask openings \(d\). The hardmask height (\(\SI {0.39}{\micro \meter }\)) is considered, as well as reflective boundary conditions to capture an infinite trench
geometry.
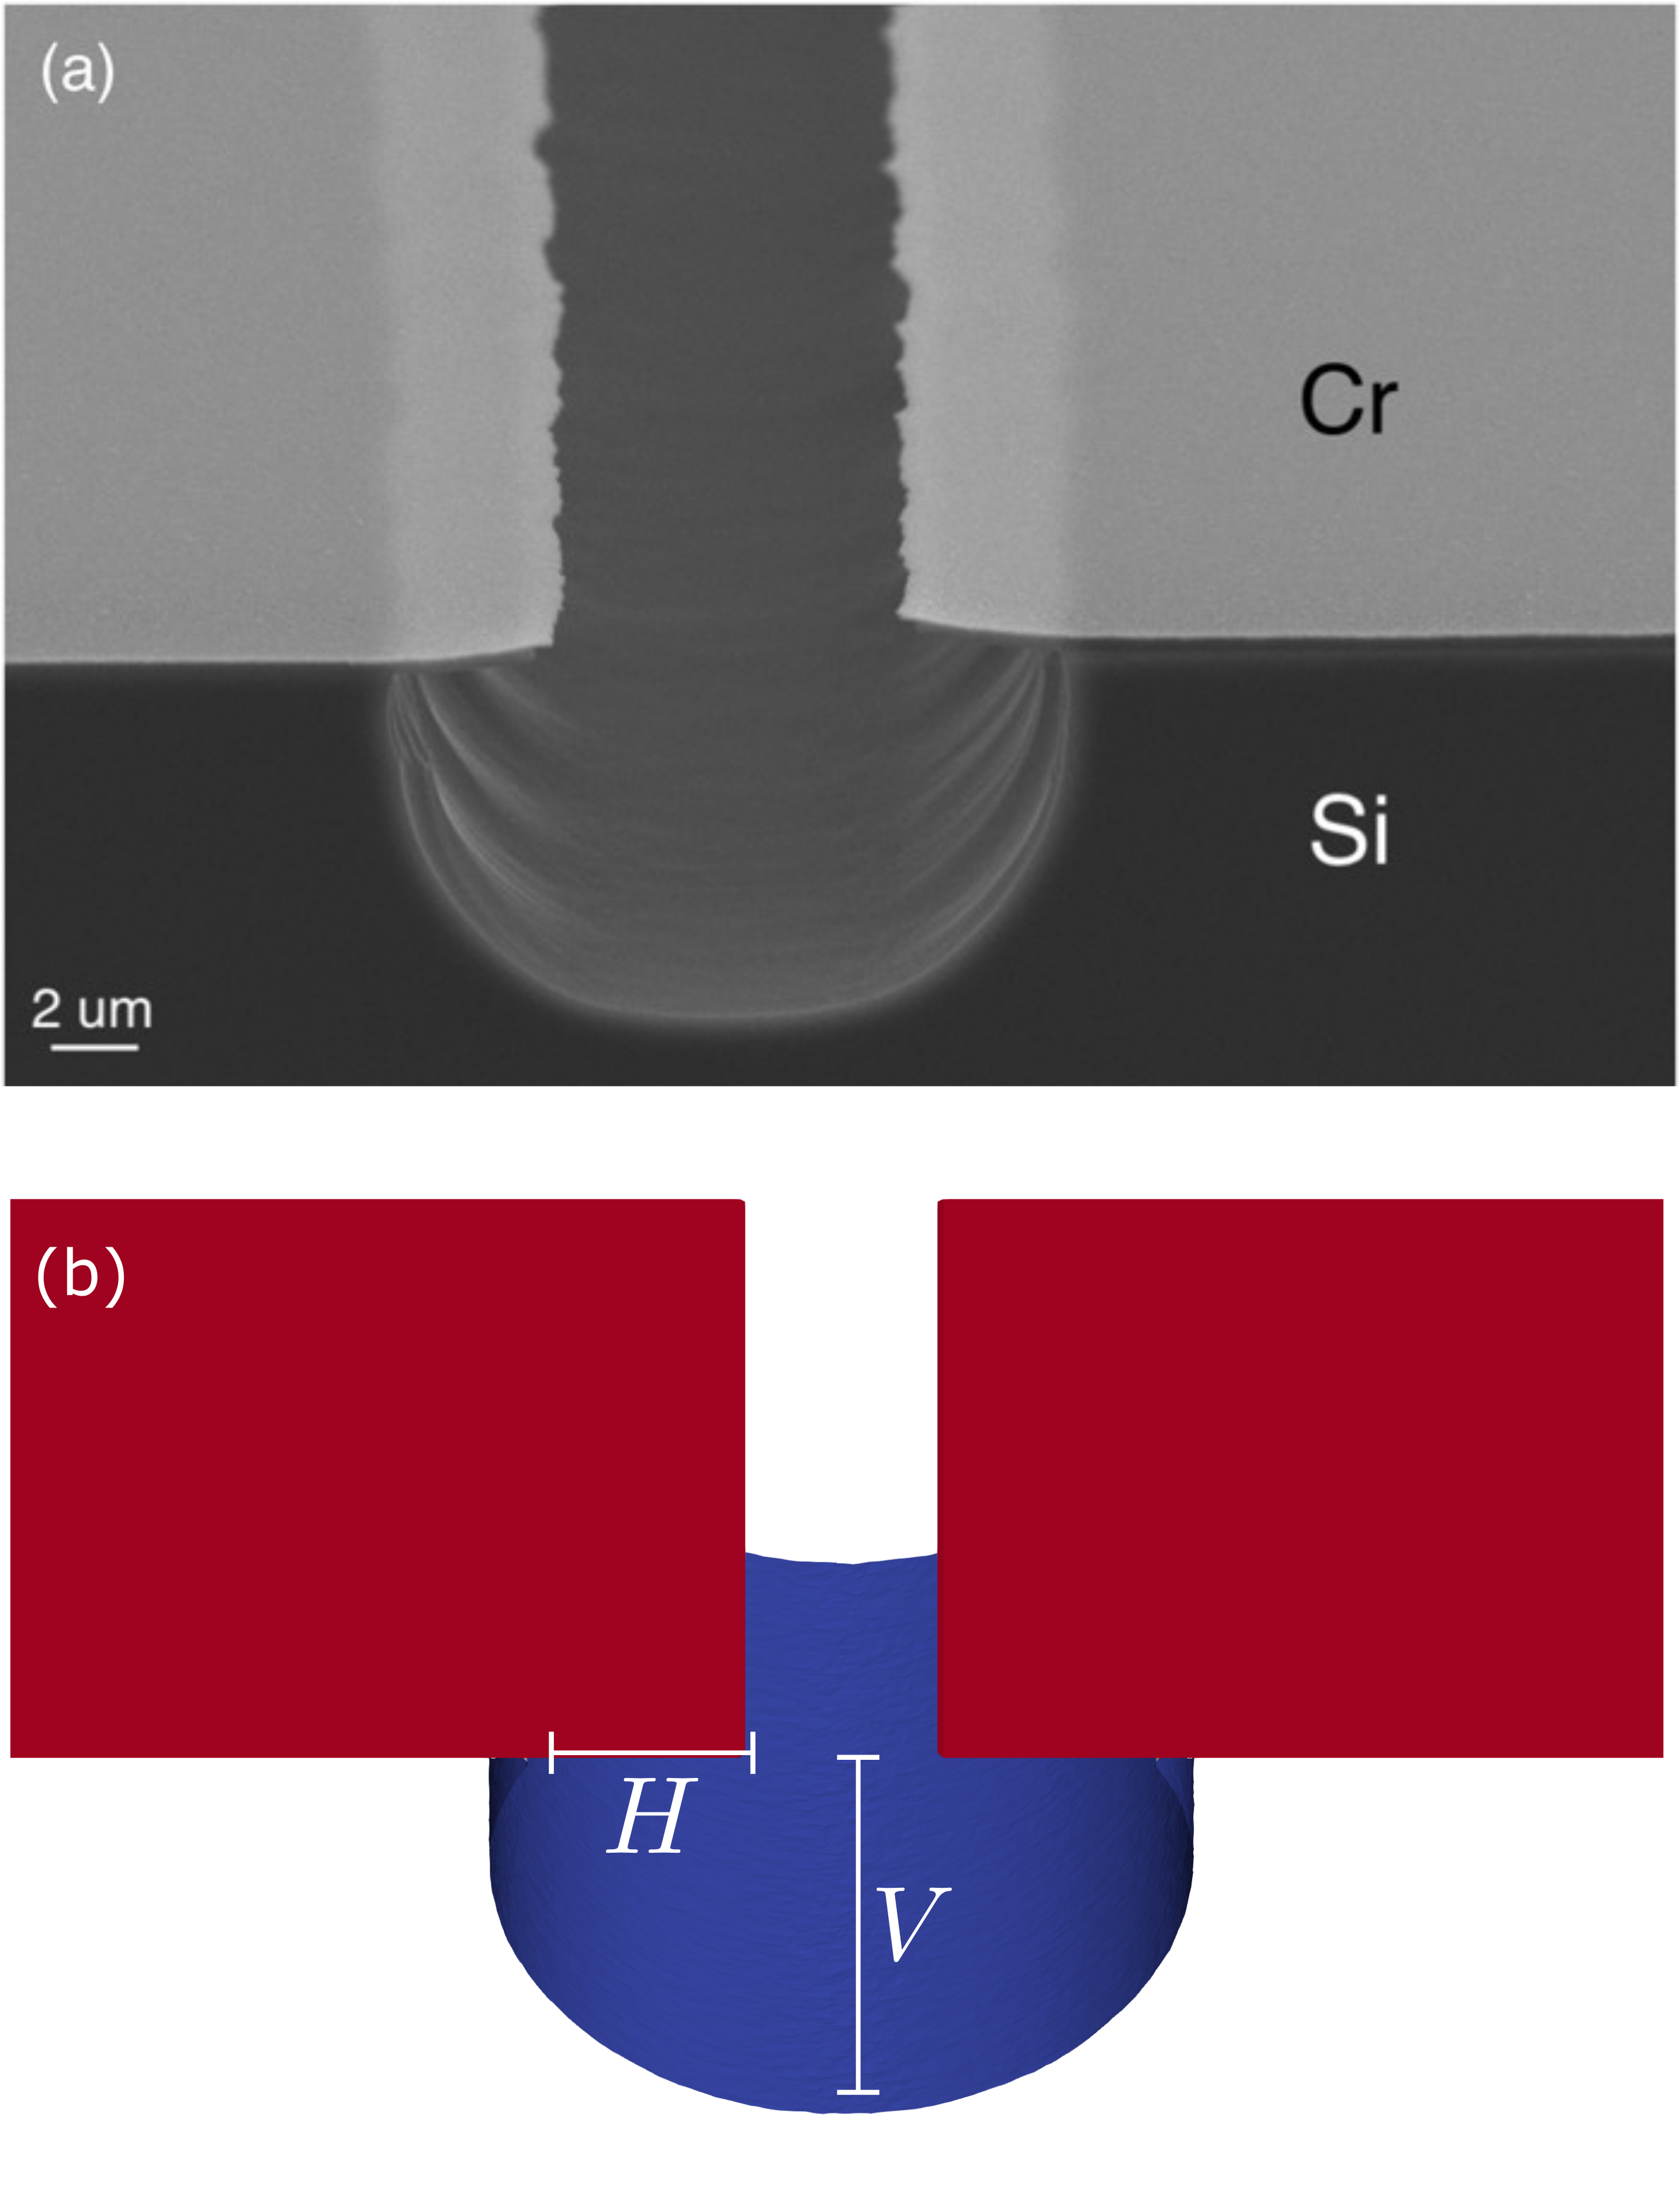
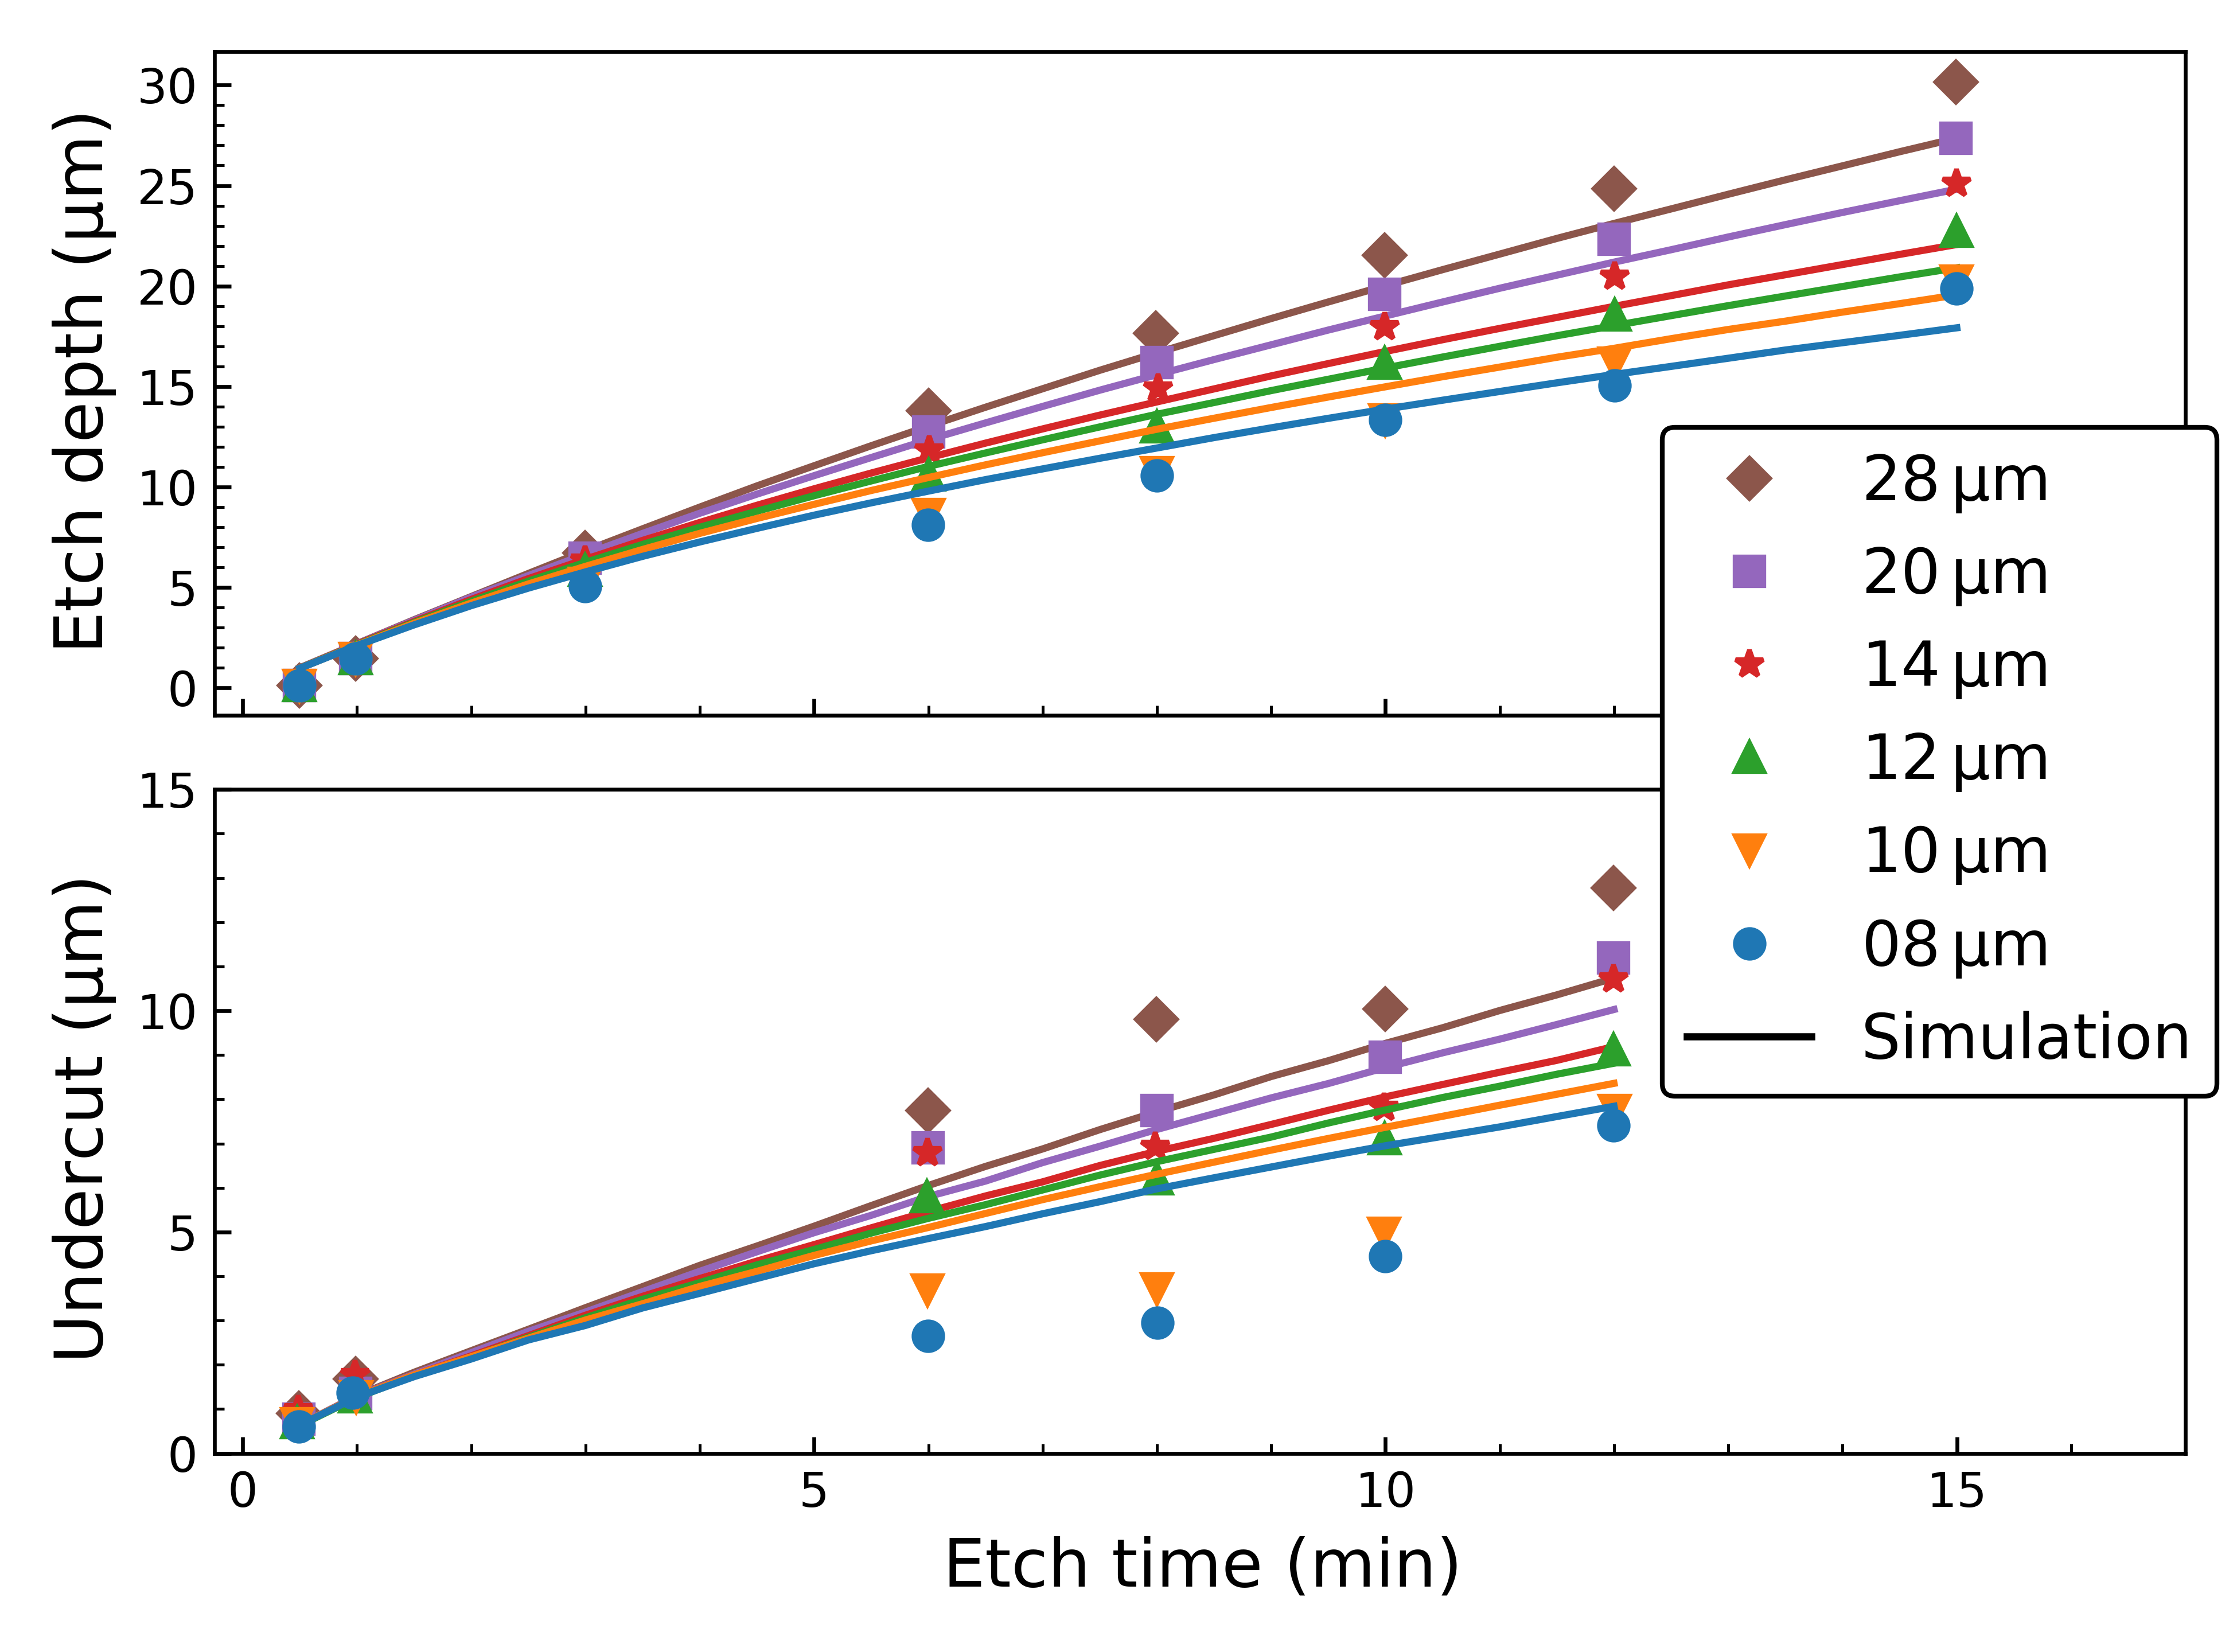
The parameters are manually calibrated to the reported values of two geometric quantities of interest — the undercut \(H\) and the etch depth \(V\)— for different etch times [171] and are stated in Tab. 5.6. As an illustration, a comparison between a simulated geometry and a SEM image is shown in Fig. 5.5 for the trench with
\(d=\SI {8}{\micro \meter }\), including a representation of \(H\) and \(V\). The time evolution of these geometrical quantities during etching is shown in Fig. 5.6.
Due to the use of a mechanical stylus profilometer in the measurement of the undercut, there is substantial noise in the reported values. This leads to challenges in the calibration procedure which instead focuses on the etch depth
and describes the evolution of the undercut qualitatively.
.
Parameter
Calibrated value
\(\mathit {PWR}_{\mathrm {Si}}\)
\(\SI {2.40}{\micro \meter \per \minute }\)
\(\mathit {PWR}_{\mathrm {hardmask}}\)
\(\SI {0.00}{\micro \meter \per \minute }\)
\(\beta _{\mathrm {Si}}\)
\(50\,\%\)
\(\beta _{\mathrm {hardmask}}\)
\(5\,\%\)
Table 5.6: Top-down model parameters calibrated to experimental trench undercut and etch depth reported by Panduranga et al. [171].
In summary, the good agreement shown in Figs. 5.4 to 5.6 is strong evidence of the suitability of the top-down
approach. Only two parameters are required per material and etch step to achieve this agreement even for different geometries and etch times: The PWR and \(\beta _\mathrm {eff}\). The former can be initially
estimated from the etch depths of large features and usually falls in known ranges [185, 186]. However, as discussed in Section 5.3, attention must be placed to correctly
consider the reactor loading effect. It is in the sticking coefficient that the particularities of each reactor configuration express themselves, since substantially different values are reported in Tabs. 5.2, 5.5, and 5.6. Nonetheless, this quantity is fixed for each
reactor condition. This is supported by recent experimental studies which connect \(\beta _\mathrm {Si}\) and related quantities, like the reaction probability, to plasma properties. Most notably, \(\beta _\mathrm {Si}\)
appears to be strongly connected the fluorine radical density but has only minor variations with temperature [45, 181]. Therefore, the sticking coefficient can be taken as a phenomenological proxy of the reactor setup.