5.5 Relationship between Degree of Isotropy and Sticking Coefficient
As discussed in Section 5.4, the phenomenological parameters are remarkably representative of the reactor conditions. From all parameters in the context of low-bias SF6
etching of Si, the most crucial is the constant effective sticking coefficient of the fluorine reactant on silicon (\(\beta _\mathrm {Si}\)). Therefore, it is important to investigate how this parameter relates to
experimentally-accessible geometric quantities of interest of etched features. If such a relationship can be clearly established, an "inverse modeling" connection can be obtained: Given experimental measurements of features, the
model parameters can be estimated. Thus, information about the surface chemistry can be inferred from the experimental topography.
To that end, it is necessary to define an empirically-accessible metric which can then be linked to \(\beta _\mathrm {Si}\). Based on the undercut \(H\) and the etch depth \(V\) shown in Fig. 5.5.b), the degree of isotropy \(I\) can be defined as [171]:
\(\seteqnumber{0}{5.}{1}\)
\begin{align}
\label {eq::degree_isotropy} I = \frac {H}{V}
\end{align}
The definition in Eq. (5.2) is analogous to the step coverage defined for atomic layer deposition (ALD) in Section 4.4. Fundamentally, the concept of isotropy in etching is equivalent to conformality in deposition [129]. An ideally isotropic etching process leads to \(I{=}1\), while a perfectly
vertical process, like the one presented in Section 3.6.1, leads to \(I{=}0\). In several cases, however, an intermediate value of \(I\) is required.
This is often the case in, e.g., laser cavity and other optical applications. As shown in Figs. 5.1 and 5.2, an ideally isotropic
process leads to a perfectly flat region below the original opening, which is an undesirable feature for optical applications [187].
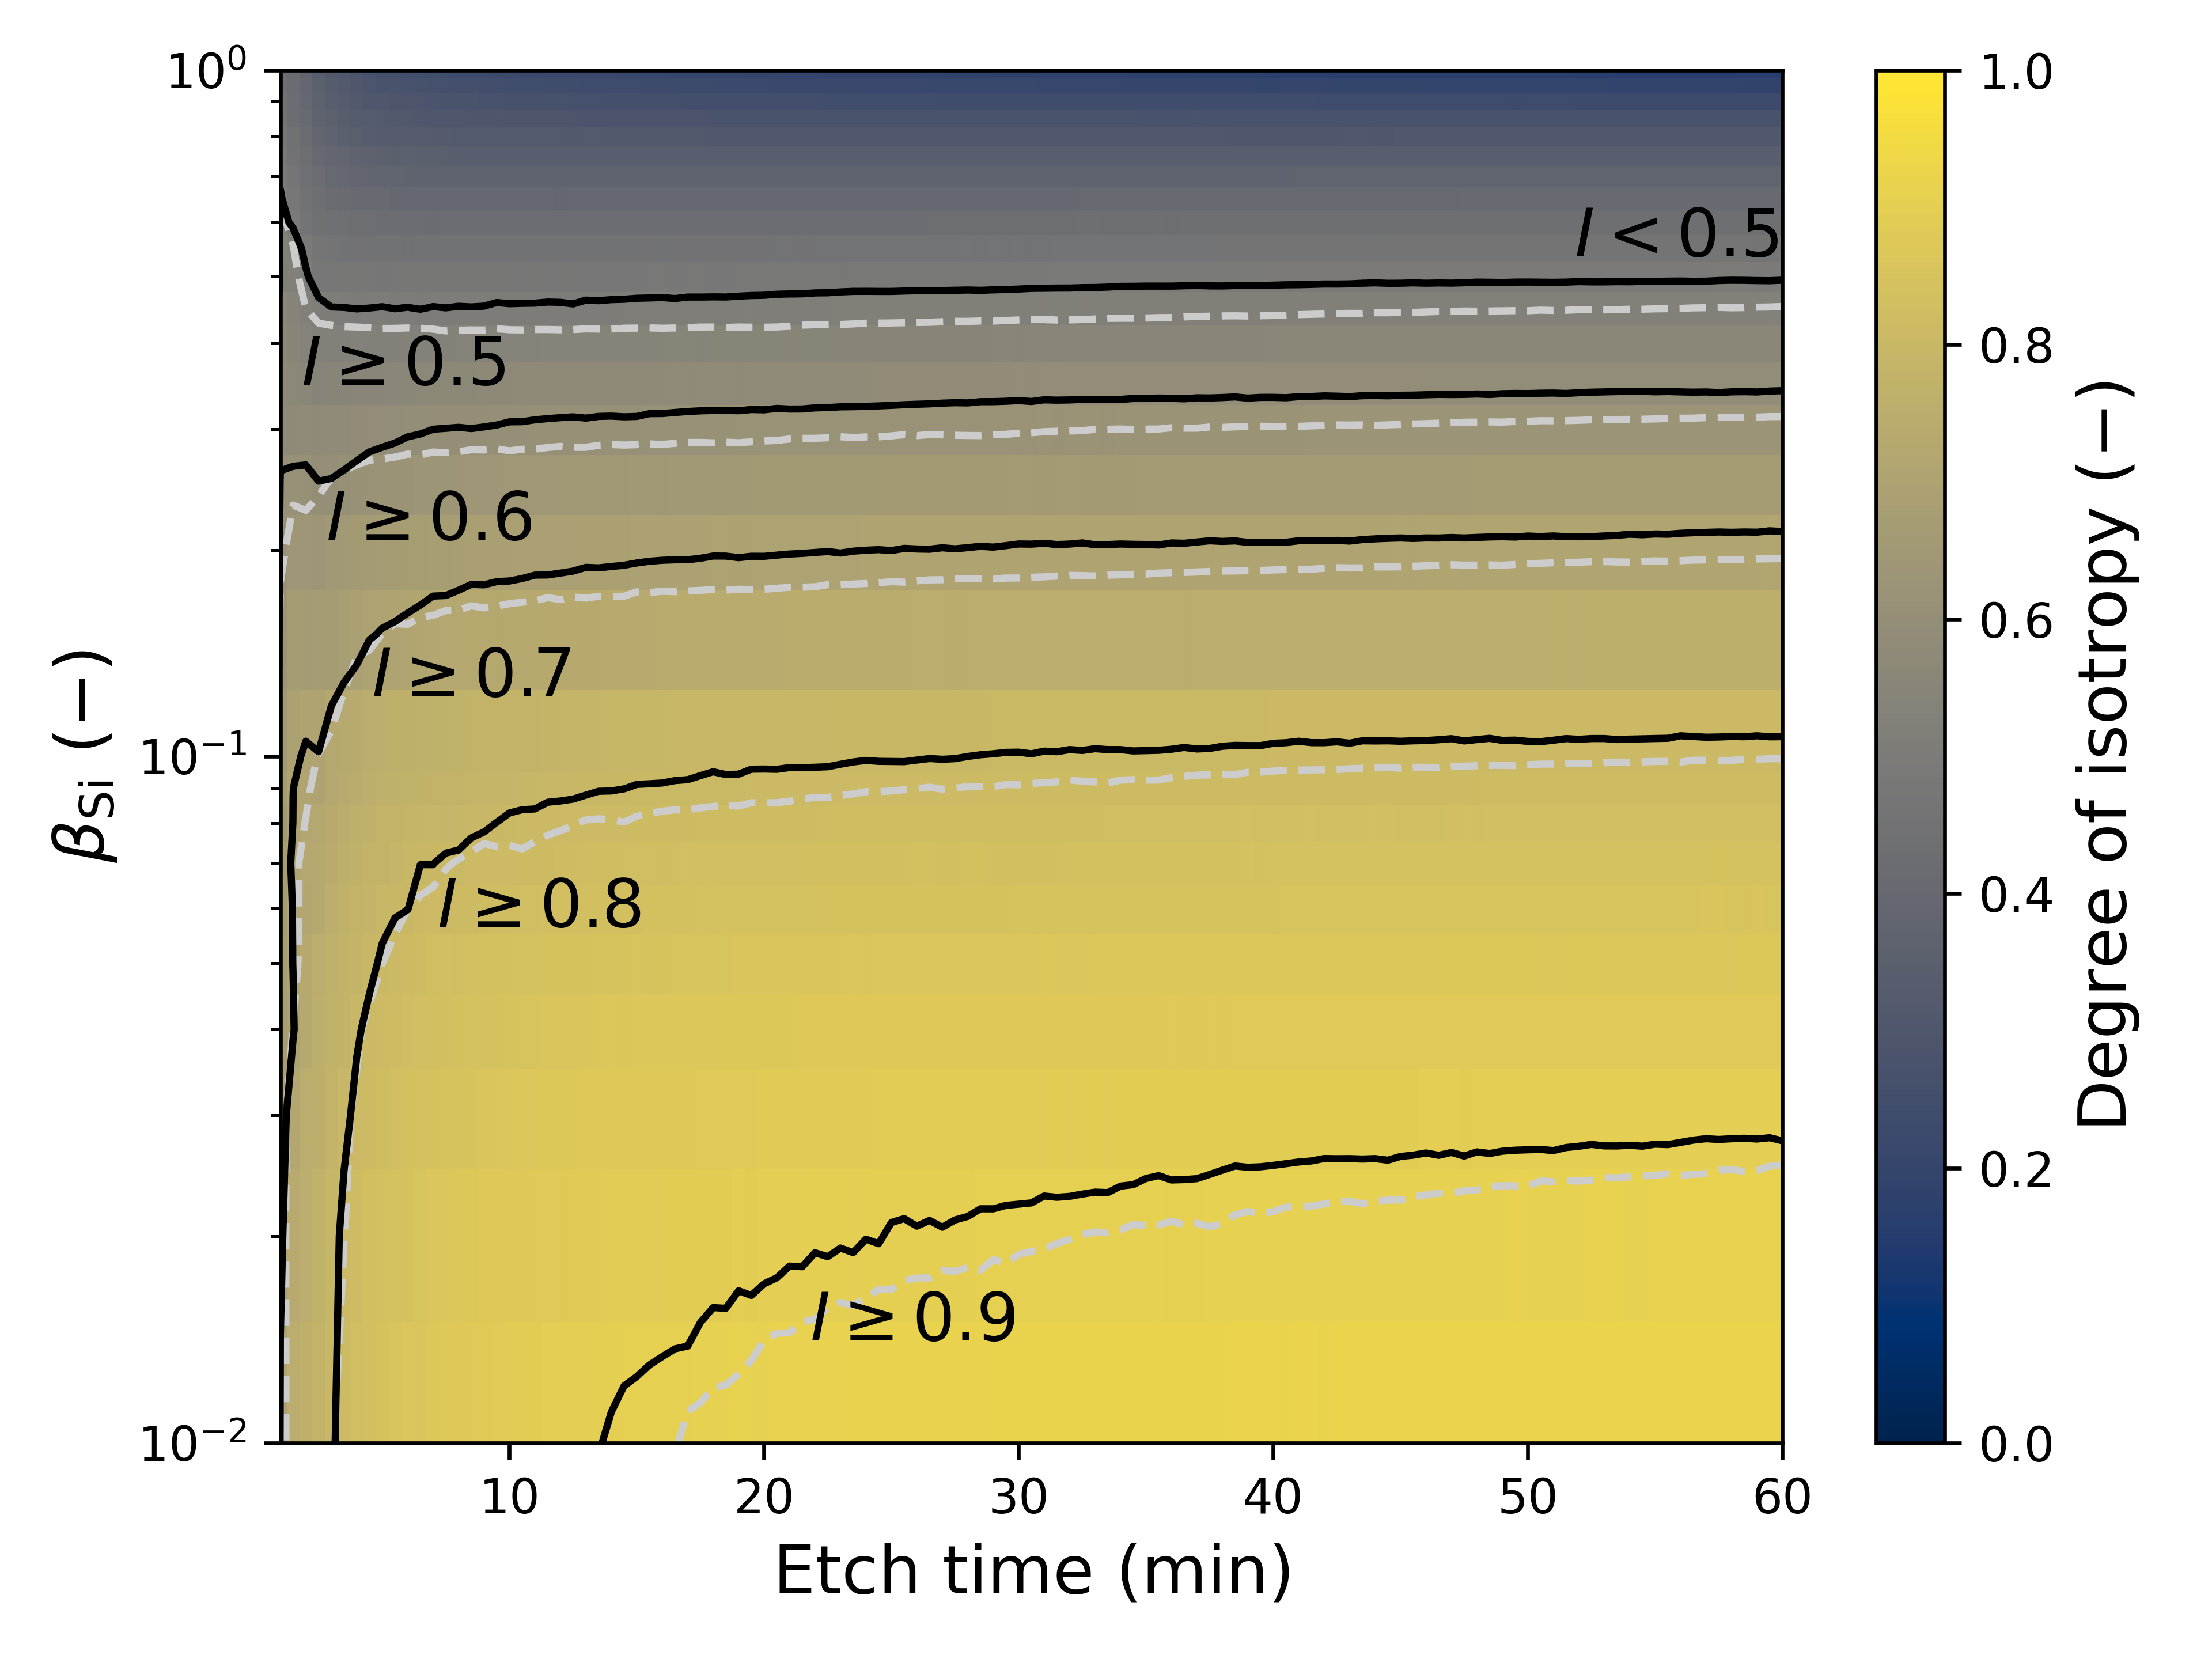
For the exploration of the relationship between \(\beta _\mathrm {Si}\) and \(I\), several topography simulations are performed. The experimental setup from Panduranga et al. [171] is considered for a trench
with \(d=\SI {12}{\micro \meter }\). All parameters except for \(\beta _\mathrm {Si}\) are thus taken from the calibrated values in Tab. 5.6. As it is considered a
proxy for alternative reactor conditions, \(\beta _\mathrm {Si}\) is varied between \(1\,\%\) and \(100\,\%\). For each value of \(\beta _\mathrm {Si}\), the etch is performed for \(\SI {1}{\hour }\) and the degree of
isotropy is extracted every \(\SI {30}{\second }\). Therefore, reactors with different loading conditions and PWRs can also be captured by adjusting the timescale. This analysis is plotted in Fig. 5.7, additionally including the contour map of \(I\) for a different trench with \(d=\SI {60}{\micro \meter }\).
From comparing the \(I\) contour lines from the trenches with \(\SI {12}{\micro \meter }\) and \(\SI {60}{\micro \meter }\) openings in Fig. 5.7, it can be noted
that there is only a very limited impact of varying \(d\). Similar remarks are made in the original publication [171]. Additionally, the etch time does not appear to impact the degree isotropy after a certain saturation period.
Therefore, it can be concluded that \(I\) is fundamentally a function of \(\beta _\mathrm {Si}\) and, subsequently, defined by the reactor condition.
An empirical relationship can now be constructed between \(I\) and \(\beta _\mathrm {Si}\). This is done by fixing the etch times to \(5\), \(10\), and \(\SI {50}{\minute }\) in Fig. 5.7. This relationship, shown in Fig. 5.8, is the sought inverse connection between experimental topographies and the model
parameters. Since the degree of isotropy is an empirically measurable property, its value can be used in Fig. 5.8 to provide an estimate of the sticking coefficient. This is not only
useful as a starting point for calibrations of topography simulations, but also enables process developers to make inferences about the state of the reactor from topography measurements.
The empirical relationship in Fig. 5.8 is further examined by applying it to situations with different reactor configurations and feature geometries, that is, the other experiments
and calibrations presented in this chapter. The line marked "Larsen 2005" shows the range of \(I\) extracted from the reported SEM profiles [49] as well as the manually calibrated \(\beta _\mathrm {Si}\) from Tab. 5.5. The wide range of \(I\) is partly due to the previously discussed photoresist bending phenomenon. In addition, the cavities presented in Section 5.2 have their values of \(\beta _\mathrm {Si}\) and \(I\) after the first etch step presented with the label "Cavity". In both of these situations, good agreement is shown
between the calibrated values and those expected from the empirical relationship. For the etched cavities, the somewhat larger deviation is in part explained by the fact that the geometries are different. Specifically, they are holes
with cylindrical symmetry which are not entirely equivalent to long trenches, as discussed in Section 3.3.
Nevertheless, this examination shows that the empirical relationship shown in Fig. 5.8 is powerful and complementary to automatic calibration processes. It can also be applied
to fine-tune etching processes by interpreting \(\beta _\mathrm {Si}\) as a proxy variable to the reaction probability of fluorine radicals with silicon. Recent studies have shown that the reaction rates decrease with an increase of
plasma flux of fluorine radicals \(\Gamma _\mathrm {source,F}\) [45, 181]. For example, if the measured degree of isotropy is too low for a certain application, a process developer should consider adjusting the process in
order to increase \(\Gamma _\mathrm {source,F}\) and thus reduce \(\beta _\mathrm {Si}\). To further optimize this process, the development of an explicit mapping between \(\Gamma _\mathrm {source,F}\) and \(I\)
through experimentally-grounded topography simulation is an appealing area of future research.